Components of NCD surveillance e g surveillance of


- Slides: 21
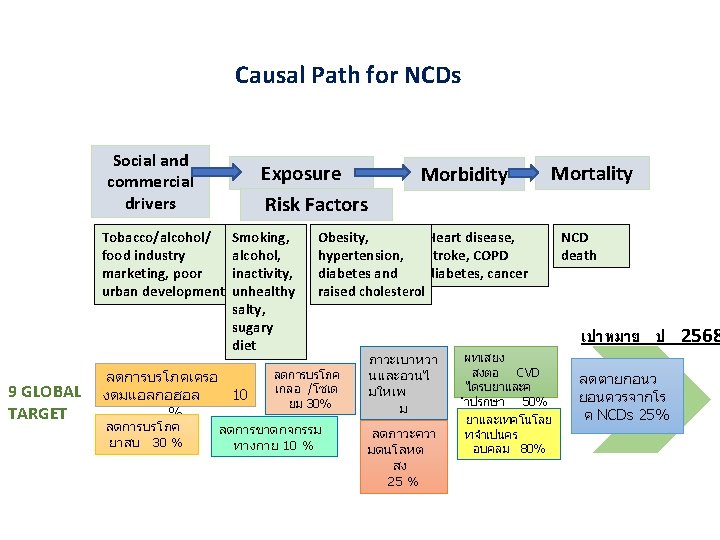
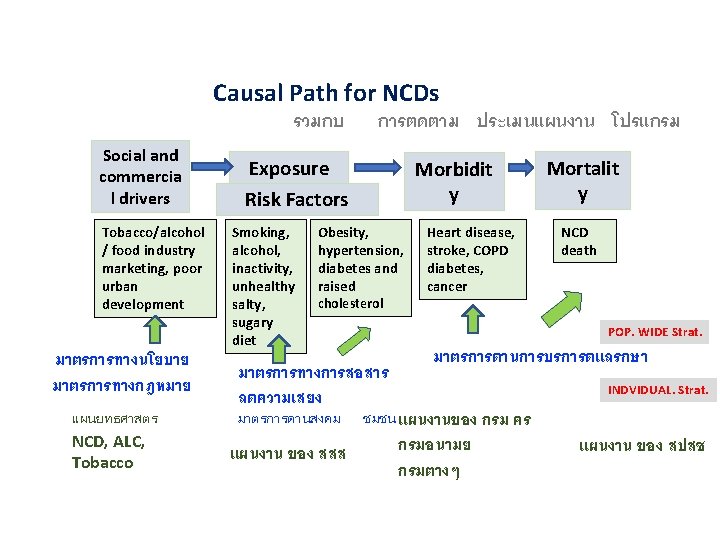
Components of NCD surveillance ❹ ❺ e. g, surveillance of inappropriate media ads, Drivers Populationbased surveys NHES, BRFSS, NSO, other ❹ Settings: school: GYTS, GSHS, workplace ❷ ❸ Cancer Registries HDC ❸ Health facility surveys (NHSO) Exposure Morbidity ❶ Civil registratio n & vital statistics (CRVS) Mortality Risk Factors Tobacco/alcohol / food industry marketing, poor urban development Smoking, alcohol, inactivity, unhealthy salty, sugary diet Heart disease, Obesity, stroke, COPD hypertension, diabetes, cancer diabetes and raised cholesterol NCD death
จงหวด ส: เบาหวาน ประเทศ Total POP =>15+ = 480, 996 Total POP =>35+ = 275, 796 Screening 35+ = 233, 299 = 84. 6% Pre DM = 15, 650 = 6. 71% Case DM = 26, 494 = 9. 61% DM Control ได 34. 8% Complication 5. 5 % 6. 9 %
จงหวด ส : ความดนฯ Total POP =>15+ = 480, 996 Total POP =>35+ = 275, 796 ประเทศ Screening 35+ = 244, 152 = 88. 5% เสยงสง = 45, 160 = 18. 50% Case HT = 68, 973 =25. 01% HT Control ได N/A Complication N/A 21. 4 %
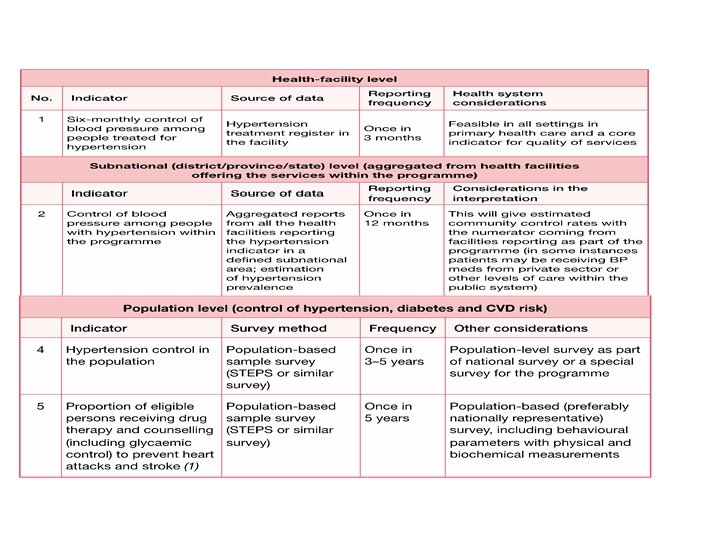
Standardized Core indictors Indicator 1: patient hypertension control % of registered patients with controlled BP (<140/90) at last visit (report quarterly) Indicator 2: Hypertension control coverage Proportion of patients with hypertension who have control BP in an area ( report annually) N: patients registered 6 -9 months previously with hypertension with controlled BP during the last clinical visit in last quarter N: patients with controlled hypertension D : Estimate number of people with hypertension D: : patients registered for hypertension treatment during the quarter that end 6 months previously Indicator 3: Community –Level Hypertension control Prevalence of controlled hypertension in the community (approximately every 5 years) N: patients with hypertension with BP controlled to <140/90 D: All patients with hypertension
Hypertension Indicators and Targets Indicators and purpose Numerator and denominator Source 2014 2019 2024 Population level indicators (Analysed and monitored every five years for national level and the four Regions) 1 N: Number of adult respondents who report having their NHES 65% 80% 90% Measurement of blood pressure Indicative of access of population to blood pressure measured at least once in the past year D: Total number of adult respondents pressure measurement 2 Diagnosis of hypertension Indicative of access of people with hypertension to diagnosis 3 Treatment of hypertension Indicative of access of people with hypertension to treatment 4 Controlled hypertension in the population This is an impact indicator which is indicative of blood pressure control among ALL people with hypertension in the community N: Number of adult respondents who report either having NHES been diagnosed with high blood pressure or who report being currently treated with medication for high blood pressure D: Total number of adult respondents with hypertension 1 55% 70% 85% N: Number of respondents who report currently treated with NHES medication for high blood pressure D: Total number of adult respondents with hypertension 1 50% 65% 80% N: Number of respondents who report being currently NHES treated with medication for high blood pressure or have been diagnosed with hypertension and have SBP<140 mm Hg and DBP<90 mm Hg D: Total number of adult respondents with hypertension 1 30% 50% 70%
Hypertension Indicators and Targets (ตอ ( Indicators and purpose Numerator and denominator 5. Blood pressure measurement at clinic N: Number of adult clinic attendees with documented blood pressure reading at every visit D: Total number of adult clinic attendees N: Number of screened clinic attendees with a raised BP reading (SBP>140 or DBP>90) receiving a diagnosis of hypertension within one month after hospital-based screening D: Total number of clinic attendees with a raised BP readings (SBP>140 or DBP>90) at hospital-based screening N: Number of clinic attendees with confirmed hypertension diagnosis started on treatment within one month after diagnosis D: Total number of clinic attendees with confirmed hypertension diagnosis N: Number of registered patients who visited a clinic at least two times in the past year D: Total number of patients registered for hypertension treatment N: Number of treated patients with SBP <140 and DBP<90 at last visit within the past year D: Total number of patients registered for hypertension treatment Source 2014 2019 HDC ? >95% HDC NA 60% 70% HDC NA 60% 70% HDC 70% 80% 90% HDC ? 65% 75% 80% 2024 Clinic level indicators (Analysed and monitored every year for District, Province, Region and National levels) This indicator informs about compliance with standard of care which requires that ALL adult clinic attendees should have their BP measured at every visit 6. Timeliness of diagnosis after hospital-based screening Indicative of delay in diagnosis (normotensive, prehypertension, confirmed hypertension) after hospital-based screening 7. Timeliness of treatment after confirmed hypertension diagnosis Indicative of delay in starting treatment after diagnosis with confirmed hypertension 8. Continuity of hypertension treatment Indicative of follow-up and adherence to treatment 9 Hypertension control in treated patients Indicative of quality of clinical care among treated patients at Mo. PH clinics