Colorado Lottery Tracking Study Presentation Wave 17 January
- Slides: 63
Colorado Lottery Tracking Study Presentation Wave 17 January 2016
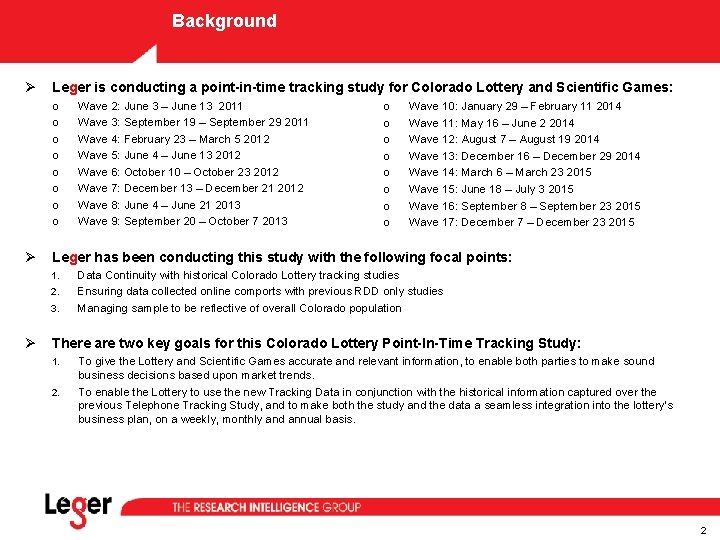
Background Ø Leger is conducting a point-in-time tracking study for Colorado Lottery and Scientific Games: o o o o Ø o o o o Wave 10: January 29 – February 11 2014 Wave 11: May 16 – June 2 2014 Wave 12: August 7 – August 19 2014 Wave 13: December 16 – December 29 2014 Wave 14: March 6 – March 23 2015 Wave 15: June 18 – July 3 2015 Wave 16: September 8 – September 23 2015 Wave 17: December 7 – December 23 2015 Leger has been conducting this study with the following focal points: 1. 2. 3. Ø Wave 2: June 3 – June 13 2011 Wave 3: September 19 – September 29 2011 Wave 4: February 23 – March 5 2012 Wave 5: June 4 – June 13 2012 Wave 6: October 10 – October 23 2012 Wave 7: December 13 – December 21 2012 Wave 8: June 4 – June 21 2013 Wave 9: September 20 – October 7 2013 Data Continuity with historical Colorado Lottery tracking studies Ensuring data collected online comports with previous RDD only studies Managing sample to be reflective of overall Colorado population There are two key goals for this Colorado Lottery Point-In-Time Tracking Study: 1. 2. To give the Lottery and Scientific Games accurate and relevant information, to enable both parties to make sound business decisions based upon market trends. To enable the Lottery to use the new Tracking Data in conjunction with the historical information captured over the previous Telephone Tracking Study, and to make both the study and the data a seamless integration into the lottery’s business plan, on a weekly, monthly and annual basis. 2
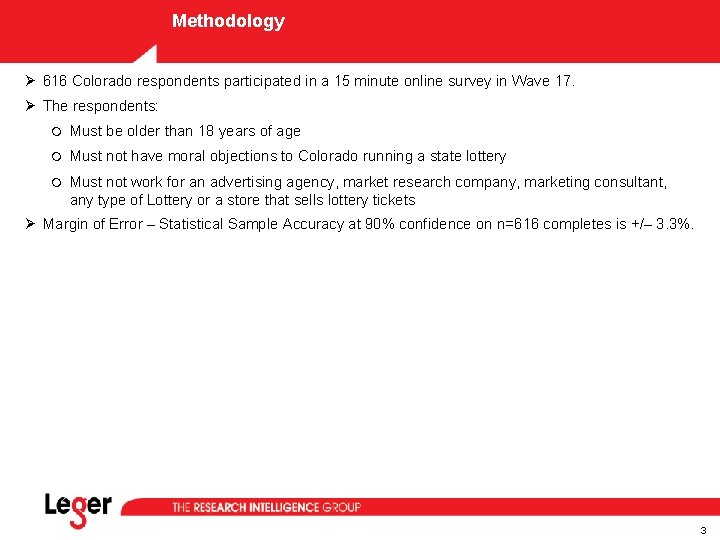
Methodology Ø 616 Colorado respondents participated in a 15 minute online survey in Wave 17. Ø The respondents: Must be older than 18 years of age Must not have moral objections to Colorado running a state lottery Must not work for an advertising agency, market research company, marketing consultant, any type of Lottery or a store that sells lottery tickets Ø Margin of Error – Statistical Sample Accuracy at 90% confidence on n=616 completes is +/– 3. 3%. 3
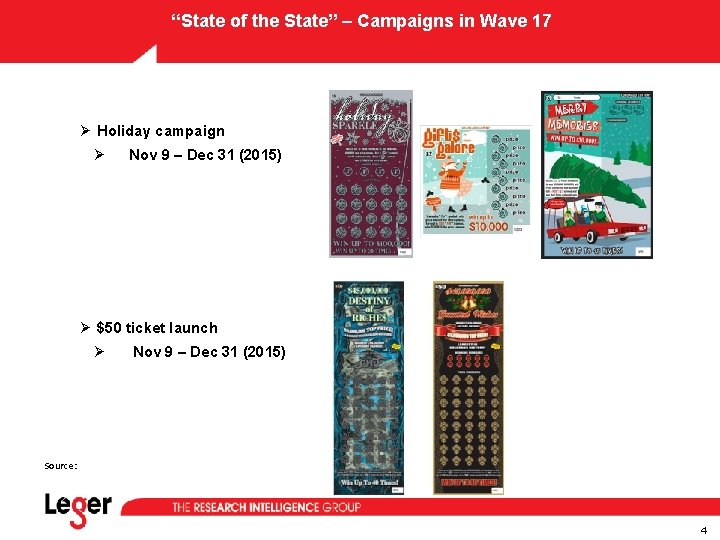
“State of the State” – Campaigns in Wave 17 Ø Holiday campaign Ø Nov 9 – Dec 31 (2015) Ø $50 ticket launch Ø Nov 9 – Dec 31 (2015) Source: 4
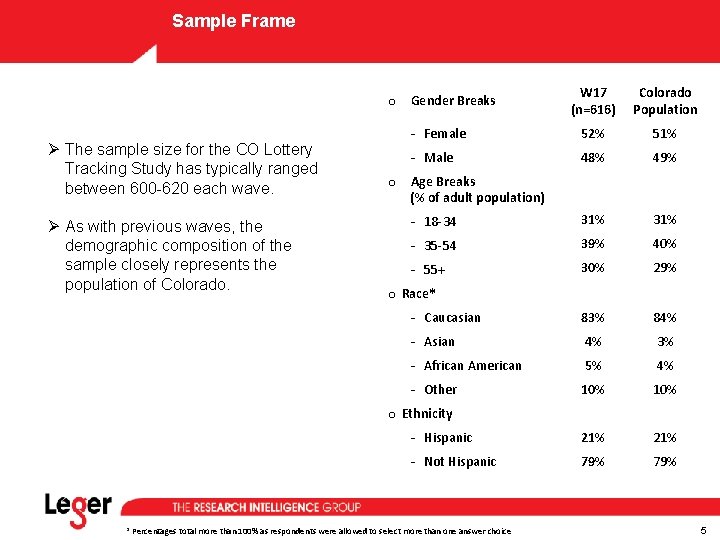
Sample Frame Ø The sample size for the CO Lottery Tracking Study has typically ranged between 600 -620 each wave. Ø As with previous waves, the demographic composition of the sample closely represents the population of Colorado. o Gender Breaks W 17 (n=616) Colorado Population - Female 52% 51% - Male 48% 49% - 18 -34 31% - 35 -54 39% 40% - 55+ 30% 29% - Caucasian 83% 84% - Asian 4% 3% - African American 5% 4% - Other 10% - Hispanic 21% - Not Hispanic 79% o Age Breaks (% of adult population) o Race* o Ethnicity * Percentages total more than 100% as respondents were allowed to select more than one answer choice 5
Key Findings & Recommendations
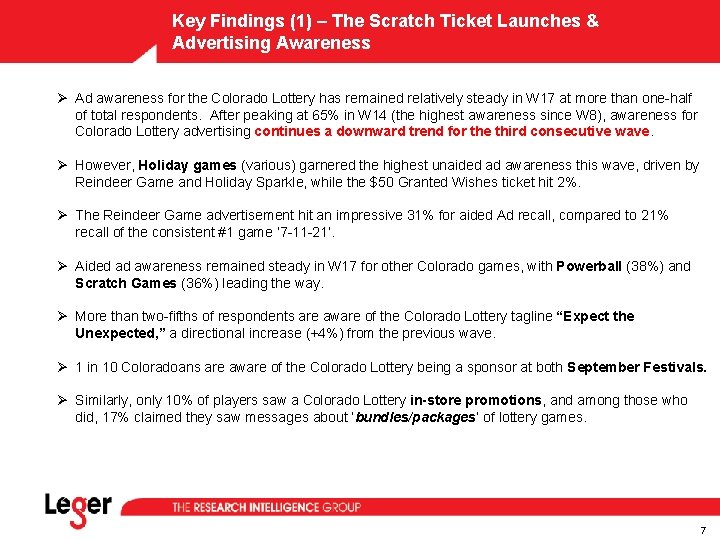
Key Findings (1) – The Scratch Ticket Launches & Advertising Awareness Ø Ad awareness for the Colorado Lottery has remained relatively steady in W 17 at more than one-half of total respondents. After peaking at 65% in W 14 (the highest awareness since W 8), awareness for Colorado Lottery advertising continues a downward trend for the third consecutive wave. Ø However, Holiday games (various) garnered the highest unaided ad awareness this wave, driven by Reindeer Game and Holiday Sparkle, while the $50 Granted Wishes ticket hit 2%. Ø The Reindeer Game advertisement hit an impressive 31% for aided Ad recall, compared to 21% recall of the consistent #1 game ‘ 7 -11 -21’. Ø Aided ad awareness remained steady in W 17 for other Colorado games, with Powerball (38%) and Scratch Games (36%) leading the way. Ø More than two-fifths of respondents are aware of the Colorado Lottery tagline “Expect the Unexpected, ” a directional increase (+4%) from the previous wave. Ø 1 in 10 Coloradoans are aware of the Colorado Lottery being a sponsor at both September Festivals. Ø Similarly, only 10% of players saw a Colorado Lottery in-store promotions, and among those who did, 17% claimed they saw messages about ‘bundles/packages’ of lottery games. 7
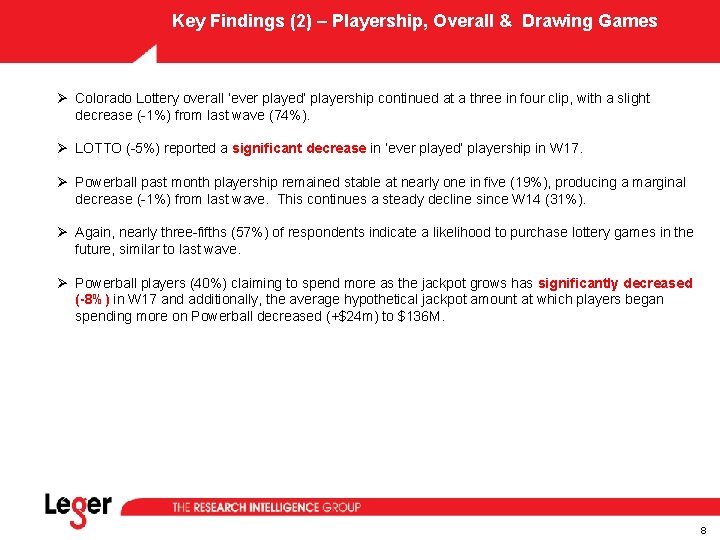
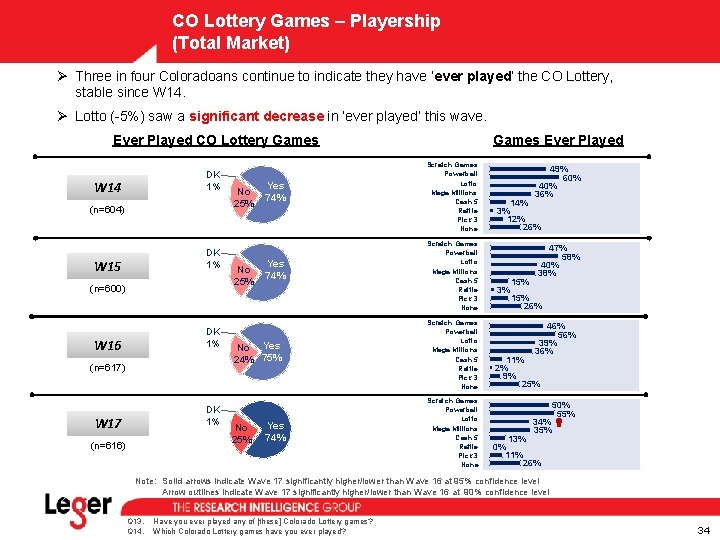
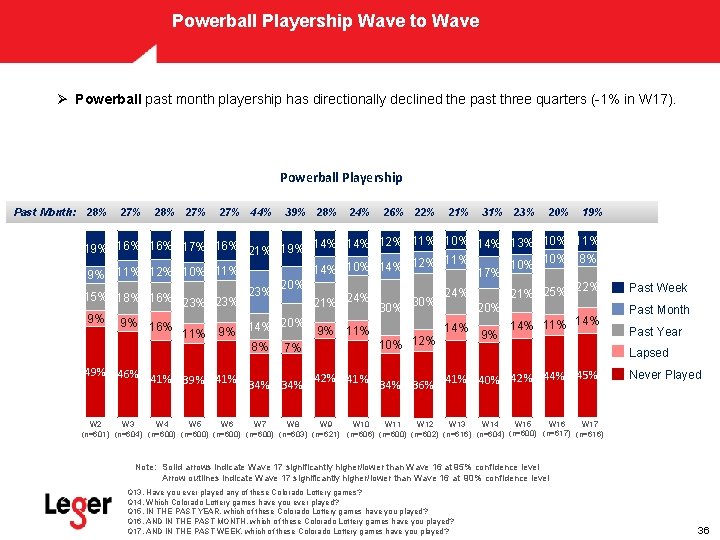
Key Findings (2) – Playership, Overall & Drawing Games Ø Colorado Lottery overall ‘ever played’ playership continued at a three in four clip, with a slight decrease (-1%) from last wave (74%). Ø LOTTO (-5%) reported a significant decrease in ‘ever played’ playership in W 17. Ø Powerball past month playership remained stable at nearly one in five (19%), producing a marginal decrease (-1%) from last wave. This continues a steady decline since W 14 (31%). Ø Again, nearly three-fifths (57%) of respondents indicate a likelihood to purchase lottery games in the future, similar to last wave. Ø Powerball players (40%) claiming to spend more as the jackpot grows has significantly decreased (-8%) in W 17 and additionally, the average hypothetical jackpot amount at which players began spending more on Powerball decreased (+$24 m) to $136 M. 8
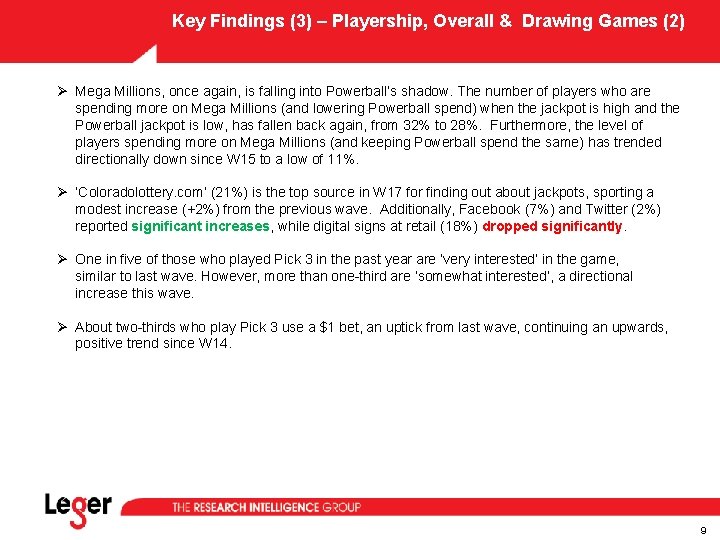
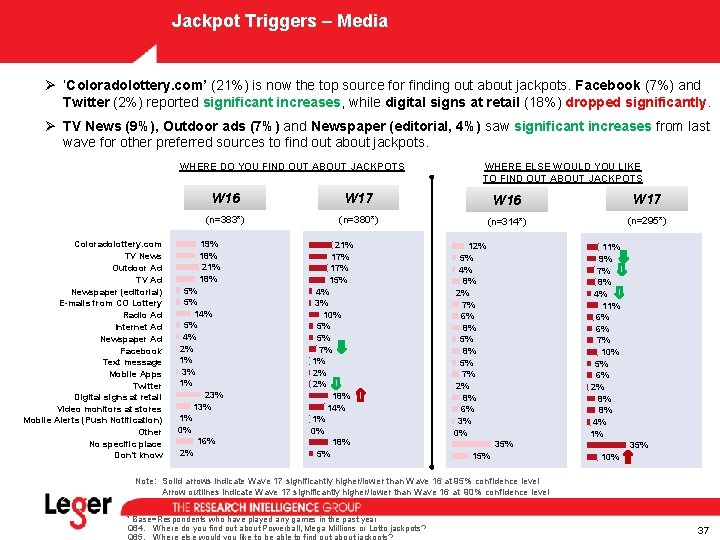
Key Findings (3) – Playership, Overall & Drawing Games (2) Ø Mega Millions, once again, is falling into Powerball’s shadow. The number of players who are spending more on Mega Millions (and lowering Powerball spend) when the jackpot is high and the Powerball jackpot is low, has fallen back again, from 32% to 28%. Furthermore, the level of players spending more on Mega Millions (and keeping Powerball spend the same) has trended directionally down since W 15 to a low of 11%. Ø ‘Coloradolottery. com’ (21%) is the top source in W 17 for finding out about jackpots, sporting a modest increase (+2%) from the previous wave. Additionally, Facebook (7%) and Twitter (2%) reported significant increases, while digital signs at retail (18%) dropped significantly. Ø One in five of those who played Pick 3 in the past year are ‘very interested’ in the game, similar to last wave. However, more than one-third are ‘somewhat interested’, a directional increase this wave. Ø About two-thirds who play Pick 3 use a $1 bet, an uptick from last wave, continuing an upwards, positive trend since W 14. 9
Key Findings (4) – Scratch Games, Vending Machines, Monitors Ø The gap continues to open up between those spending more and those spending less on Scratch over the past year, from -9% (W 16) to -11% (W 17). The proportion of players spending claiming to spend either more or less has increased significantly from last wave. Ø More than two-thirds (70%) of all Scratch players have purchased tickets from Lottery Vending Machines, up significantly (+9%) from last wave. Ø The level to which players are increasing their Lottery spend by using vending machines bounced back slightly this wave (+3%), after decreasing significantly from W 15 to W 16. Ø As in the previous wave, nearly one-half (45%) of Coloradoans have very/somewhat positive feelings toward the Lottery in W 17, down just -1% versus W 16. Ø Likelihood to recommend the Colorado Lottery remained at nearly 25% (top 3 box). Ø About one in seven (15%) claim a news story will affect their spend on Lottery in a minor OR major way, a significant decrease from W 16 (20%). Ø In-store video monitor awareness reported a slight uptick this wave (+2% to 37%), with approximately half recall seeing the monitors at the checkout or customer service area. Ø The main reason for using video monitors continues to be ‘to check the jackpot sizes’, however, there has been a significant increase from W 16 ‘to check the Colorado Lottery news’. 10
Recommendations/Insights 1. Lottery Vending Machine-based purchases increased this wave to an all-time high of 70%, potentially driven by players feeling either more comfortable with the vending machines, and/or stores being busier due to the holiday period. The Colorado Lottery could potentially utilize the machines, and the areas directly surrounding the machines, even more, to inform players of new lottery promotions, marketing and games. 2. The price of the ticket, with the launch of the $50 Scratch range, is even more prominent now in the eyes of the consumer. The CO Lottery could explore the opportunity for a $100 Scratch ticket, or even price points in-between the current range (perhaps a $30 or $40 ticket). 3. Over the past couple of waves, there has not been as strong a positive sentiment towards the Colorado Lottery, so there is still an opportunity for the Lottery to reinforce the benefits of the Lottery and where the proceeds go, across all media types, on a more continuous basis. It is important to at least help Millennials shape a more positive view of the Lottery as a whole, to help shape the future base for CO Lottery sales. However, increased advertising has not moved the needle. 4. Lotto, as a stand-alone game, continues to see a slow but steady decline in play. The Lottery would probably be best leaving the game to continue, without any unnecessary promotions or marketing, as the core Lotto players (generally an aging population) will play no matter what. 11
Recommendations/Insights 5. The $300 m mark now appears to be the key entry point for the National Jackpot games for lapsed/casual players. The news media also seems to pay far more attention to the $300 m mark, and the Colorado Lottery should start to be find more creative ideas to tempt causal players in at lower jackpot levels such as $150 or $200 m. Powerball currently has a distinct competitive advantage than Mega Millions, particularly in legacy Powerball states such as Colorado, which does not bode well for Mega Millions in the short-term. 6. It is important, given the current $800 m+ Powerball jackpot, to check to see exactly which other games have seen an halo effect of increased sales, simply through an increase in Lottery traffic. 12
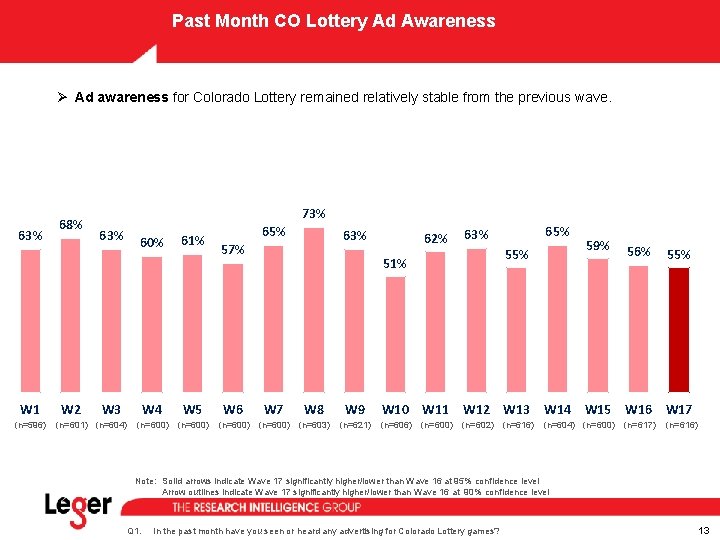
Past Month CO Lottery Ad Awareness Ø Ad awareness for Colorado Lottery remained relatively stable from the previous wave. 63% W 1 (n=596) 68% W 2 73% 60% W 3 (n=601) (n=604) 61% W 4 W 5 (n=600) 65% 63% 57% W 6 62% 55% 51% W 7 (n=600) W 8 W 9 (n=603) (n=621) 65% 63% 59% 56% 55% W 10 W 11 W 12 W 13 W 14 W 15 W 16 W 17 (n=606) (n=600) (n=602) (n=616) (n=604) (n=600) (n=617) (n=616) Note: Solid arrows indicate Wave 17 significantly higher/lower than Wave 16 at 95% confidence level Arrow outlines indicate Wave 17 significantly higher/lower than Wave 16 at 90% confidence level Q 1. In the past month have you seen or heard any advertising for Colorado Lottery games? 13
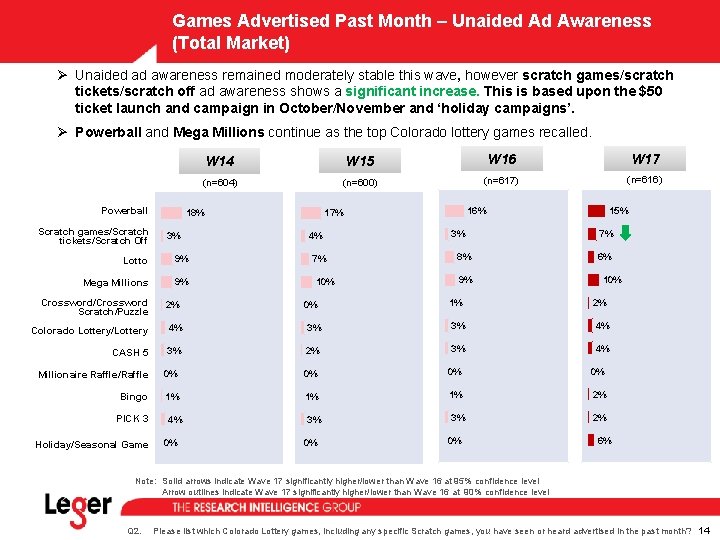
Games Advertised Past Month – Unaided Ad Awareness (Total Market) Ø Unaided ad awareness remained moderately stable this wave, however scratch games/scratch tickets/scratch off ad awareness shows a significant increase. This is based upon the $50 ticket launch and campaign in October/November and ‘holiday campaigns’. Ø Powerball and Mega Millions continue as the top Colorado lottery games recalled. Powerball Scratch games/Scratch tickets/Scratch Off W 15 W 16 W 17 (n=604) (n=600) (n=617) (n=616) 18% 3% Lotto 9% Mega Millions 9% Crossword/Crossword Scratch/Puzzle W 14 2% 16% 17% 4% 7% 10% 0% 3% 8% 9% 15% 7% 6% 10% 1% 2% Colorado Lottery/Lottery 4% 3% 3% 4% CASH 5 3% 2% 3% 4% Millionaire Raffle/Raffle 0% 0% Bingo 1% 1% 1% 2% 3% 3% 2% PICK 3 Holiday/Seasonal Game 4% 0% 0% 0% 6% Note: Solid arrows indicate Wave 17 significantly higher/lower than Wave 16 at 95% confidence level Arrow outlines indicate Wave 17 significantly higher/lower than Wave 16 at 90% confidence level Q 2. Please list which Colorado Lottery games, including any specific Scratch games, you have seen or heard advertised in the past month? 14
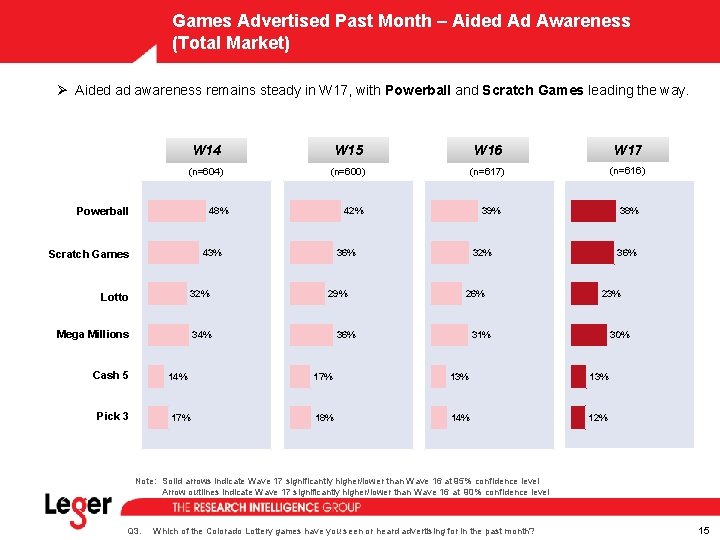
Games Advertised Past Month – Aided Ad Awareness (Total Market) Ø Aided ad awareness remains steady in W 17, with Powerball and Scratch Games leading the way. W 14 W 15 W 16 W 17 (n=604) (n=600) (n=617) (n=616) Powerball 48% 42% 43% Scratch Games Lotto 32% Mega Millions 34% Cash 5 14% Pick 3 17% 39% 36% 29% 38% 32% 26% 36% 23% 31% 30% 17% 13% 18% 14% 12% Note: Solid arrows indicate Wave 17 significantly higher/lower than Wave 16 at 95% confidence level Arrow outlines indicate Wave 17 significantly higher/lower than Wave 16 at 90% confidence level Q 3. Which of the Colorado Lottery games have you seen or heard advertising for in the past month? 15
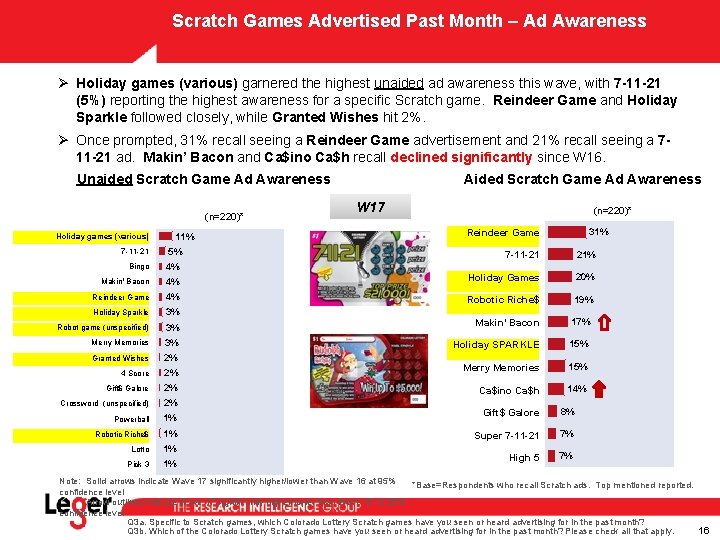
Scratch Games Advertised Past Month – Ad Awareness Ø Holiday games (various) garnered the highest unaided ad awareness this wave, with 7 -11 -21 (5%) reporting the highest awareness for a specific Scratch game. Reindeer Game and Holiday Sparkle followed closely, while Granted Wishes hit 2%. Ø Once prompted, 31% recall seeing a Reindeer Game advertisement and 21% recall seeing a 711 -21 ad. Makin’ Bacon and Ca$ino Ca$h recall declined significantly since W 16. Aided Scratch Game Ad Awareness Unaided Scratch Game Ad Awareness (n=220)* Holiday games (various) 11% 7 -11 -21 5% Bingo 4% Makin' Bacon W 17 (n=220)* Reindeer Game 31% 7 -11 -21 21% 4% Holiday Games 20% Reindeer Game 4% Robotic Riche$ 19% Holiday Sparkle 3% Robot game (unspecified) 3% Makin’ Bacon 17% Merry Memories 3% Holiday SPARKLE 15% Granted Wishes 2% 4 Score 2% Merry Memories 15% Gift$ Galore 2% Ca$ino Ca$h 14% Crossword (unspecified) 2% Powerball 1% Robotic Riche$ 1% Lotto 1% Pick 3 1% Gift$ Galore 8% Super 7 -11 -21 7% High 5 7% Note: Solid arrows indicate Wave 17 significantly higher/lower than Wave 16 at 95% *Base=Respondents who recall Scratch ads. Top mentioned reported. confidence level Arrow outlines indicate Wave 17 significantly higher/lower than Wave 16 at 90% confidence level Q 3 a. Specific to Scratch games, which Colorado Lottery Scratch games have you seen or heard advertising for in the past month? Q 3 b. Which of the Colorado Lottery Scratch games have you seen or heard advertising for in the past month? Please check all that apply. 16
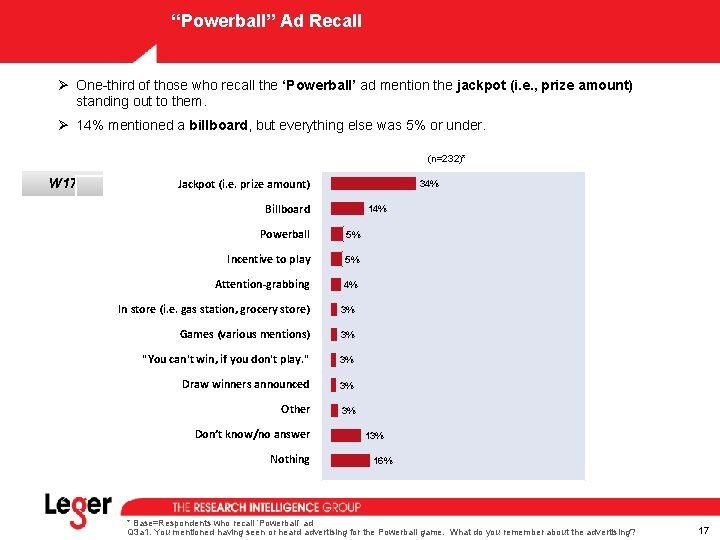
“Powerball” Ad Recall Ø One-third of those who recall the ‘Powerball’ ad mention the jackpot (i. e. , prize amount) standing out to them. Ø 14% mentioned a billboard, but everything else was 5% or under. (n=232)* W 17 Jackpot (i. e. prize amount) 34% Billboard 14% Powerball 5% Incentive to play 5% Attention-grabbing 4% In store (i. e. gas station, grocery store) 3% Games (various mentions) 3% "You can't win, if you don't play. " 3% Draw winners announced 3% Other 3% Don’t know/no answer Nothing 13% 16% * Base=Respondents who recall ‘Powerball’ ad Q 3 a 1. You mentioned having seen or heard advertising for the Powerball game. What do you remember about the advertising? 17
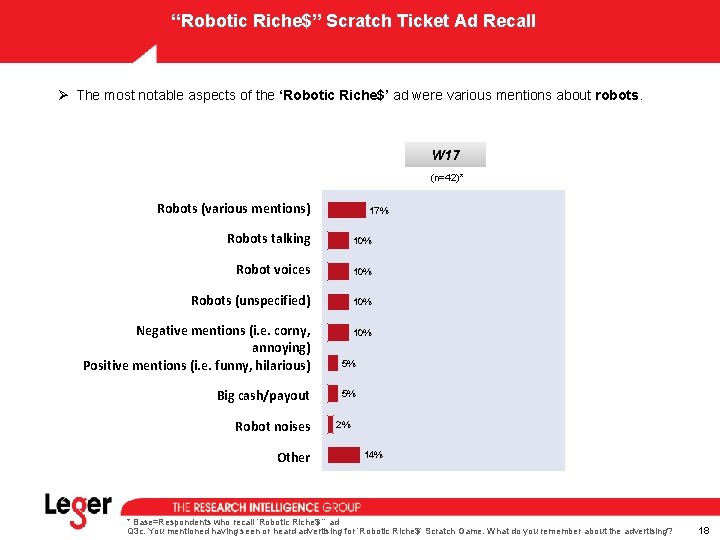
“Robotic Riche$” Scratch Ticket Ad Recall Ø The most notable aspects of the ‘Robotic Riche$’ ad were various mentions about robots. W 17 (n=42)* Robots (various mentions) 17% Robots talking 10% Robot voices 10% Robots (unspecified) 10% Negative mentions (i. e. corny, annoying) Positive mentions (i. e. funny, hilarious) Big cash/payout Robot noises Other 10% 5% 5% 2% 14% * Base=Respondents who recall ‘Robotic Riche$ ’’ ad Q 3 c. You mentioned having seen or heard advertising for ‘Robotic Riche$’ Scratch Game. What do you remember about the advertising? 18
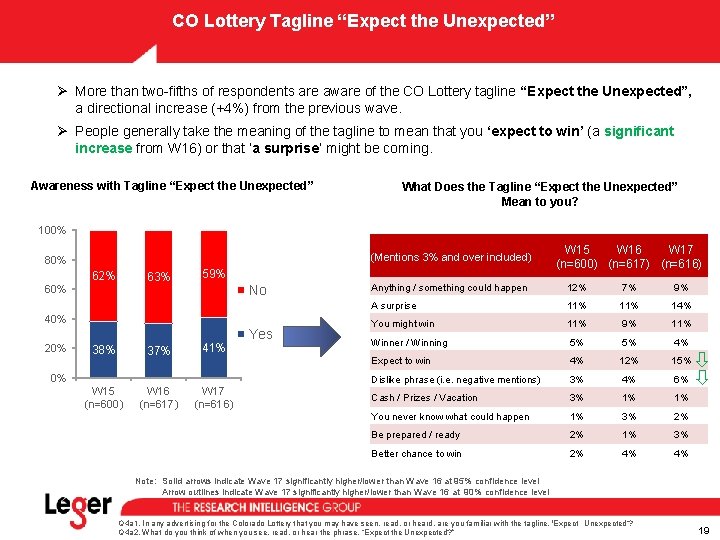
CO Lottery Tagline “Expect the Unexpected” Ø More than two-fifths of respondents are aware of the CO Lottery tagline “Expect the Unexpected”, a directional increase (+4%) from the previous wave. Ø People generally take the meaning of the tagline to mean that you ‘expect to win’ (a significant increase from W 16) or that ‘a surprise’ might be coming. Awareness with Tagline “Expect the Unexpected” What Does the Tagline “Expect the Unexpected” Mean to you? 100% (Mentions 3% and over included) 80% 62% 63% 60% 59% No 40% 20% 38% 37% 41% W 15 (n=600) W 16 (n=617) W 17 (n=616) 0% Yes W 15 W 16 W 17 (n=600) (n=617) (n=616) Anything / something could happen 12% 7% 9% A surprise 11% 14% You might win 11% 9% 11% Winner / Winning 5% 5% 4% Expect to win 4% 12% 15% Dislike phrase (i. e. negative mentions) 3% 4% 6% Cash / Prizes / Vacation 3% 1% 1% You never know what could happen 1% 3% 2% Be prepared / ready 2% 1% 3% Better chance to win 2% 4% 4% Note: Solid arrows indicate Wave 17 significantly higher/lower than Wave 16 at 95% confidence level Arrow outlines indicate Wave 17 significantly higher/lower than Wave 16 at 90% confidence level Q 4 a 1. In any advertising for the Colorado Lottery that you may have seen, read, or heard, are you familiar with the tagline, 'Expect Unexpected‘? Q 4 a 2. What do you think of when you see, read, or hear the phrase, “Expect the Unexpected? ” 19
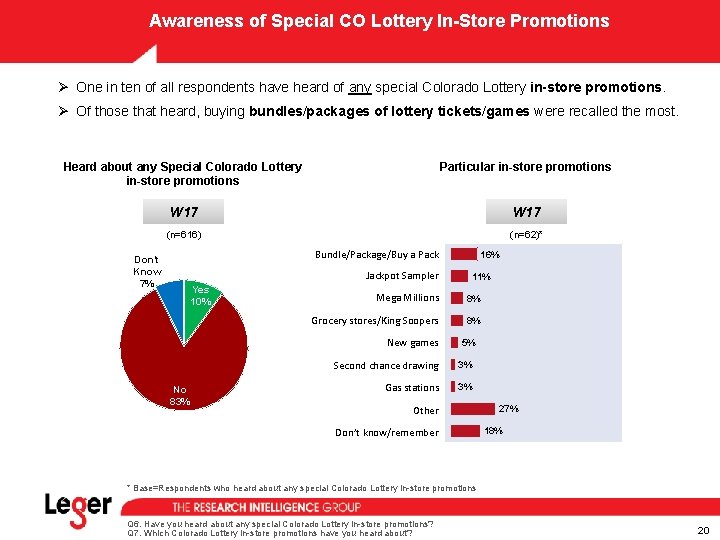
Awareness of Special CO Lottery In-Store Promotions Ø One in ten of all respondents have heard of any special Colorado Lottery in-store promotions. Ø Of those that heard, buying bundles/packages of lottery tickets/games were recalled the most. Heard about any Special Colorado Lottery in-store promotions Particular in-store promotions W 17 (n=616) (n=62)* Bundle/Package/Buy a Pack Don’t Know 7% Jackpot Sampler Yes 10% 11% Mega Millions 8% Grocery stores/King Soopers 8% New games No 83% 16% 5% Second chance drawing 3% Gas stations 3% Other Don’t know/remember 27% 18% * Base=Respondents who heard about any special Colorado Lottery in-store promotions Q 6. Have you heard about any special Colorado Lottery in-store promotions? Q 7. Which Colorado Lottery in-store promotions have you heard about? 20
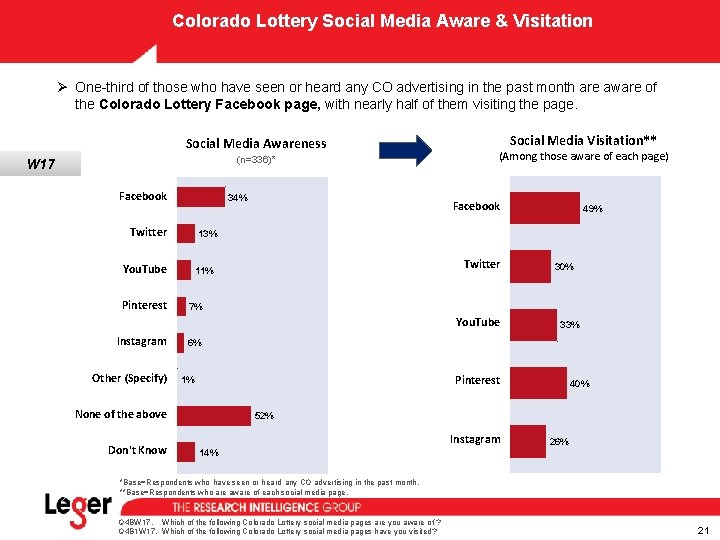
Colorado Lottery Social Media Aware & Visitation Ø One-third of those who have seen or heard any CO advertising in the past month are aware of the Colorado Lottery Facebook page, with nearly half of them visiting the page. Social Media Awareness (n=336)* W 17 Facebook 34% Twitter (Among those aware of each page) Facebook Twitter 11% Other (Specify) 33% 6% Pinterest 1% None of the above Don't Know 30% 7% You. Tube Instagram 49% 13% You. Tube Pinterest Social Media Visitation** 40% 52% Instagram 26% 14% *Base=Respondents who have seen or heard any CO advertising in the past month. **Base=Respondents who are aware of each social media page. Q 4 BW 17. Which of the following Colorado Lottery social media pages are you aware of ? Q 4 B 1 W 17. Which of the following Colorado Lottery social media pages have you visited? 21
Lottery Attitudes and Feelings Toward CO Lottery
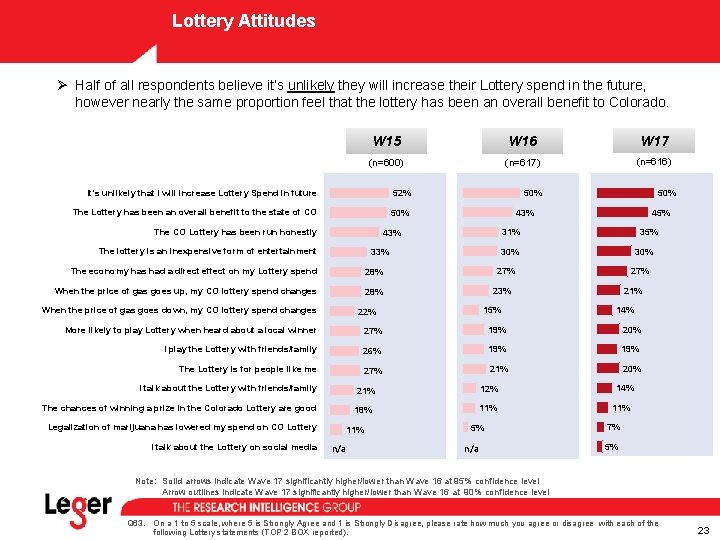
Lottery Attitudes Ø Half of all respondents believe it’s unlikely they will increase their Lottery spend in the future, however nearly the same proportion feel that the lottery has been an overall benefit to Colorado. W 15 W 16 W 17 (n=600) (n=617) (n=616) It’s unlikely that I will increase Lottery Spend in future 52% The Lottery has been an overall benefit to the state of CO 50% The CO Lottery has been run honestly 28% When the price of gas goes up, my CO lottery spend changes 28% When the price of gas goes down, my CO lottery spend changes 35% 31% 30% 33% The economy has had a direct effect on my Lottery spend 45% 43% The lottery is an inexpensive form of entertainment 50% 27% 21% 23% 15% 22% 14% More likely to play Lottery when heard about a local winner 27% 19% 20% I play the Lottery with friends/family 26% 19% The Lottery is for people like me 27% 21% 20% I talk about the Lottery with friends/family The chances of winning a prize in the Colorado Lottery are good Legalization of marijuana has lowered my spend on CO Lottery I talk about the Lottery on social media 12% 21% 18% 11% n/a 11% 5% n/a 14% 11% 7% 5% Note: Solid arrows indicate Wave 17 significantly higher/lower than Wave 16 at 95% confidence level Arrow outlines indicate Wave 17 significantly higher/lower than Wave 16 at 90% confidence level Q 63. On a 1 to 5 scale, where 5 is Strongly Agree and 1 is Strongly Disagree, please rate how much you agree or disagree with each of the following Lottery statements (TOP 2 BOX reported). 23
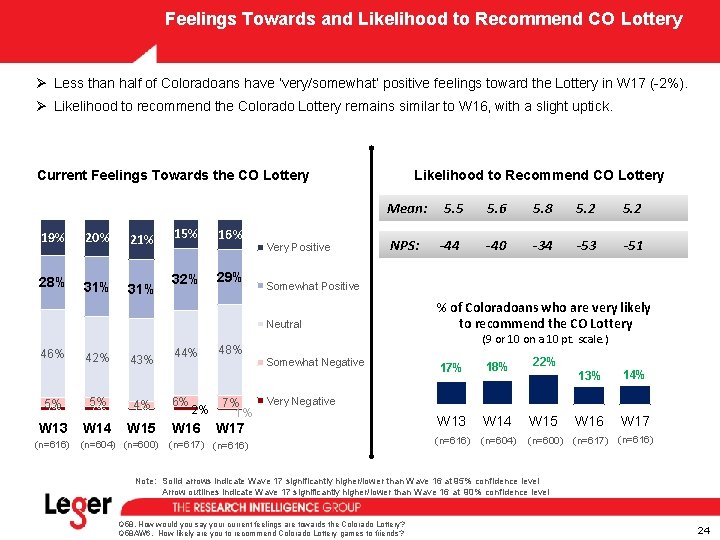
Feelings Towards and Likelihood to Recommend CO Lottery Ø Less than half of Coloradoans have ‘very/somewhat’ positive feelings toward the Lottery in W 17 (-2%). Ø Likelihood to recommend the Colorado Lottery remains similar to W 16, with a slight uptick. Current Feelings Towards the CO Lottery 19% 20% 21% 28% 31% 15% 16% 32% 29% Very Positive Likelihood to Recommend CO Lottery Mean: 5. 5 5. 6 5. 8 5. 2 NPS: -44 -40 -34 -53 -51 Somewhat Positive Neutral 46% 42% 43% 5% 2% 4% 1% W 13 W 14 W 15 (n=616) (n=604) (n=600) 44% 6% 2% W 16 48% 7% 1% % of Coloradoans who are very likely to recommend the CO Lottery (9 or 10 on a 10 pt. scale. ) Somewhat Negative 17% 18% 22% W 13 W 14 (n=616) (n=604) 13% 14% W 15 W 16 W 17 (n=600) (n=617) (n=616) Very Negative W 17 (n=617) (n=616) Note: Solid arrows indicate Wave 17 significantly higher/lower than Wave 16 at 95% confidence level Arrow outlines indicate Wave 17 significantly higher/lower than Wave 16 at 90% confidence level Q 58. How would you say your current feelings are towards the Colorado Lottery? Q 58 AW 6. How likely are you to recommend Colorado Lottery games to friends? 24
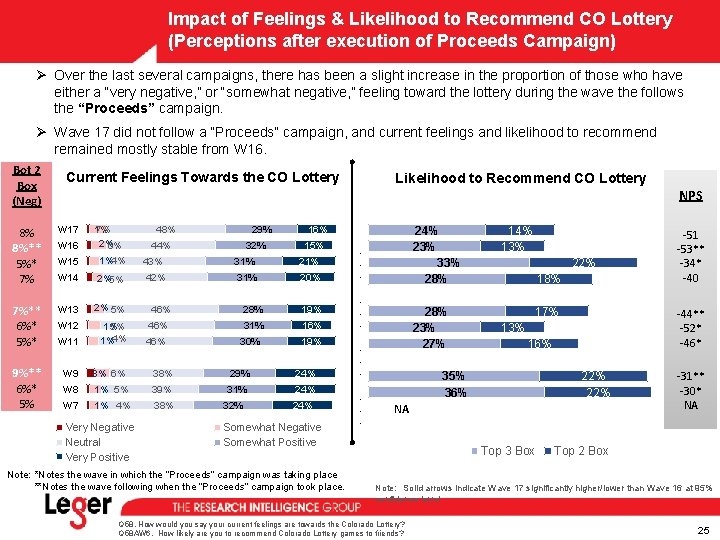
Impact of Feelings & Likelihood to Recommend CO Lottery (Perceptions after execution of Proceeds Campaign) Ø Over the last several campaigns, there has been a slight increase in the proportion of those who have either a “very negative, ” or “somewhat negative, ” feeling toward the lottery during the wave the follows the “Proceeds” campaign. Ø Wave 17 did not follow a “Proceeds” campaign, and current feelings and likelihood to recommend remained mostly stable from W 16. Bot 2 Box (Neg) Current Feelings Towards the CO Lottery Likelihood to Recommend CO Lottery NPS 8% 8%** 5%* 7% W 17 W 16 7% 1% 2% 6% 48% 29% 44% 32% 16% 15% W 15 1%4% W 14 2%5% 7%** 6%* 5%* W 13 2% 5% W 12 W 11 5% 1% 1%4% 9%** 6%* 5% W 9 3% 6% 38% 29% 24% W 8 1% 5% 39% 31% 24% W 7 1% 4% 38% Very Negative Neutral Very Positive 43% 42% 46% 31% 21% 31% 20% 28% 19% 31% 16% 46% 30% 32% 19% 24% Somewhat Negative Somewhat Positive Note: *Notes the wave in which the “Proceeds” campaign was taking place **Notes the wave following when the “Proceeds” campaign took place. 24% 23% 33% 28% . . . 28% 23% 27% . . . 14% 13% 22% 18% 17% -44** -52* -46* 13% 16% 35% 36% 22% NA Top 3 Box -51 -53** -34* -40 -31** -30* NA Top 2 Box Note: Solid arrows indicate Wave 17 significantly higher/lower than Wave 16 at 95% confidence level Q 58. How would you say your current feelings are towards the Colorado Lottery? Q 58 AW 6. How likely are you to recommend Colorado Lottery games to friends? 25
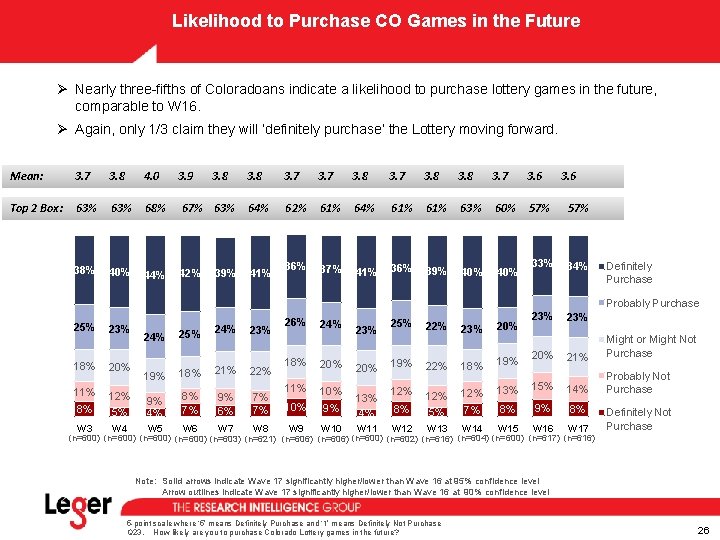
Likelihood to Purchase CO Games in the Future Ø Nearly three-fifths of Coloradoans indicate a likelihood to purchase lottery games in the future, comparable to W 16. Ø Again, only 1/3 claim they will ‘definitely purchase’ the Lottery moving forward. Mean: 3. 7 3. 8 4. 0 3. 9 Top 2 Box: 63% 68% 38% 40% 44% 42% 3. 8 3. 7 3. 6 67% 63% 64% 62% 61% 64% 61% 63% 60% 57% 39% 41% 36% 37% 41% 36% 39% 40% 33% 34% Definitely Purchase Probably Purchase 25% 18% 23% 20% 24% 25% 24% 21% 23% 22% 19% 18% 8% 12% 5% 9% 4% 8% 7% 9% 6% 7% 7% W 3 W 4 W 5 W 6 W 7 W 8 11% 26% 18% 24% 20% 23% 20% 11% 10% 9% 13% 4% W 9 W 10 W 11 25% 19% 22% 23% 20% 18% 19% 23% 20% 23% 21% Might or Might Not Purchase 14% Probably Not Purchase 12% 13% 8% 12% 5% 15% 7% 8% 9% 8% W 12 W 13 W 14 W 15 W 16 W 17 12% Definitely Not Purchase (n=600) (n=603) (n=621) (n=606) (n=600) (n=602) (n=616) (n=604) (n=600) (n=617) (n=616) Note: Solid arrows indicate Wave 17 significantly higher/lower than Wave 16 at 95% confidence level Arrow outlines indicate Wave 17 significantly higher/lower than Wave 16 at 90% confidence level 5 -point scale where ‘ 5’ means Definitely Purchase and ‘ 1’ means Definitely Not Purchase Q 23. How likely are you to purchase Colorado Lottery games in the future? 26
Purchase & Buying Behavior
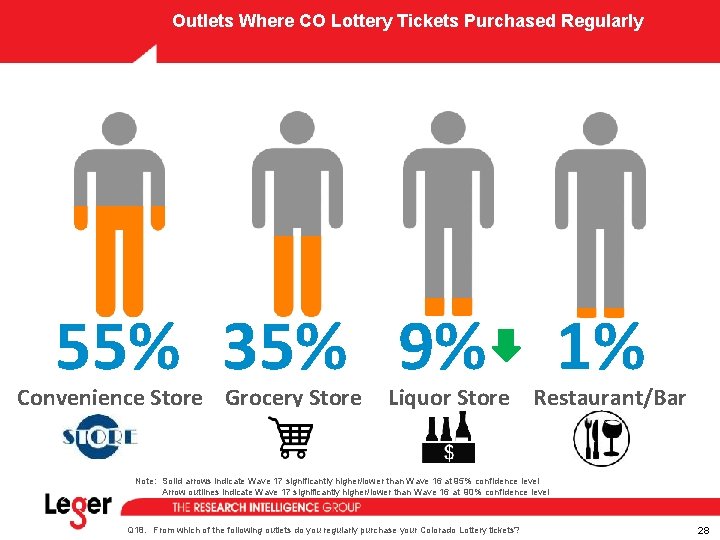
Outlets Where CO Lottery Tickets Purchased Regularly 55% 35% 9% 1% Convenience Store Grocery Store Liquor Store Restaurant/Bar Note: Solid arrows indicate Wave 17 significantly higher/lower than Wave 16 at 95% confidence level Arrow outlines indicate Wave 17 significantly higher/lower than Wave 16 at 90% confidence level Q 18. From which of the following outlets do you regularly purchase your Colorado Lottery tickets? 28
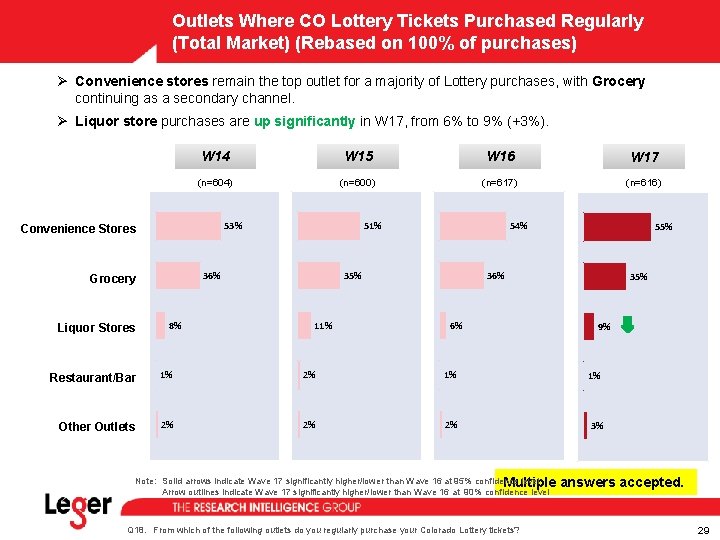
Outlets Where CO Lottery Tickets Purchased Regularly (Total Market) (Rebased on 100% of purchases) Ø Convenience stores remain the top outlet for a majority of Lottery purchases, with Grocery continuing as a secondary channel. Ø Liquor store purchases are up significantly in W 17, from 6% to 9% (+3%). W 14 W 15 W 16 W 17 (n=604) (n=600) (n=617) (n=616) 53% Convenience Stores 36% Grocery Liquor Stores 51% 8% 54% 35% 11% 55% 36% 6% 35% 9% Restaurant/Bar 1% 2% 1% 1% Other Outlets 2% 2% 2% 3% Note: Solid arrows indicate Wave 17 significantly higher/lower than Wave 16 at 95% confidence level Multiple Arrow outlines indicate Wave 17 significantly higher/lower than Wave 16 at 90% confidence level Q 18. From which of the following outlets do you regularly purchase your Colorado Lottery tickets? answers accepted. 29
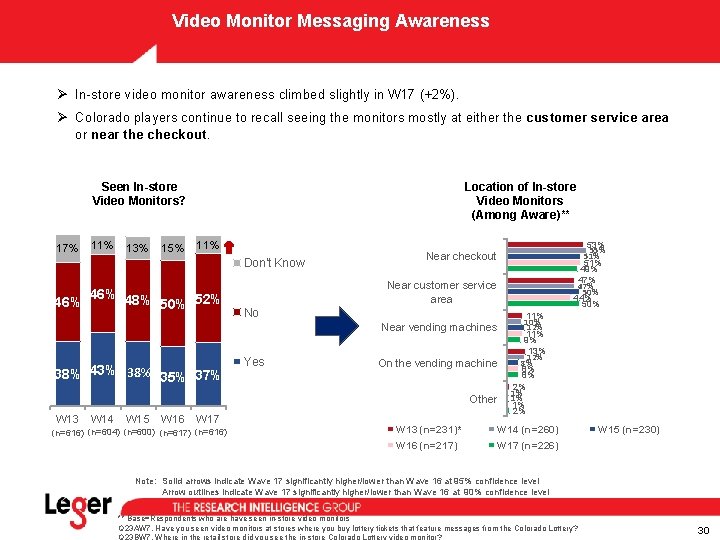
Video Monitor Messaging Awareness Ø In-store video monitor awareness climbed slightly in W 17 (+2%). Ø Colorado players continue to recall seeing the monitors mostly at either the customer service area or near the checkout. Seen In-store Video Monitors? 17% 11% 13% 15% Location of In-store Video Monitors (Among Aware)** 11% Don't Know 46% 48% 46% 50% 52% Near checkout Near customer service area No Near vending machines 38% 43% 38% 35% 37% Yes On the vending machine Other W 13 W 14 W 15 W 16 W 17 (n=616) (n=604) (n=600) (n=617) (n=616) 53% 55% 51% 49% 47% 50% 44% 50% 11% 10% 12% 11% 9% 13% 12% 8% 8% 8% 2% 1% 1% 1% 2% W 13 (n=231)* W 14 (n=260) W 16 (n=217) W 17 (n=226) W 15 (n=230) Note: Solid arrows indicate Wave 17 significantly higher/lower than Wave 16 at 95% confidence level Arrow outlines indicate Wave 17 significantly higher/lower than Wave 16 at 90% confidence level ** Base=Respondents who are have seen in-store video monitors Q 23 AW 7. Have you seen video monitors at stores where you buy lottery tickets that feature messages from the Colorado Lottery? 30
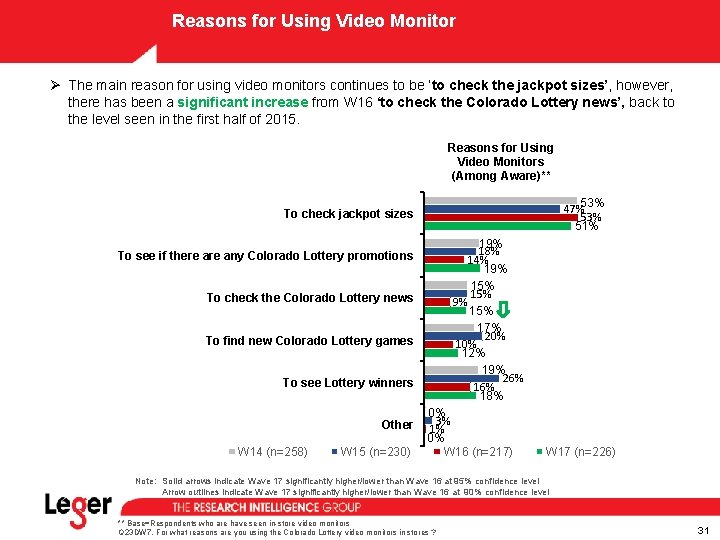
Reasons for Using Video Monitor Ø The main reason for using video monitors continues to be ‘to check the jackpot sizes’, however, there has been a significant increase from W 16 ‘to check the Colorado Lottery news’, back to the level seen in the first half of 2015. Reasons for Using Video Monitors (Among Aware)** 53% 47% 53% 51% To check jackpot sizes 19% 18% 14% 19% 15% 17% 20% 12% 19% 26% 18% To see if there any Colorado Lottery promotions To check the Colorado Lottery news To find new Colorado Lottery games To see Lottery winners Other W 14 (n=258) W 15 (n=230) 0% 3% 1% 0% W 16 (n=217) W 17 (n=226) Note: Solid arrows indicate Wave 17 significantly higher/lower than Wave 16 at 95% confidence level Arrow outlines indicate Wave 17 significantly higher/lower than Wave 16 at 90% confidence level ** Base=Respondents who are have seen in-store video monitors Q 23 DW 7. For what reasons are you using the Colorado Lottery video monitors in stores ? 31
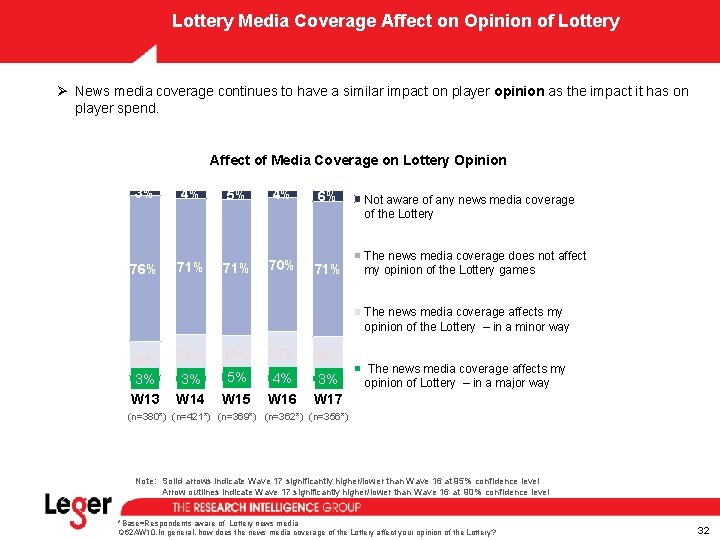
Lottery Media Coverage Affect on Opinion of Lottery Ø News media coverage continues to have a similar impact on player opinion as the impact it has on player spend. Affect of Media Coverage on Lottery Opinion 3% 4% 76% 71% 5% 4% 71% 70% 6% 71% Not aware of any news media coverage of the Lottery The news media coverage does not affect my opinion of the Lottery games The news media coverage affects my opinion of the Lottery – in a minor way 18% 3% W 13 21% 19% 22% 20% 3% W 14 5% 4% W 16 3% W 17 W 15 The news media coverage affects my opinion of Lottery – in a major way (n=380*) (n=421*) (n=369*) (n=362*) (n=356*) Note: Solid arrows indicate Wave 17 significantly higher/lower than Wave 16 at 95% confidence level Arrow outlines indicate Wave 17 significantly higher/lower than Wave 16 at 90% confidence level *Base=Respondents aware of Lottery news media Q 62 AW 10. In general, how does the news media coverage of the Lottery affect your opinion of the Lottery? 32
Jackpot Games: Sensitivity to Jackpot Amounts, General Playership
CO Lottery Games – Playership (Total Market) Ø Three in four Coloradoans continue to indicate they have ‘ever played’ the CO Lottery, stable since W 14. Ø Lotto (-5%) saw a significant decrease in ‘ever played’ this wave. Ever Played CO Lottery Games W 14 DK 1% (n=604) W 15 DK 1% (n=600) W 16 DK 1% (n=617) W 17 (n=616) DK 1% No 25% Yes 74% No Yes 24% 75% No 25% Yes 74% Games Ever Played Scratch Games Powerball Lotto Mega Millions Cash 5 Raffle Pick 3 None 49% 60% 40% 36% 14% 3% 12% 26% 3% 15% 47% 58% 40% 38% 15% 26% 46% 56% 39% 36% 11% 2% 9% 25% 34% 35% 50% 55% 13% 0% 11% 26% Note: Solid arrows indicate Wave 17 significantly higher/lower than Wave 16 at 95% confidence level Arrow outlines indicate Wave 17 significantly higher/lower than Wave 16 at 90% confidence level Q 13. Have you ever played any of [these] Colorado Lottery games? Q 14. Which Colorado Lottery games have you ever played? 34
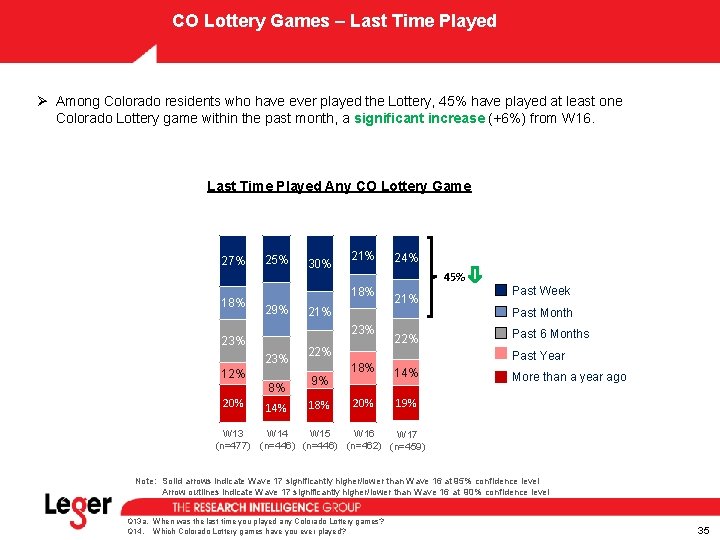
CO Lottery Games – Last Time Played Ø Among Colorado residents who have ever played the Lottery, 45% have played at least one Colorado Lottery game within the past month, a significant increase (+6%) from W 16. Last Time Played Any CO Lottery Game 27% 18% 25% 21% 29% 21% 23% 12% 8% 14% 22% 9% 18% 24% 45% 18% 23% 20% 30% 21% 22% Past Week Past Month Past 6 Months Past Year 18% 14% 20% 19% More than a year ago W 13 W 14 W 15 W 16 W 17 (n=477) (n=446) (n=462) (n=459) Note: Solid arrows indicate Wave 17 significantly higher/lower than Wave 16 at 95% confidence level Arrow outlines indicate Wave 17 significantly higher/lower than Wave 16 at 90% confidence level Q 13 a. When was the last time you played any Colorado Lottery games? Q 14. Which Colorado Lottery games have you ever played? 35
Powerball Playership Wave to Wave Ø Powerball past month playership has directionally declined the past three quarters (-1% in W 17). Powerball Playership Past Month: 28% 27% 27% 44% 39% 28% 24% 19% 16% 17% 16% 21% 19% 14% 14% 10% 9% 11% 12% 10% 11% 20% 15% 18% 16% 23% 23% 21% 24% 9% 9% 14% 20% 9% 11% 16% 11% 9% 8% 7% 49% 46% 41% 39% 41% 34% 42% 41% 26% 22% 21% 31% 23% 20% 19% 12% 11% 10% 14% 13% 10% 11% 10% 8% 14% 12% 17% 22% 24% 21% 25% 30% 20% 12% 34% 36% 14% 9% 14% 11% 14% Past Week Past Month Past Year Lapsed 41% 40% 42% 44% 45% Never Played W 15 W 16 W 17 W 12 W 13 W 14 W 2 W 3 W 4 W 5 W 6 W 7 W 8 W 9 W 10 W 11 (n=601) (n=604) (n=600) (n=603) (n=621) (n=606) (n=600) (n=602) (n=616) (n=604) (n=600) (n=617) (n=616) Note: Solid arrows indicate Wave 17 significantly higher/lower than Wave 16 at 95% confidence level Arrow outlines indicate Wave 17 significantly higher/lower than Wave 16 at 90% confidence level Q 13. Have you ever played any of these Colorado Lottery games? Q 14. Which Colorado Lottery games have you ever played? Q 15. IN THE PAST YEAR, which of these Colorado Lottery games have you played? Q 16. AND IN THE PAST MONTH, which of these Colorado Lottery games have you played? Q 17. AND IN THE PAST WEEK, which of these Colorado Lottery games have you played? 36
Jackpot Triggers – Media Ø ‘Coloradolottery. com’ (21%) is now the top source for finding out about jackpots. Facebook (7%) and Twitter (2%) reported significant increases, while digital signs at retail (18%) dropped significantly. Ø TV News (9%), Outdoor ads (7%) and Newspaper (editorial, 4%) saw significant increases from last wave for other preferred sources to find out about jackpots. WHERE DO YOU FIND OUT ABOUT JACKPOTS Coloradolottery. com TV News Outdoor Ad TV Ad Newspaper (editorial) E-mails from CO Lottery Radio Ad Internet Ad Newspaper Ad Facebook Text message Mobile Apps Twitter Digital signs at retail Video monitors at stores Mobile Alerts (Push Notification) Other No specific place Don't know WHERE ELSE WOULD YOU LIKE TO FIND OUT ABOUT JACKPOTS W 16 W 17 (n=383*) (n=380*) (n=314*) (n=295*) 19% 18% 21% 18% 5% 5% 14% 5% 4% 2% 1% 3% 1% 23% 1% 0% 16% 2% 21% 17% 15% 4% 3% 10% 5% 5% 7% 1% 2% 2% 18% 14% 1% 0% 18% 5% 12% 5% 4% 8% 2% 7% 6% 8% 5% 7% 2% 8% 6% 3% 0% 11% 9% 7% 8% 4% 11% 6% 6% 7% 10% 5% 6% 2% 8% 8% 4% 1% 35% 15% 35% 10% Note: Solid arrows indicate Wave 17 significantly higher/lower than Wave 16 at 95% confidence level Arrow outlines indicate Wave 17 significantly higher/lower than Wave 16 at 90% confidence level * Base=Respondents who have played any games in the past year Q 64. Where do you find out about Powerball, Mega Millions or Lotto jackpots? Q 65. Where else would you like to be able to find out about jackpots? 37
Multi-State Games &
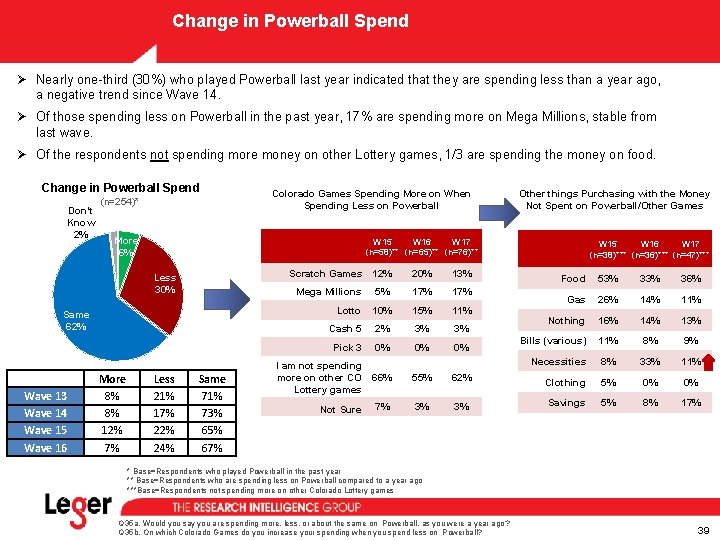
Change in Powerball Spend Ø Nearly one-third (30%) who played Powerball last year indicated that they are spending less than a year ago, a negative trend since Wave 14. Ø Of those spending less on Powerball in the past year, 17% are spending more on Mega Millions, stable from last wave. Ø Of the respondents not spending more money on other Lottery games, 1/3 are spending the money on food. Change in Powerball Spend Don't Know 2% (n=254)* More 6% Less 30% Same 62% Wave 13 Wave 14 Wave 15 Wave 16 More 8% 8% 12% 7% Colorado Games Spending More on When Spending Less on Powerball Less 21% 17% 22% 24% Same 71% 73% 65% 67% W 15 W 16 W 17 (n=58)** (n=65)** (n=76)** Scratch Games 12% 20% 13% Mega Millions 5% 17% Lotto 10% 15% 11% Cash 5 2% 3% 3% Pick 3 0% 0% 0% Other things Purchasing with the Money Not Spent on Powerball/Other Games W 15 W 16 W 17 (n=38)*** (n=36)*** (n=47)*** Food 53% 36% Gas 26% 14% 11% Nothing 16% 14% 13% Bills (various) 11% 8% 9% Necessities 8% 33% 11% I am not spending more on other CO Lottery games 66% 55% 62% Clothing 5% 0% 0% Not Sure 7% 3% 3% Savings 5% 8% 17% * Base=Respondents who played Powerball in the past year ** Base=Respondents who are spending less on Powerball compared to a year ago ***Base=Respondents not spending more on other Colorado Lottery games Q 35 a. Would you say you are spending more, less, or about the same on Powerball, as you were a year ago? Q 35 b. On which Colorado Games do you increase your spending when you spend less on Powerball? 39
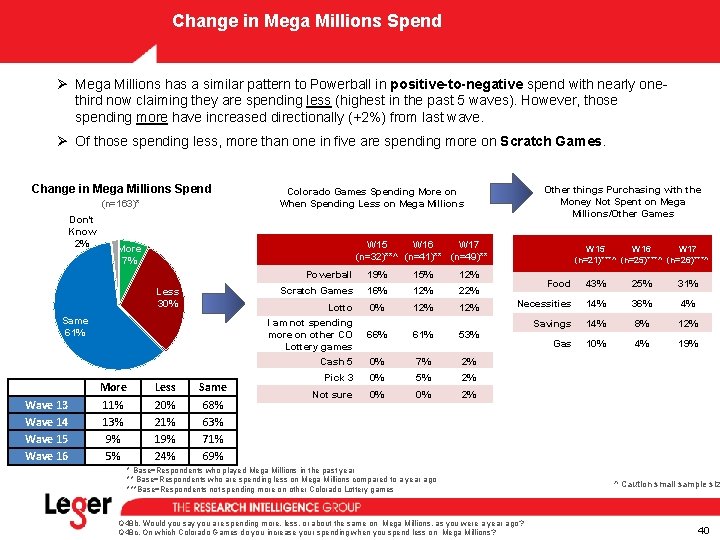
Change in Mega Millions Spend Ø Mega Millions has a similar pattern to Powerball in positive-to-negative spend with nearly onethird now claiming they are spending less (highest in the past 5 waves). However, those spending more have increased directionally (+2%) from last wave. Ø Of those spending less, more than one in five are spending more on Scratch Games. Change in Mega Millions Spend (n=163)* Don't Know 2% More 7% Same 61% Wave 13 Wave 14 Wave 15 Wave 16 W 15 W 16 W 17 Powerball 19% 15% 12% Scratch Games 16% 12% 22% Lotto I am not spending more on other CO Lottery games Cash 5 0% 12% 66% 61% 53% 0% 7% 2% Pick 3 0% 5% 2% Not sure 0% 0% 2% W 15 (n=32)**^ (n=41)** (n=49)** Less 30% More 11% 13% 9% 5% Other things Purchasing with the Money Not Spent on Mega Millions/Other Games Colorado Games Spending More on When Spending Less on Mega Millions Less 20% 21% 19% 24% Same 68% 63% 71% 69% (n=21)***^ W 16 W 17 (n=25)***^ (n=26)***^ Food 43% 25% 31% Necessities 14% 36% 4% Savings 14% 8% 12% Gas 10% 4% 19% * Base=Respondents who played Mega Millions in the past year ** Base=Respondents who are spending less on Mega Millions compared to a year ago ***Base=Respondents not spending more on other Colorado Lottery games Q 48 b. Would you say you are spending more, less, or about the same on Mega Millions, as you were a year ago? Q 48 c. On which Colorado Games do you increase your spending when you spend less on Mega Millions? ^ Caution small sample siz 40
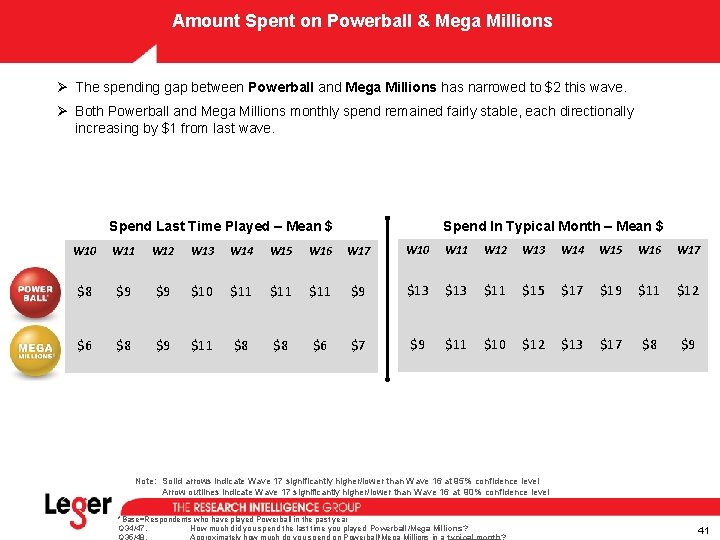
Amount Spent on Powerball & Mega Millions Ø The spending gap between Powerball and Mega Millions has narrowed to $2 this wave. Ø Both Powerball and Mega Millions monthly spend remained fairly stable, each directionally increasing by $1 from last wave. Spend Last Time Played – Mean $ Spend In Typical Month – Mean $ W 10 W 11 W 12 W 13 W 14 W 15 W 16 W 17 $8 $9 $9 $10 $11 $11 $9 $13 $11 $15 $17 $19 $11 $12 $6 $8 $9 $11 $8 $8 $6 $7 $9 $11 $10 $12 $13 $17 $8 $9 Note: Solid arrows indicate Wave 17 significantly higher/lower than Wave 16 at 95% confidence level Arrow outlines indicate Wave 17 significantly higher/lower than Wave 16 at 90% confidence level *Base=Respondents who have played Powerball in the past year Q 34/47. How much did you spend the last time you played Powerball/Mega Millions? Q 35/48. Approximately how much do you spend on Powerball/Mega Millions in a typical month? 41
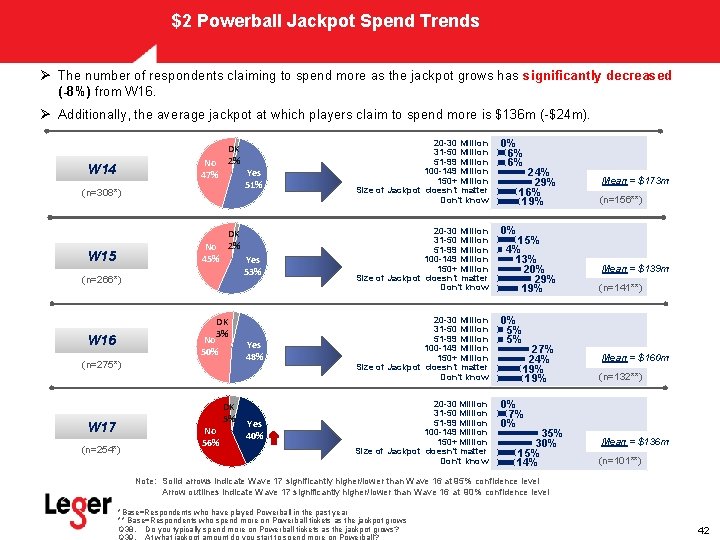
$2 Powerball Jackpot Spend Trends Ø The number of respondents claiming to spend more as the jackpot grows has significantly decreased (-8%) from W 16. Ø Additionally, the average jackpot at which players claim to spend more is $136 m (-$24 m). No 47% W 14 DK 2% Yes 51% (n=308*) No 45% W 15 DK 2% Yes 53% (n=266*) DK 3% W 16 No 50% (n=275*) DK 5% W 17 (n=254*) No 56% Yes 48% Yes 40% 20 -30 Million 31 -50 Million 51 -99 Million 100 -149 Million 150+ Million Size of Jackpot doesn’t matter Don't know 0% 6% 6% 20 -30 Million 31 -50 Million 51 -99 Million 100 -149 Million 150+ Million Size of Jackpot doesn’t matter Don't know 0% 5% 5% 20 -30 Million 31 -50 Million 51 -99 Million 100 -149 Million 150+ Million Size of Jackpot doesn’t matter Don't know 0% 7% 0% 24% 29% 16% 19% 15% 4% 13% 20% 29% 19% 27% 24% 19% 35% 30% 15% 14% Mean = $173 m (n=156**) Mean = $139 m (n=141**) Mean = $160 m (n=132**) Mean = $136 m (n=101**) Note: Solid arrows indicate Wave 17 significantly higher/lower than Wave 16 at 95% confidence level Arrow outlines indicate Wave 17 significantly higher/lower than Wave 16 at 90% confidence level *Base=Respondents who have played Powerball in the past year ** Base=Respondents who spend more on Powerball tickets as the jackpot grows Q 38. Do you typically spend more on Powerball tickets as the jackpot grows? Q 39. At what jackpot amount do you start to spend more on Powerball? 42
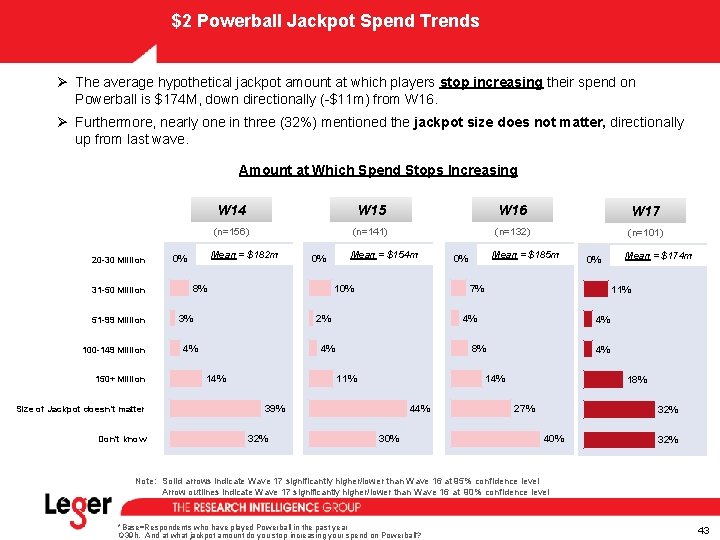
$2 Powerball Jackpot Spend Trends Ø The average hypothetical jackpot amount at which players stop increasing their spend on Powerball is $174 M, down directionally (-$11 m) from W 16. Ø Furthermore, nearly one in three (32%) mentioned the jackpot size does not matter, directionally up from last wave. Amount at Which Spend Stops Increasing 20 -30 Million 31 -50 Million 51 -99 Million 100 -149 Million 150+ Million Size of Jackpot doesn’t matter Don't know W 14 W 15 W 16 W 17 (n=156) (n=141) (n=132) (n=101) Mean = $182 m 0% Mean = $154 m 0% 8% 10% 3% 4% 14% 39% 32% 4% 8% 11% 44% 30% Mean = $174 m 11% 4% 4% 14% 0% 7% 2% 4% Mean = $185 m 0% 18% 27% 32% 40% 32% Note: Solid arrows indicate Wave 17 significantly higher/lower than Wave 16 at 95% confidence level Arrow outlines indicate Wave 17 significantly higher/lower than Wave 16 at 90% confidence level *Base=Respondents who have played Powerball in the past year Q 39 h. And at what jackpot amount do you stop increasing your spend on Powerball? 43
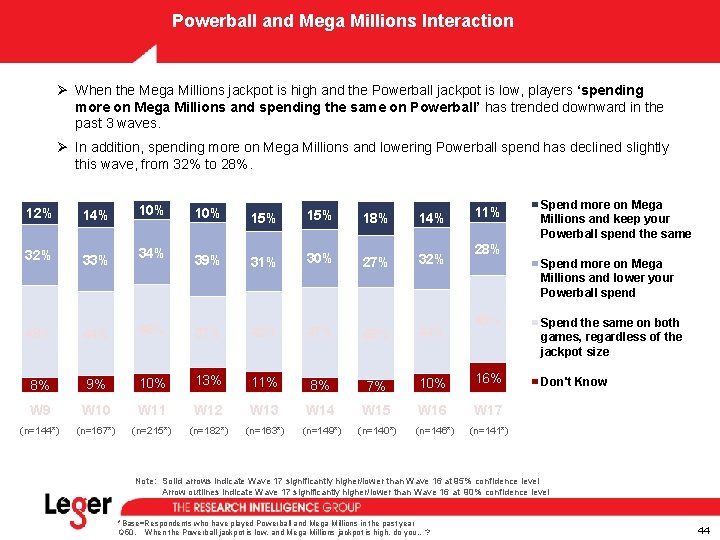
Powerball and Mega Millions Interaction Ø When the Mega Millions jackpot is high and the Powerball jackpot is low, players ‘spending more on Mega Millions and spending the same on Powerball’ has trended downward in the past 3 waves. Ø In addition, spending more on Mega Millions and lowering Powerball spend has declined slightly this wave, from 32% to 28%. 12% 14% 32% 33% 48% 44% 8% 10% 15% 18% 14% 39% 31% 30% 27% 32% 46% 37% 42% 47% 48% 44% 9% 10% 13% 11% 8% 7% W 9 W 10 W 11 W 12 W 13 W 14 (n=144*) (n=167*) (n=215*) (n=182*) (n=163*) (n=149*) 34% 11% 28% Spend more on Mega Millions and keep your Powerball spend the same Spend more on Mega Millions and lower your Powerball spend 45% Spend the same on both games, regardless of the jackpot size 10% 16% Don't Know W 15 W 16 W 17 (n=140*) (n=146*) (n=141*) Note: Solid arrows indicate Wave 17 significantly higher/lower than Wave 16 at 95% confidence level Arrow outlines indicate Wave 17 significantly higher/lower than Wave 16 at 90% confidence level *Base=Respondents who have played Powerball and Mega Millions in the past year Q 50. When the Powerball jackpot is low, and Mega Millions jackpot is high, do you…? 44
LOTTO, Cash 5, Pick 3
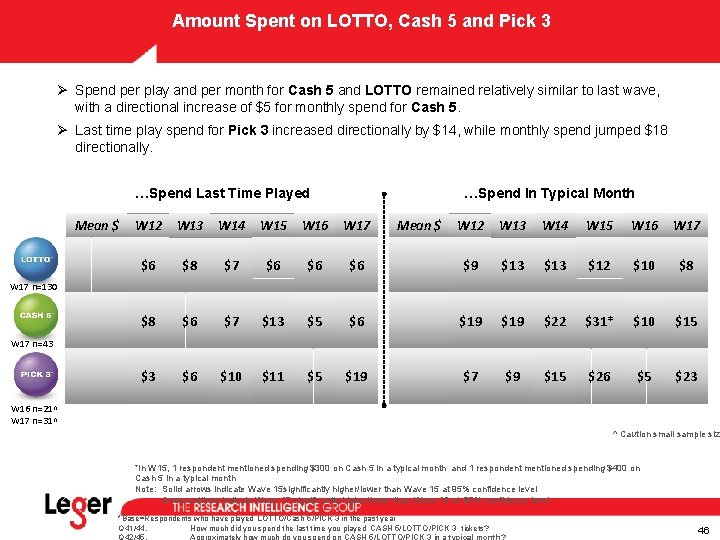
Amount Spent on LOTTO, Cash 5 and Pick 3 Ø Spend per play and per month for Cash 5 and LOTTO remained relatively similar to last wave, with a directional increase of $5 for monthly spend for Cash 5. Ø Last time play spend for Pick 3 increased directionally by $14, while monthly spend jumped $18 directionally. …Spend Last Time Played Mean $ …Spend In Typical Month W 12 W 13 W 14 W 15 W 16 W 17 $6 $8 $7 $6 $6 $8 $6 $7 $13 $3 $6 $10 $11 Mean $ W 12 W 13 W 14 W 15 W 16 W 17 $6 $9 $13 $12 $10 $8 $5 $6 $19 $22 $31* $10 $15 $5 $19 $7 $9 $15 $26 $5 $23 W 17 n=130 W 17 n=43 W 16 n=21^ W 17 n=31^ ^ Caution small sample size *In W 15, 1 respondent mentioned spending $300 on Cash 5 in a typical month and 1 respondent mentioned spending $400 on Cash 5 in a typical month Note: Solid arrows indicate Wave 15 significantly higher/lower than Wave 15 at 95% confidence level Arrow outlines indicate Wave 17 significantly higher/lower than Wave 16 at 90% confidence level *Base=Respondents who have played LOTTO/Cash 5/PICK 3 in the past year Q 41/44. How much did you spend the last time you played CASH 5/LOTTO/PICK 3 tickets? 46
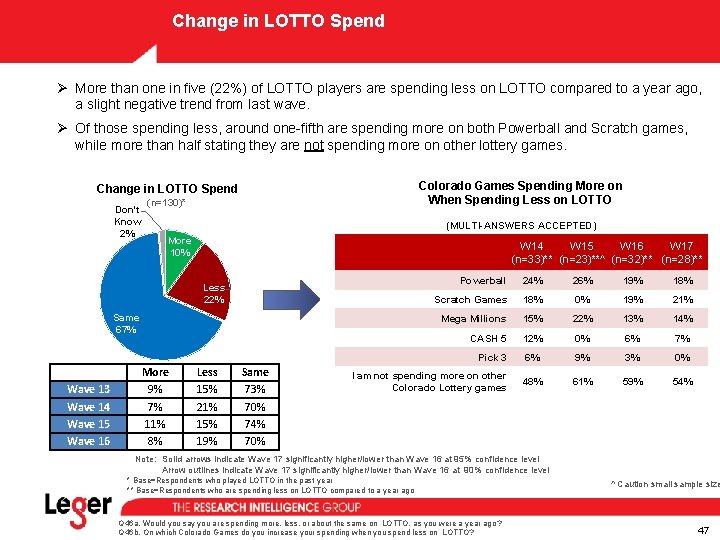
Change in LOTTO Spend Ø More than one in five (22%) of LOTTO players are spending less on LOTTO compared to a year ago, a slight negative trend from last wave. Ø Of those spending less, around one-fifth are spending more on both Powerball and Scratch games, while more than half stating they are not spending more on other lottery games. Colorado Games Spending More on When Spending Less on LOTTO Change in LOTTO Spend Don't Know 2% (n=130)* (MULTI-ANSWERS ACCEPTED) More 10% Powerball 24% 26% 19% 18% Scratch Games 18% 0% 19% 21% Mega Millions 15% 22% 13% 14% CASH 5 12% 0% 6% 7% Pick 3 6% 9% 3% 0% I am not spending more on other Colorado Lottery games 48% 61% 59% 54% Less 22% Same 67% Wave 13 Wave 14 Wave 15 Wave 16 More 9% 7% 11% 8% Less 15% 21% 15% 19% Same 73% 70% 74% 70% W 14 W 15 W 16 W 17 (n=33)** (n=23)**^ (n=32)** (n=28)** Note: Solid arrows indicate Wave 17 significantly higher/lower than Wave 16 at 95% confidence level Arrow outlines indicate Wave 17 significantly higher/lower than Wave 16 at 90% confidence level * Base=Respondents who played LOTTO in the past year ** Base=Respondents who are spending less on LOTTO compared to a year ago Q 46 a. Would you say you are spending more, less, or about the same on LOTTO, as you were a year ago? Q 46 b. On which Colorado Games do you increase your spending when you spend less on LOTTO? ^ Caution small sample size 47
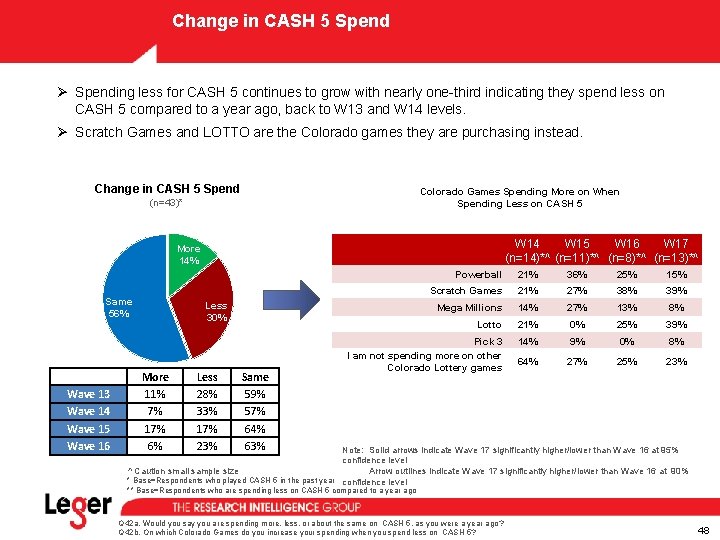
Change in CASH 5 Spend Ø Spending less for CASH 5 continues to grow with nearly one-third indicating they spend less on CASH 5 compared to a year ago, back to W 13 and W 14 levels. Ø Scratch Games and LOTTO are the Colorado games they are purchasing instead. Change in CASH 5 Spend Colorado Games Spending More on When Spending Less on CASH 5 (n=43)* More 14% Same 56% Wave 13 Wave 14 Wave 15 Wave 16 Powerball 21% 36% 25% 15% Scratch Games 21% 27% 38% 39% Mega Millions 14% 27% 13% 8% Lotto 21% 0% 25% 39% Pick 3 I am not spending more on other Colorado Lottery games 14% 9% 0% 8% 64% 27% 25% 23% Less 30% More 11% 7% 17% 6% Less 28% 33% 17% 23% Same 59% 57% 64% 63% W 14 W 15 W 16 W 17 (n=14)*^ (n=11)*^ (n=8)*^ (n=13)*^ Note: Solid arrows indicate Wave 17 significantly higher/lower than Wave 16 at 95% confidence level Arrow outlines indicate Wave 17 significantly higher/lower than Wave 16 at 90% ^ Caution small sample size * Base=Respondents who played CASH 5 in the past year confidence level ** Base=Respondents who are spending less on CASH 5 compared to a year ago Q 42 a. Would you say you are spending more, less, or about the same on CASH 5, as you were a year ago? Q 42 b. On which Colorado Games do you increase your spending when you spend less on CASH 5? 48
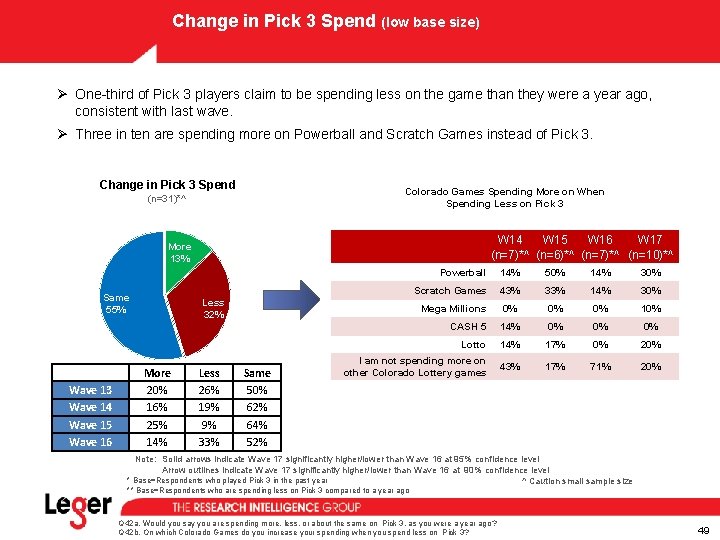
Change in Pick 3 Spend (low base size) Ø One-third of Pick 3 players claim to be spending less on the game than they were a year ago, consistent with last wave. Ø Three in ten are spending more on Powerball and Scratch Games instead of Pick 3. Change in Pick 3 Spend Colorado Games Spending More on When Spending Less on Pick 3 (n=31)*^ More 13% Same 55% Wave 13 Wave 14 Wave 15 Wave 16 Powerball 14% 50% 14% 30% Scratch Games 43% 33% 14% 30% Mega Millions 0% 0% 0% 10% CASH 5 14% 0% 0% 0% Lotto 14% 17% 0% 20% I am not spending more on other Colorado Lottery games 43% 17% 71% 20% Less 32% More 20% 16% 25% 14% Less 26% 19% 9% 33% Same 50% 62% 64% 52% W 14 W 15 W 16 W 17 (n=7)*^ (n=6)*^ (n=7)*^ (n=10)*^ Note: Solid arrows indicate Wave 17 significantly higher/lower than Wave 16 at 95% confidence level Arrow outlines indicate Wave 17 significantly higher/lower than Wave 16 at 90% confidence level * Base=Respondents who played Pick 3 in the past year ^ Caution small sample size ** Base=Respondents who are spending less on Pick 3 compared to a year ago Q 42 a. Would you say you are spending more, less, or about the same on Pick 3, as you were a year ago? Q 42 b. On which Colorado Games do you increase your spending when you spend less on Pick 3? 49
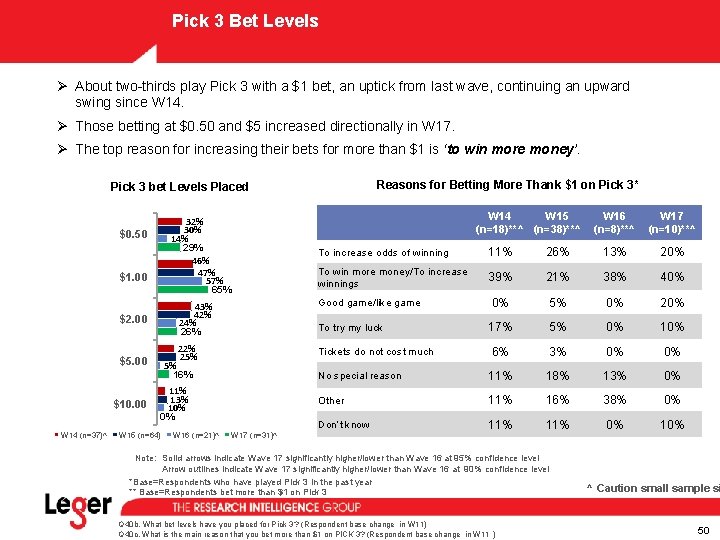
Pick 3 Bet Levels Ø About two-thirds play Pick 3 with a $1 bet, an uptick from last wave, continuing an upward swing since W 14. Ø Those betting at $0. 50 and $5 increased directionally in W 17. Ø The top reason for increasing their bets for more than $1 is ‘to win more money’. Reasons for Betting More Thank $1 on Pick 3* Pick 3 bet Levels Placed 32% 30% 14% 29% 46% 47% 57% 65% $0. 50 $1. 00 $2. 00 $5. 00 $10. 00 W 14 (n=37)^ 26% 13% 20% To win more money/To increase winnings 39% 21% 38% 40% 0% 5% 0% 20% 17% 5% 0% 10% 6% 3% 0% 0% No special reason 11% 18% 13% 0% Other 11% 16% 38% 0% Don’t know 11% 0% 10% 22% 25% Tickets do not cost much W 16 (n=21)^ To try my luck W 17 (n=31)^ W 17 (n=10)**^ 11% Good game/like game 11% 13% 10% 0% W 16 (n=8)**^ To increase odds of winning 43% 42% 24% 26% 5% 16% W 15 (n=64) W 14 W 15 (n=18)**^ (n=38)**^ Note: Solid arrows indicate Wave 17 significantly higher/lower than Wave 16 at 95% confidence level Arrow outlines indicate Wave 17 significantly higher/lower than Wave 16 at 90% confidence level *Base=Respondents who have played Pick 3 in the past year ** Base=Respondents bet more than $1 on Pick 3 Q 40 b. What bet levels have you placed for Pick 3 ? (Respondent base change in W 11) Q 40 c. What is the main reason that you bet more than $1 on PICK 3? (Respondent base change in W 11 ) ^ Caution small sample si 50
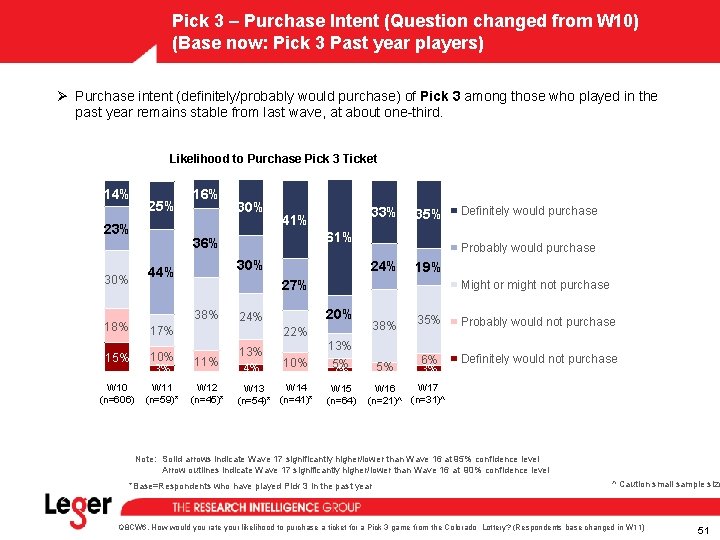
Pick 3 – Purchase Intent (Question changed from W 10) (Base now: Pick 3 Past year players) Ø Purchase intent (definitely/probably would purchase) of Pick 3 among those who played in the past year remains stable from last wave, at about one-third. Likelihood to Purchase Pick 3 Ticket 14% 25% 23% 16% 33% 41% 35% 61% 36% 30% 44% 30% Probably would purchase 24% 19% 27% 38% 17% 15% 10% 3% 11% W 10 (n=606) W 11 (n=59)* W 12 (n=45)* Might or might not purchase 20% 24% 38% 22% 13% 4% 10% W 14 W 13 (n=54)* (n=41)* Definitely would purchase 13% 5% 2% W 15 (n=64) 5% 35% Probably would not purchase 6% 3% Definitely would not purchase W 17 W 16 (n=21)^ (n=31)^ Note: Solid arrows indicate Wave 17 significantly higher/lower than Wave 16 at 95% confidence level Arrow outlines indicate Wave 17 significantly higher/lower than Wave 16 at 90% confidence level *Base=Respondents who have played Pick 3 in the past year ^ Caution small sample size Q 8 CW 6. How would you rate your likelihood to purchase a ticket for a Pick 3 game from the Colorado Lottery? (Respondents base changed in W 11) 51
Scratch
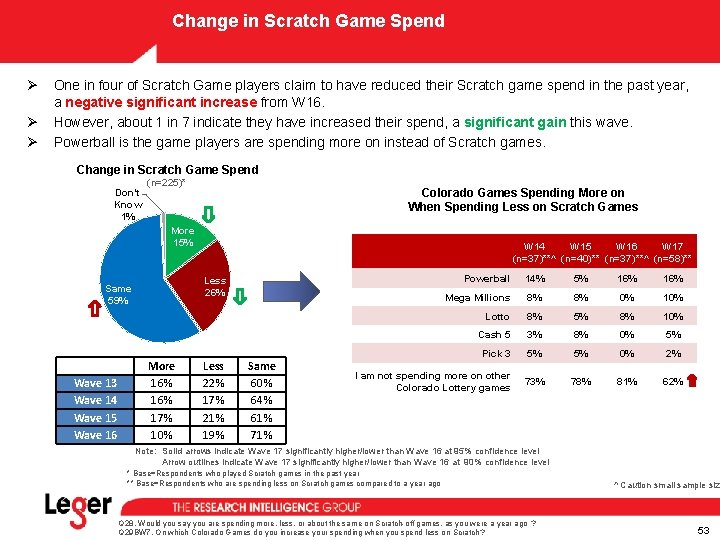
Change in Scratch Game Spend Ø Ø Ø One in four of Scratch Game players claim to have reduced their Scratch game spend in the past year, a negative significant increase from W 16. However, about 1 in 7 indicate they have increased their spend, a significant gain this wave. Powerball is the game players are spending more on instead of Scratch games. Change in Scratch Game Spend Don't Know 1% (n=225)* Colorado Games Spending More on When Spending Less on Scratch Games More 15% W 15 W 16 W 17 Powerball 14% 5% 16% Mega Millions 8% 8% 0% 10% Lotto 8% 5% 8% 10% Cash 5 3% 8% 0% 5% Pick 3 5% 5% 0% 2% I am not spending more on other Colorado Lottery games 73% 78% 81% 62% Less 26% Same 59% Wave 13 Wave 14 Wave 15 Wave 16 W 14 (n=37)**^ (n=40)** (n=37)**^ (n=58)** More 16% 17% 10% Less 22% 17% 21% 19% Same 60% 64% 61% 71% Note: Solid arrows indicate Wave 17 significantly higher/lower than Wave 16 at 95% confidence level Arrow outlines indicate Wave 17 significantly higher/lower than Wave 16 at 90% confidence level * Base=Respondents who played Scratch games in the past year ** Base=Respondents who are spending less on Scratch games compared to a year ago Q 28. Would you say you are spending more, less, or about the same on Scratch-off games, as you were a year ago ? Q 29 BW 7. On which Colorado Games do you increase your spending when you spend less on Scratch? ^ Caution small sample size 53
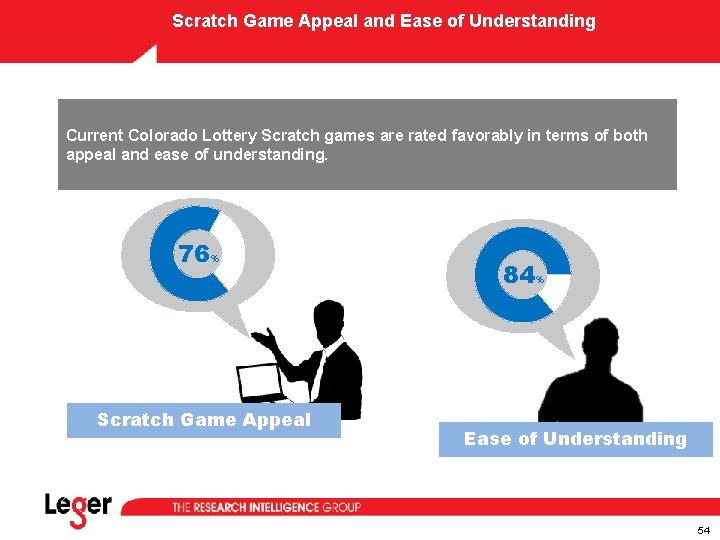
Scratch Game Appeal and Ease of Understanding Current Colorado Lottery Scratch games are rated favorably in terms of both appeal and ease of understanding. 76% Scratch Game Appeal 84% Ease of Understanding 54
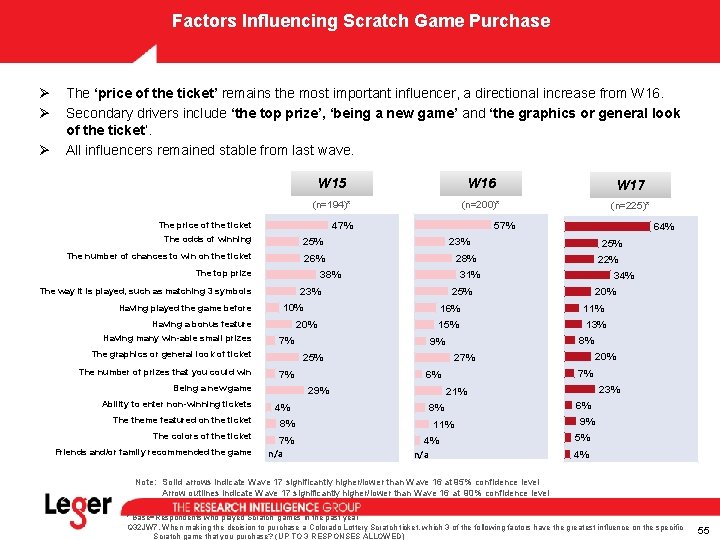
Factors Influencing Scratch Game Purchase Ø Ø Ø The ‘price of the ticket’ remains the most important influencer, a directional increase from W 16. Secondary drivers include ‘the top prize’, ‘being a new game’ and ‘the graphics or general look of the ticket’. All influencers remained stable from last wave. W 15 W 16 W 17 (n=194)* (n=200)* (n=225)* 25% The number of chances to win on the ticket 26% The top prize Having many win-able small prizes 7% The graphics or general look of ticket The number of prizes that you could win Ability to enter non-winning tickets 4% 8% The colors of the ticket 7% n/a Friends and/or family recommended the game 11% 15% 13% 8% 20% 27% 7% 6% 29% The theme featured on the ticket 20% 16% 9% 7% 34% 25% Being a new game 22% 31% 10% 25% 28% 23% Having a bonus feature 64% 23% 38% The way it is played, such as matching 3 symbols Having played the game before 57% 47% The price of the ticket The odds of winning 23% 21% 8% 11% 4% n/a 6% 9% 5% 4% Note: Solid arrows indicate Wave 17 significantly higher/lower than Wave 16 at 95% confidence level Arrow outlines indicate Wave 17 significantly higher/lower than Wave 16 at 90% confidence level * Base=Respondents who played Scratch games in the past year Q 32 JW 7. When making the decision to purchase a Colorado Lottery Scratch ticket, which 3 of the following factors have the greatest influence on the specific Scratch game that you purchase? (UP TO 3 RESPONSES ALLOWED) 55
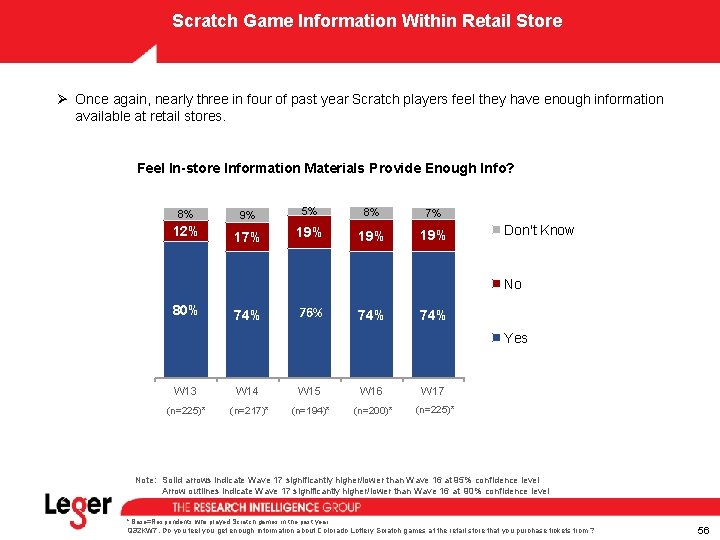
Scratch Game Information Within Retail Store Ø Once again, nearly three in four of past year Scratch players feel they have enough information available at retail stores. Feel In-store Information Materials Provide Enough Info? 8% 12% 9% 5% 8% 7% 19% 19% Don't Know No 80% 74% 76% 74% Yes W 13 W 14 W 15 W 16 W 17 (n=225)* (n=217)* (n=194)* (n=200)* (n=225)* Note: Solid arrows indicate Wave 17 significantly higher/lower than Wave 16 at 95% confidence level Arrow outlines indicate Wave 17 significantly higher/lower than Wave 16 at 90% confidence level * Base=Respondents who played Scratch games in the past year Q 32 KW 7. Do you feel you get enough information about Colorado Lottery Scratch games at the retail store that you purchase tickets from ? 56
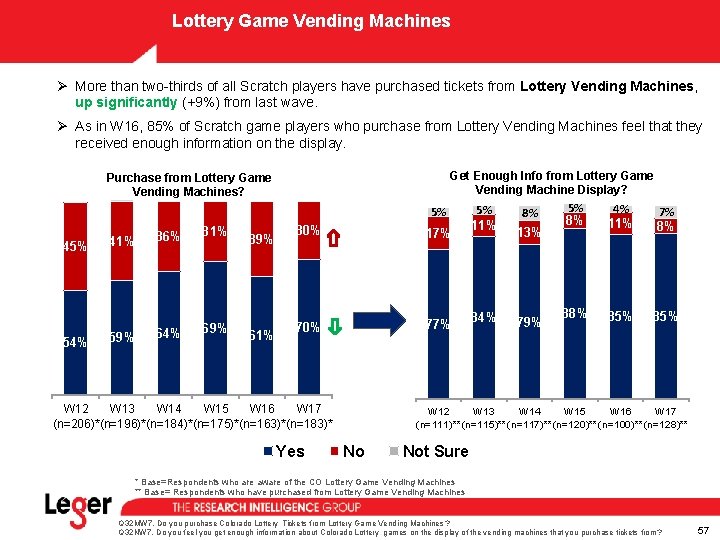
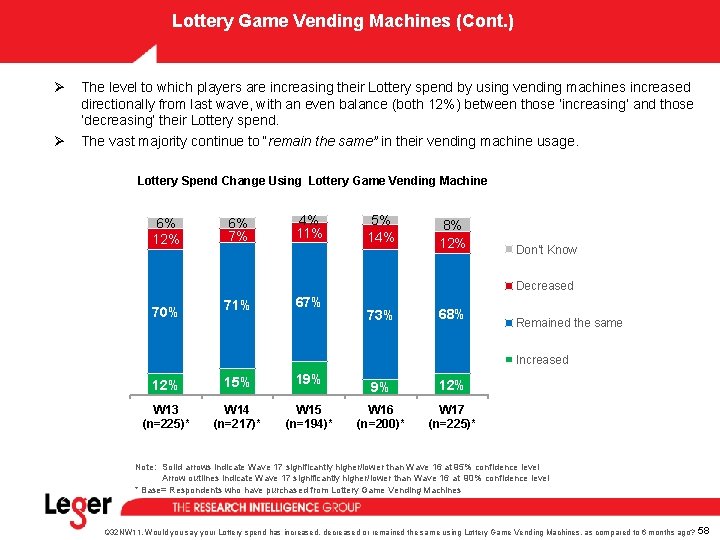
Lottery Game Vending Machines Ø More than two-thirds of all Scratch players have purchased tickets from Lottery Vending Machines, up significantly (+9%) from last wave. Ø As in W 16, 85% of Scratch game players who purchase from Lottery Vending Machines feel that they received enough information on the display. Get Enough Info from Lottery Game Vending Machine Display? Purchase from Lottery Game Vending Machines? 5% 45% 54% 41% 59% 36% 64% 31% 69% 39% 61% 30% 17% 70% 77% W 12 W 13 W 14 W 15 W 16 W 17 (n=206)*(n=196)*(n=184)*(n=175)*(n=163)*(n=183)* Yes 5% 11% 84% 8% 13% 79% 5% 8% 4% 11% 7% 8% 85% 85% W 12 W 13 W 14 W 15 W 16 W 17 (n=111)** (n=115)** (n=117)** (n=120)** (n=100)** (n=128)** No Not Sure * Base=Respondents who are aware of the CO Lottery Game Vending Machines ** Base= Respondents who have purchased from Lottery Game Vending Machines Q 32 MW 7. Do you purchase Colorado Lottery Tickets from Lottery Game Vending Machines ? Q 32 NW 7. Do you feel you get enough information about Colorado Lottery games on the display of the vending machines that you purchase tickets from? 57
Lottery Game Vending Machines (Cont. ) Ø Ø The level to which players are increasing their Lottery spend by using vending machines increased directionally from last wave, with an even balance (both 12%) between those ‘increasing’ and those ‘decreasing’ their Lottery spend. The vast majority continue to “remain the same” in their vending machine usage. Lottery Spend Change Using Lottery Game Vending Machine 6% 12% 6% 7% 4% 11% 5% 14% 8% 12% Don’t Know Decreased 70% 71% 67% 73% 68% Remained the same Increased 12% 15% 19% W 13 (n=225)* W 14 (n=217)* W 15 (n=194)* 9% 12% W 16 (n=200)* W 17 (n=225)* Note: Solid arrows indicate Wave 17 significantly higher/lower than Wave 16 at 95% confidence level Arrow outlines indicate Wave 17 significantly higher/lower than Wave 16 at 90% confidence level * Base= Respondents who have purchased from Lottery Game Vending Machines Q 32 NW 11. Would you say your Lottery spend has increased, decreased or remained the same using Lottery Game Vending Machines, as compared to 6 months ago? 58
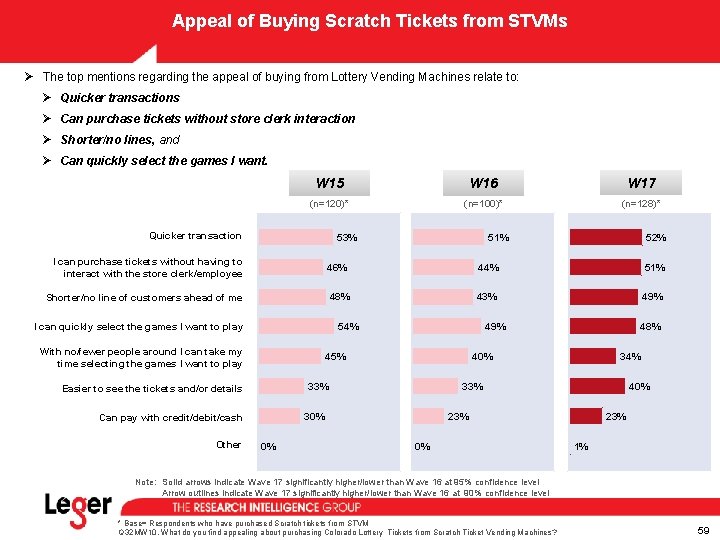
Appeal of Buying Scratch Tickets from STVMs Ø The top mentions regarding the appeal of buying from Lottery Vending Machines relate to: Ø Quicker transactions Ø Can purchase tickets without store clerk interaction Ø Shorter/no lines, and Ø Can quickly select the games I want. W 15 W 16 W 17 (n=120)* (n=100)* (n=128)* Quicker transaction 53% 51% 52% I can purchase tickets without having to interact with the store clerk/employee 46% 44% 51% Shorter/no line of customers ahead of me 48% 43% 49% 54% I can quickly select the games I want to play With no/fewer people around I can take my time selecting the games I want to play 45% 0% 34% 33% 30% Can pay with credit/debit/cash 48% 40% 33% Easier to see the tickets and/or details Other 49% 40% 23% 1% Note: Solid arrows indicate Wave 17 significantly higher/lower than Wave 16 at 95% confidence level Arrow outlines indicate Wave 17 significantly higher/lower than Wave 16 at 90% confidence level * Base= Respondents who have purchased Scratch tickets from STVM Q 32 MW 10. What do you find appealing about purchasing Colorado Lottery Tickets from Scratch Ticket Vending Machines? 59
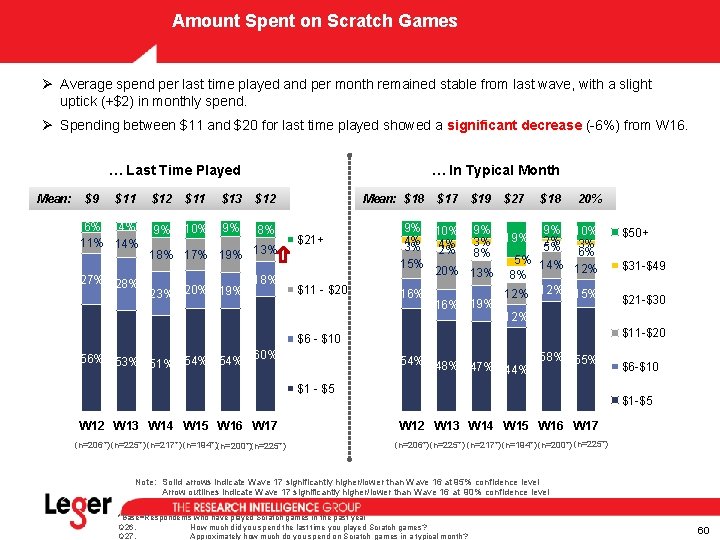
Amount Spent on Scratch Games Ø Average spend per last time played and per month remained stable from last wave, with a slight uptick (+$2) in monthly spend. Ø Spending between $11 and $20 for last time played showed a significant decrease (-6%) from W 16. … Last Time Played Mean: $9 … In Typical Month $11 $12 $11 $13 $12 6% 4% 11% 14% 9% 10% 9% 8% 27% 28% 17% 19% 13% 20% 19% 18% Mean: $18 $21+ $11 - $20 $17 $19 $27 $18 20% 9% 10% 9% 9% 10% 4% 4% 3% 19% 2% 3% 3% 2% 8% 5% 6% 5% 15% 20% 13% 8% 14% 12% 16% 12% 15% 19% 16% 12% $31 -$49 $21 -$30 $11 -$20 $6 - $10 56% 53% 51% 54% 60% $50+ 58% 55% 54% 48% 47% 44% $1 - $5 $6 -$10 $1 -$5 W 12 W 13 W 14 W 15 W 16 W 17 (n=206*) (n=225*) (n=217*) (n=194*)(n=200*)(n=225*) (n=206*) (n=225*) (n=217*) (n=194*) (n=200*) (n=225*) Note: Solid arrows indicate Wave 17 significantly higher/lower than Wave 16 at 95% confidence level Arrow outlines indicate Wave 17 significantly higher/lower than Wave 16 at 90% confidence level *Base=Respondents who have played Scratch games in the past year Q 26. How much did you spend the last time you played Scratch games? Q 27. Approximately how much do you spend on Scratch games in a typical month? 60
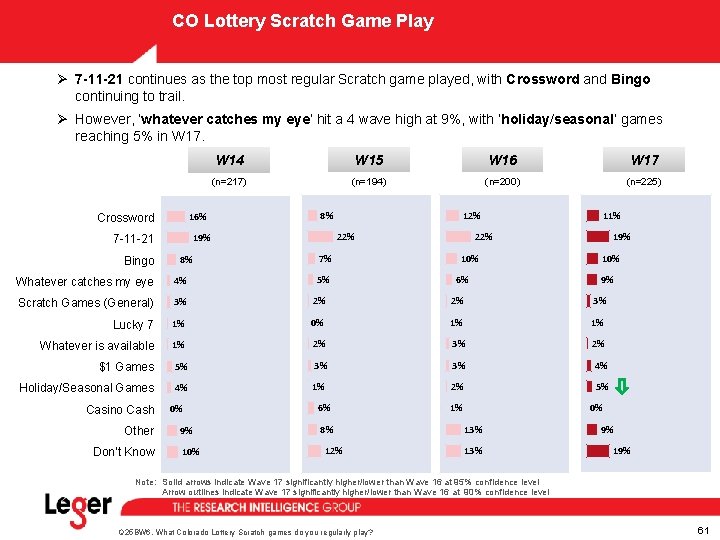
CO Lottery Scratch Game Play Ø 7 -11 -21 continues as the top most regular Scratch game played, with Crossword and Bingo continuing to trail. Ø However, ‘whatever catches my eye’ hit a 4 wave high at 9%, with ‘holiday/seasonal’ games reaching 5% in W 17. 16% Crossword W 15 W 16 W 17 (n=217) (n=194) (n=200) (n=225) 8% 8% 12% 22% 19% 7 -11 -21 Bingo W 14 7% 5% 11% 22% 10% 6% 19% 10% 9% Whatever catches my eye 4% Scratch Games (General) 3% 2% 2% 3% Lucky 7 1% 0% 1% 1% Whatever is available 1% 2% 3% 2% $1 Games 5% 3% 3% 4% Holiday/Seasonal Games 4% 1% 2% 5% Casino Cash Other Don’t Know 0% 9% 10% 6% 8% 12% 1% 0% 13% 9% 19% Note: Solid arrows indicate Wave 17 significantly higher/lower than Wave 16 at 95% confidence level Arrow outlines indicate Wave 17 significantly higher/lower than Wave 16 at 90% confidence level Q 25 BW 6. What Colorado Lottery Scratch games do you regularly play? 61
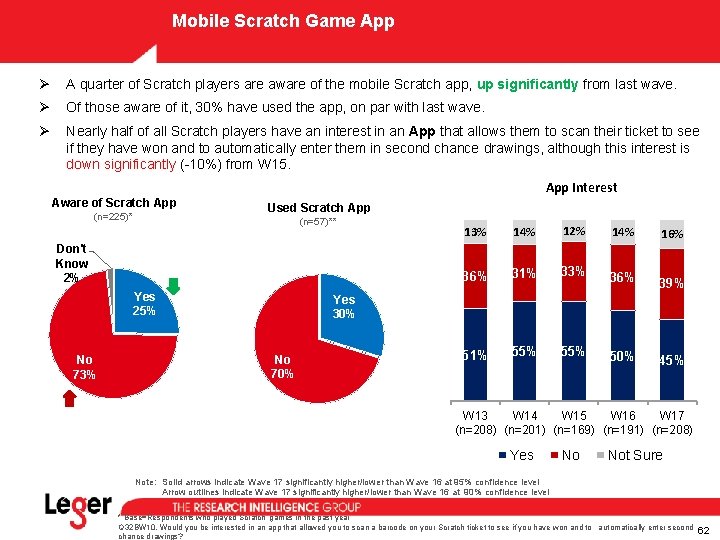
Mobile Scratch Game App Ø A quarter of Scratch players are aware of the mobile Scratch app, up significantly from last wave. Ø Of those aware of it, 30% have used the app, on par with last wave. Ø Nearly half of all Scratch players have an interest in an App that allows them to scan their ticket to see if they have won and to automatically enter them in second chance drawings, although this interest is down significantly (-10%) from W 15. App Interest Aware of Scratch App (n=225)* Used Scratch App (n=57)** Don't Know 2% Yes 25% No 73% 14% 12% 14% 16% 31% 33% 36% 39% 51% 55% 50% 45% Yes 30% No 70% W 13 W 14 W 15 W 16 W 17 (n=208) (n=201) (n=169) (n=191) (n=208) Yes No Not Sure Note: Solid arrows indicate Wave 17 significantly higher/lower than Wave 16 at 95% confidence level Arrow outlines indicate Wave 17 significantly higher/lower than Wave 16 at 90% confidence level * Base=Respondents who played Scratch games in the past year Q 32 BW 10. Would you be interested in an app that allowed you to scan a barcode on your Scratch ticket to see if you have won and to automatically enter second chance drawings? 62
THANK YOU www. leger 360. com ANY QUESTIONS?