Lotto Graphs Animated Lottery Videos Investor Pitch Deck


- Slides: 22

Lotto. Graphs Animated Lottery Videos Investor Pitch Deck

Lotto. Graphs Company • Lotto. Graphs is a startup interactive multimedia software company in the $225 billion dollar lottery industry.

What are Lotto. Graphs • Lotto. Graphs are Animated Graphs that track Trends in Lottery numbers. The same Graphs that are used by Business Professionals to track trends in the Financial Marketplace. Lotto. Graphs Help you track trends in Lottery numbers using computer animation. • For the first time in lottery number drawing history you can track these trends VISUALLY !! • You will be able to spot these trends with just a quick look at our unique animated lottery videos. Which show lottery number drawing history using our custom Database Graphics Animation Engine.

Lotto. Graphs Target Market • Lotto. Graphs was created with the 150 millions USA Lottery and Keno Players in mind. Of those, 35 Million are devoted weekly players. This is are Targeted Market

The Need • The Need - Lottery players track trends in lottery numbers. Everyone has a system to play and win. We Say - Keep the System that works for you, But Compare the Numbers you are choosing to the Numbers that are actually being drawn right now in real time with Lotto. Graphs Historical Animated Lottery Videos

The Solution Lotto. Graphs Animated Lottery Videos Real Time Historical Tending for KENO Power. Ball Mega Million s Massachusetts Lottery Games Mass Cash Mega. Bucks Daily Numbers Games Lucky For Life www. Lotto. Graphs. tv For the First Time in Lottery Drawing History you’ll see Trending VISUALLY Using our Unique Animation Graphics Engine ! Coming Soon All USA Lottery Games Lotto. Graphs Mobile App

Recent News !! • The Largest Lottery Jackpot every occurred recently in the Multi State Power. Ball Lottery Game the jackpot reached a whopping • $1. 5 Billion Dollars • Lottery Fever “Frenzy” Sweeps Across the USA as Millions of people get a chance to win the largest lottery jackpot prize ever ! • In Pennsylvana tickets were selling at a rate of 20, 000 Power. Ball tickets per minute • http: //www. pennlive. com/news/2016/02/powerball_f ever_led_to_histori. html

Mobile Device Explosion !! • Mobile Device Market Has Exploded in Recent Years. • Lotto. Graphs works on most major Mobile Devices with Internet Web Access.

Millions Play Lotteries Everyday

Market Summary HERE'S HOW MUCH EACH STATE SPENDS ON LOTTERIES http: //www. attn. com/stories/5155/lottery-sales-by-state

Demographic Information !! • In 2014, Americans spent $70 billion on the lottery. • http: //metrocosm. com/state-lotteries-high-cost-low-return-andabsurdly-dishonest/

Market Summary • The Highest- and Lowest Lotto Spenders (Dollars-Person, by State)

Business Model: Key Revenue Streams • Lotto. Graphs are sold on a Membership Subscription basis with repete sales year after year. - Adverage Pricing $29. 95 per year • Sold Through our Affiliate Programs for Consumers and B 2 B Lottery Ticket Vendors • Advertising Revenue from Ad placements on App & Web Site from Selected Vendors

Summary of Company Strengths • Market • - 35 Millions Devote Weekly Lottery Players • Management • - William Lott, • Competitive Edge • - Animated Historical Lottery Tending in Real Time • - Repete Sales Year After Year − Cloud Based & Mobile Application in Development • Products/Services/Customers • - Internet Cloud Bases Lottery Analysis Tools • Cost/Profit • • $29. 95 for One Year - $19. 95 for 6 months That’s just 8 Cents per day. !!

Some of our Competitors

Financial Need !! We are seeking $250. 000 in Equity Capital to Launch our product line Nationwide USE OF FUNDS Develop Other USA State Lottery Games Add New Features to the Current Code PR, Sales & Marketing, Social Media Marketing

Financial Information !! Lott-o-Graph$ Lottery Video Sales Projections for Year 1 Unit Price >>> 19. 95 <<<< $19. 95 per year Proforma Estimated Cash Flow Statement Items Month 4 Month 5 Month 9 Month 10 Month 11 Month 12 $19. 95 $19, 950. 00 $99, 750. 00 $199, 500. 00 $399, 000. 00 $598, 500. 00 $798, 000. 00 $997, 500. 00 $1, 197, 000. 00 $1, 396, 500. 00 $1, 596, 000. 00 $1, 995, 000. 00 1 1000 5000 10000 20000 30000 40000 50000 60000 70000 80000 100000 466001 Advertising $0. 00 $1, 000. 00 $5, 000. 00 $10, 000. 00 $20, 000. 00 $30, 000. 00 $40, 000. 00 $50, 000. 00 $60, 000. 00 $70, 000. 00 $100, 000. 00 $150, 000. 00 $536, 000. 00 Salaries $0. 00 $2, 000. 00 $4, 000. 00 $8, 000. 00 $12, 000. 00 $14, 000. 00 $18, 000. 00 $20, 000. 00 $25, 000. 00 $30, 000. 00 $188, 000. 00 Payroll Taxes $0. 00 $0. 00 Rent, Heat, Lights $0. 00 $0. 00 Phone $0. 00 $50. 00 $100. 00 $150. 00 $200. 00 $250. 00 $300. 00 $350. 00 $400. 00 $500. 00 $2, 650. 00 Insurance $0. 00 $200. 00 $0. 00 $200. 00 $800. 00 Consultant Fees $0. 00 $2, 000. 00 $12, 000. 00 Web Site Production $0. 00 $1, 000. 00 $2, 000. 00 $3, 000. 00 $4, 000. 00 $5, 000. 00 $21, 000. 00 Travel & Entertainment $0. 00 $200. 00 $500. 00 $1, 000. 00 $1, 500. 00 $2, 000. 00 $15, 200. 00 Flash Production $0. 00 $0. 00 Postage $0. 00 $100. 00 $200. 00 $400. 00 $500. 00 $600. 00 $4, 900. 00 Office Supplies $0. 00 $500. 00 $1, 000. 00 $1, 500. 00 $2, 000. 00 $16, 000. 00 Legal & Accounting $0. 00 $500. 00 $0. 00 $1, 000. 00 $3, 500. 00 Video Subscription Sales Subscriptions Sold Month 1 Month 2 Audit Expenses Sales Commissions Month 3 Month 6 Month 7 Month 8 $9, 296, 719. 95 $500. 00 $2, 000. 00 $20, 000. 00 $40, 000. 00 $60, 000. 00 $120, 000. 00 $1, 388, 051. 00 Monthly Expenses $0. 00 $3, 850. 00 $12, 000. 00 $21, 000. 00 $35, 650. 00 $70, 400. 00 $65, 750. 00 $77, 750. 00 $135, 500. 00 $105, 350. 00 $141, 000. 00 $253, 800. 00 Taxes $2. 99 $2, 992. 50 $14, 962. 50 $29, 925. 00 $59, 850. 00 $89, 775. 00 $119, 700. 00 $149, 625. 00 $179, 550. 00 $209, 475. 00 $239, 400. 00 $299, 250. 00 $16. 96 $13, 107. 50 $72, 787. 50 $148, 575. 00 $303, 500. 00 $438, 325. 00 $612, 550. 00 $770, 125. 00 $881, 950. 00 $1, 081, 675. 00 $1, 215, 600. 00 $1, 441, 950. 00 Net Income Totals $7, 908, 668. 95

Financial Information !! Sales One Dollar One Day Quick Look % of Total Sales 30 Day Plan % of Total Sales 3 Month Plan % of Total Sales 6 Month Plan % of Total Sales 12 Month Plan % of Total Sales Total Sales Year 1 Year 2 Year 3 $15, 870, 203. 67 $39, 675, 509. 18 $69, 432, 141. 06 0. 201409697 $14, 693, 346. 45 $36, 733, 366. 12 $64, 283, 390. 71 0. 186474132 $11, 528, 625. 67 $28, 821, 564. 19 $50, 437, 737. 33 0. 146310473 $16, 158, 752. 83 $40, 396, 882. 07 $70, 694, 543. 62 0. 205071691 $20, 544, 700. 02 $51, 361, 750. 06 $89, 883, 062. 60 0. 260734007 0 0 0 0 0 $78, 795, 628. 64 $196, 989, 071. 61 $344, 730, 875. 32

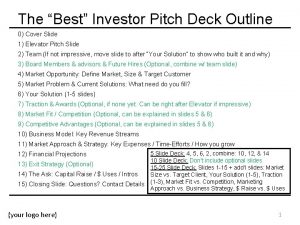
Investor Pitch Deck Outline 1)Elevator Pitch 2)Momentum, Traction, Expertise: Your key numbers 3)Market Opportunity: Define market size & your customer base 4)Problem & Current Solutions: What need do you fill? Other solutions 5)Product or Service: Your solution 6)Business Model: Key Revenue Streams 7)Market Approach & Strategy: How you grow your business 8)Team & Key Stakeholders (Investors, Advisors) 9)Financials 10)Competition 11)Investment: Your ‘Ask’ for funding, Basic use of funds Optional Slides: Exit Strategy, Partnership Agreements, Product/Service Demo Existing Sales/Clients, Your “Special Sauce”

Lotto. Graphs Mission Statement • We intend to become the One Stop Shop, a Destination for - Mobile Device Users who play Lottery Games every day, whether, it’s KENO, The Daily Numbers Games, or other Lotto games like Power. Ball, Mega Millions and expanding into other state lottery games which are played by Millions of People Every day in the USA and then Lottery Enthusiast all over the World ! • We intend to use Social Media to Educate our users with it’s useful features, and let it go viral over this medium.

The Profit

Subtitle Here SECTION DIVIDER LAYOUT
 Deck deck deck
 Investor deck outline
 Investor deck ejemplos
 Investor pitch template
 Pitch deck for influencers
 Personal pitch deck
 Pitch deck agenda
 Hackathon pitch deck
 Aceup pitch deck
 Final major project proposal
 Lbo pitch deck
 Pitch deck tagline
 Underlying magic slide
 Killer pitch deck
 Pitch music video
 Pitch deck template
 Coach investor relations
 Pitch deck timeline
 Stem pitch deck
 Underlying magic pitch deck
 Pitch deck biotech
 Music video pitch deck
 Roadmap deck


