Chapter 8 Unemployment and Inflation What we learned
- Slides: 44
Chapter 8: Unemployment and Inflation What we learned in our last class: • • What is GDP? Four important points in the definition. How to calculate GDP? Three approaches. GDP in the U. S. : Consumption, Net Export, Wages. Is GDP a good measurement of total production or the wellbeing? – – Household production The underground economy Leisure, pollution, ecologic costs, social problem The distribution of GDP • Nominal GDP vs. Real GDP: price level, GDP deflator. • Other measurement GNP, NI • Discussion: World War II effect, Airline & trucking industry. © 2008 Prentice Hall Business Publishing Economics R. Glenn Hubbard, Anthony Patrick O’Brien, 2 e. 1 of 36
Unemployment and Inflation Learning Objectives 8. 1 Define unemployment rate and labor force participation rate and understand how they are computed. 8. 2 Identify the three types of unemployment. 8. 3 Explain what factors determine the unemployment rate. 8. 4 Define price level and inflation rate and understand how they are computed. 8. 5 Use price indexes to adjust for the effects of inflation. 8. 6 Distinguish between the nominal interest rate and the real interest rate. 8. 7 Discuss the problems that inflation causes. © 2008 Prentice Hall Business Publishing Economics R. Glenn Hubbard, Anthony Patrick O’Brien, 2 e. 2 of 36
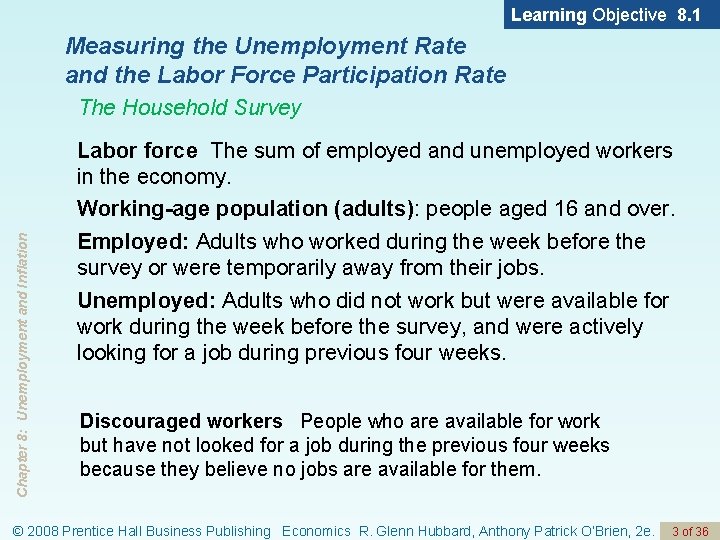
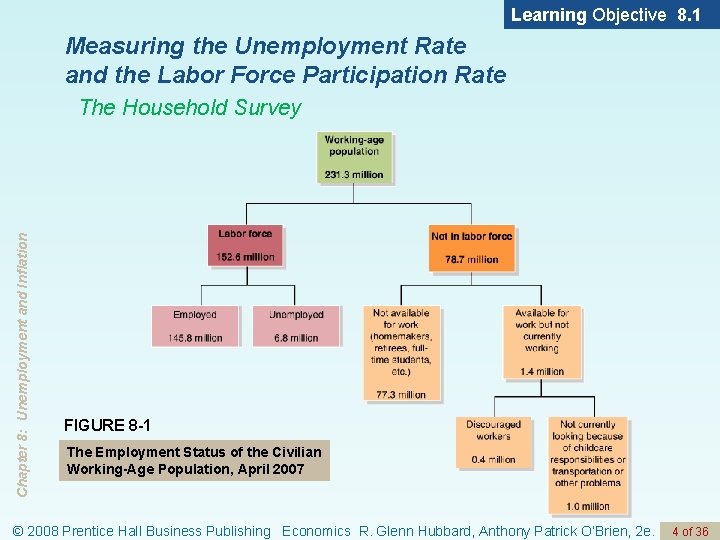
Learning Objective 8. 1 Measuring the Unemployment Rate and the Labor Force Participation Rate Chapter 8: Unemployment and Inflation The Household Survey Labor force The sum of employed and unemployed workers in the economy. Working-age population (adults): people aged 16 and over. Employed: Adults who worked during the week before the survey or were temporarily away from their jobs. Unemployed: Adults who did not work but were available for work during the week before the survey, and were actively looking for a job during previous four weeks. Discouraged workers People who are available for work but have not looked for a job during the previous four weeks because they believe no jobs are available for them. © 2008 Prentice Hall Business Publishing Economics R. Glenn Hubbard, Anthony Patrick O’Brien, 2 e. 3 of 36
Learning Objective 8. 1 Measuring the Unemployment Rate and the Labor Force Participation Rate Chapter 8: Unemployment and Inflation The Household Survey FIGURE 8 -1 The Employment Status of the Civilian Working-Age Population, April 2007 © 2008 Prentice Hall Business Publishing Economics R. Glenn Hubbard, Anthony Patrick O’Brien, 2 e. 4 of 36
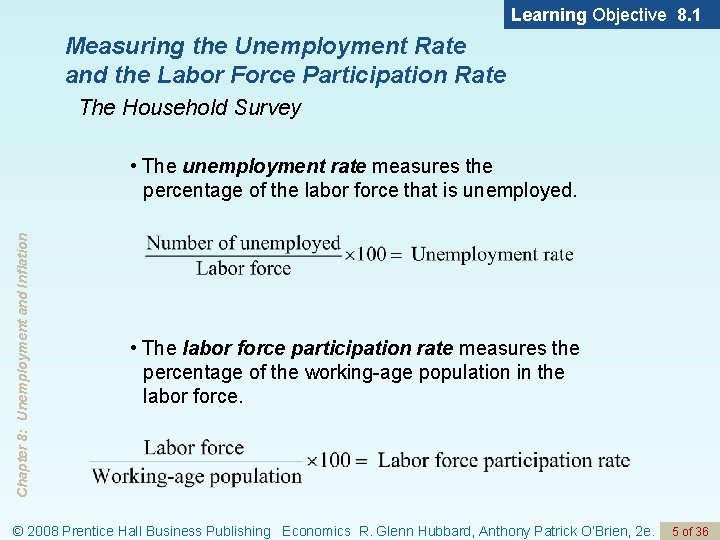
Learning Objective 8. 1 Measuring the Unemployment Rate and the Labor Force Participation Rate The Household Survey Chapter 8: Unemployment and Inflation • The unemployment rate measures the percentage of the labor force that is unemployed. • The labor force participation rate measures the percentage of the working-age population in the labor force. © 2008 Prentice Hall Business Publishing Economics R. Glenn Hubbard, Anthony Patrick O’Brien, 2 e. 5 of 36
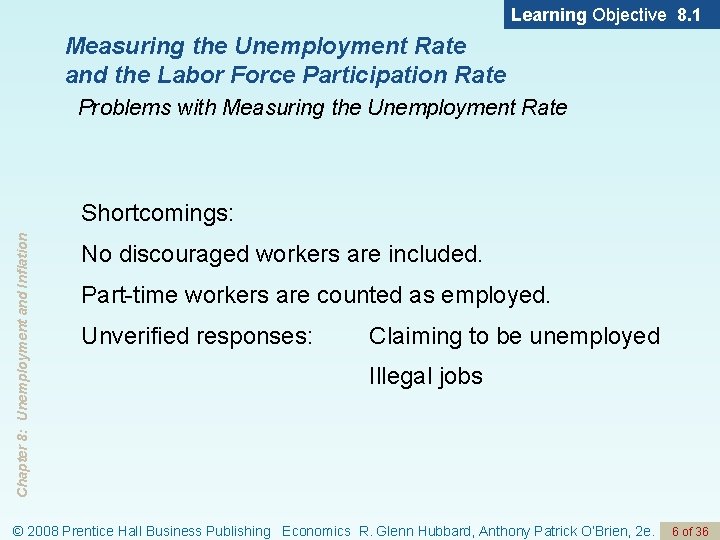
Learning Objective 8. 1 Measuring the Unemployment Rate and the Labor Force Participation Rate Problems with Measuring the Unemployment Rate Chapter 8: Unemployment and Inflation Shortcomings: No discouraged workers are included. Part-time workers are counted as employed. Unverified responses: Claiming to be unemployed Illegal jobs © 2008 Prentice Hall Business Publishing Economics R. Glenn Hubbard, Anthony Patrick O’Brien, 2 e. 6 of 36
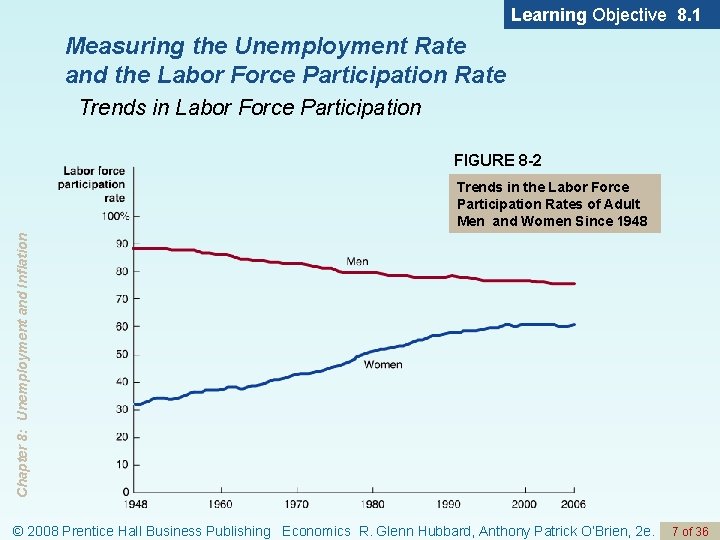
Learning Objective 8. 1 Measuring the Unemployment Rate and the Labor Force Participation Rate Trends in Labor Force Participation FIGURE 8 -2 Chapter 8: Unemployment and Inflation Trends in the Labor Force Participation Rates of Adult Men and Women Since 1948 © 2008 Prentice Hall Business Publishing Economics R. Glenn Hubbard, Anthony Patrick O’Brien, 2 e. 7 of 36
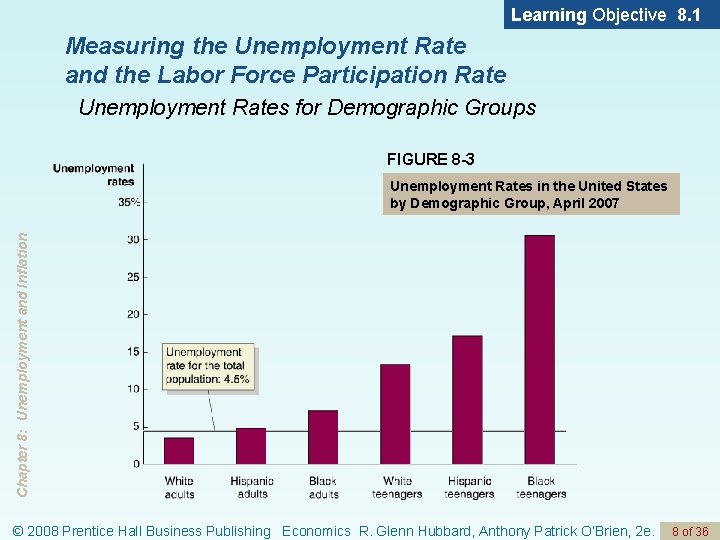
Learning Objective 8. 1 Measuring the Unemployment Rate and the Labor Force Participation Rate Unemployment Rates for Demographic Groups FIGURE 8 -3 Chapter 8: Unemployment and Inflation Unemployment Rates in the United States by Demographic Group, April 2007 © 2008 Prentice Hall Business Publishing Economics R. Glenn Hubbard, Anthony Patrick O’Brien, 2 e. 8 of 36
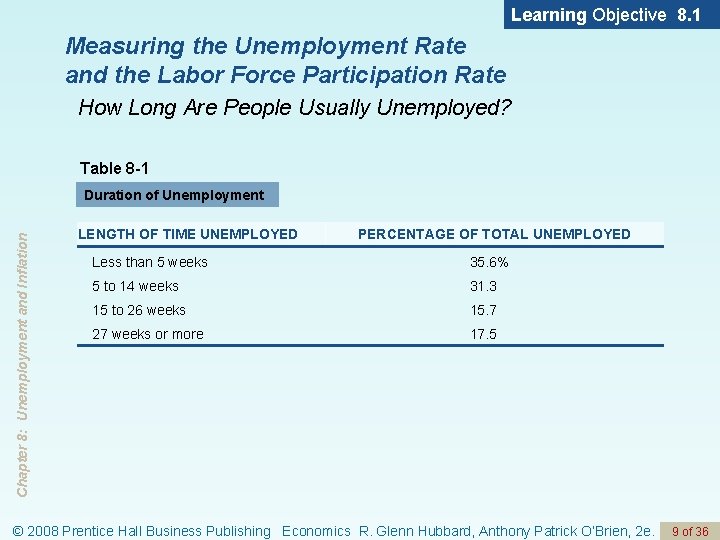
Learning Objective 8. 1 Measuring the Unemployment Rate and the Labor Force Participation Rate How Long Are People Usually Unemployed? Table 8 -1 Chapter 8: Unemployment and Inflation Duration of Unemployment LENGTH OF TIME UNEMPLOYED PERCENTAGE OF TOTAL UNEMPLOYED Less than 5 weeks 35. 6% 5 to 14 weeks 31. 3 15 to 26 weeks 15. 7 27 weeks or more 17. 5 © 2008 Prentice Hall Business Publishing Economics R. Glenn Hubbard, Anthony Patrick O’Brien, 2 e. 9 of 36
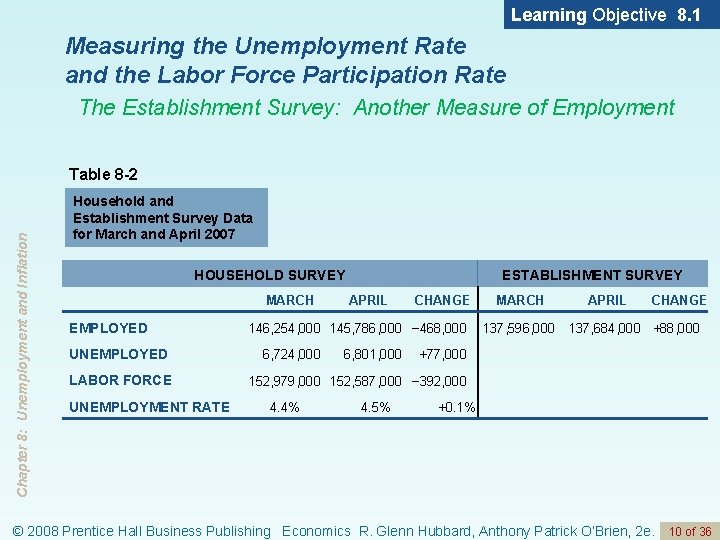
Learning Objective 8. 1 Measuring the Unemployment Rate and the Labor Force Participation Rate The Establishment Survey: Another Measure of Employment Chapter 8: Unemployment and Inflation Table 8 -2 Household and Establishment Survey Data for March and April 2007 HOUSEHOLD SURVEY MARCH EMPLOYED UNEMPLOYED LABOR FORCE UNEMPLOYMENT RATE ESTABLISHMENT SURVEY APRIL CHANGE 146, 254, 000 145, 786, 000 − 468, 000 6, 724, 000 6, 801, 000 MARCH 137, 596, 000 APRIL CHANGE 137, 684, 000 +88, 000 +77, 000 152, 979, 000 152, 587, 000 − 392, 000 4. 4% 4. 5% +0. 1% © 2008 Prentice Hall Business Publishing Economics R. Glenn Hubbard, Anthony Patrick O’Brien, 2 e. 10 of 36
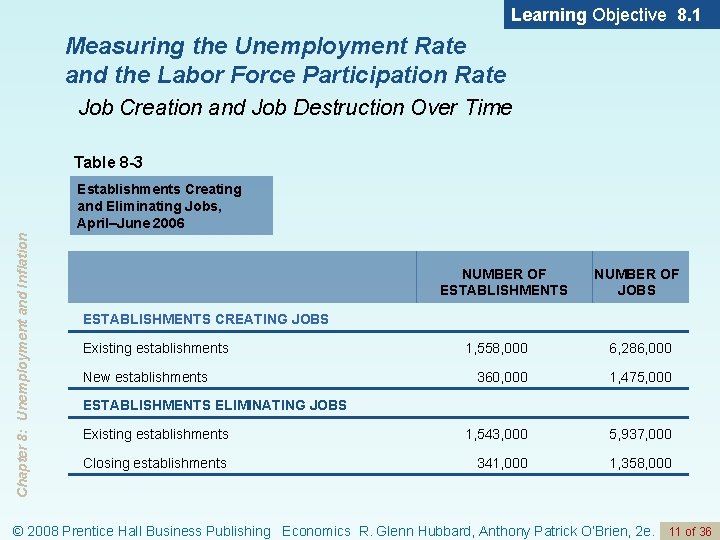
Learning Objective 8. 1 Measuring the Unemployment Rate and the Labor Force Participation Rate Job Creation and Job Destruction Over Time Table 8 -3 Chapter 8: Unemployment and Inflation Establishments Creating and Eliminating Jobs, April–June 2006 NUMBER OF ESTABLISHMENTS NUMBER OF JOBS ESTABLISHMENTS CREATING JOBS Existing establishments 1, 558, 000 6, 286, 000 360, 000 1, 475, 000 Existing establishments 1, 543, 000 5, 937, 000 Closing establishments 341, 000 1, 358, 000 New establishments ESTABLISHMENTS ELIMINATING JOBS © 2008 Prentice Hall Business Publishing Economics R. Glenn Hubbard, Anthony Patrick O’Brien, 2 e. 11 of 36
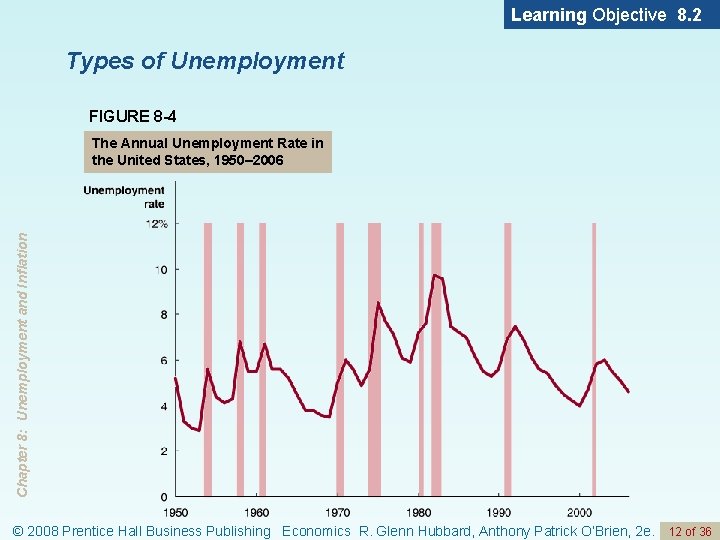
Learning Objective 8. 2 Types of Unemployment FIGURE 8 -4 Chapter 8: Unemployment and Inflation The Annual Unemployment Rate in the United States, 1950– 2006 © 2008 Prentice Hall Business Publishing Economics R. Glenn Hubbard, Anthony Patrick O’Brien, 2 e. 12 of 36
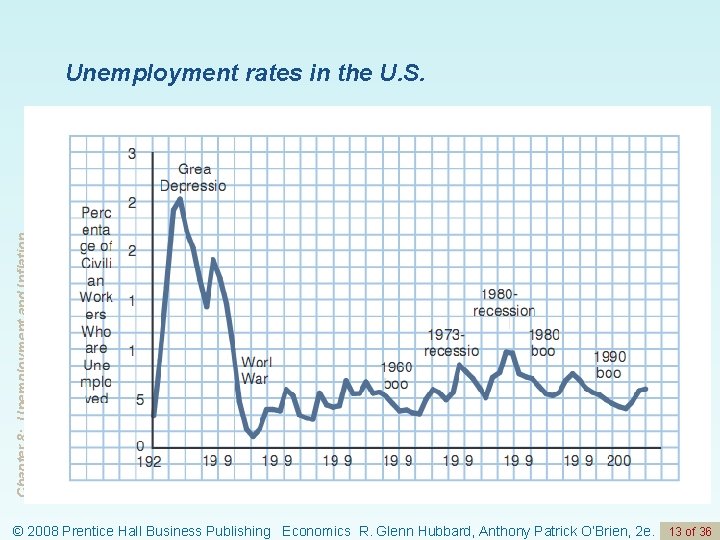
Chapter 8: Unemployment and Inflation Unemployment rates in the U. S. © 2008 Prentice Hall Business Publishing Economics R. Glenn Hubbard, Anthony Patrick O’Brien, 2 e. 13 of 36
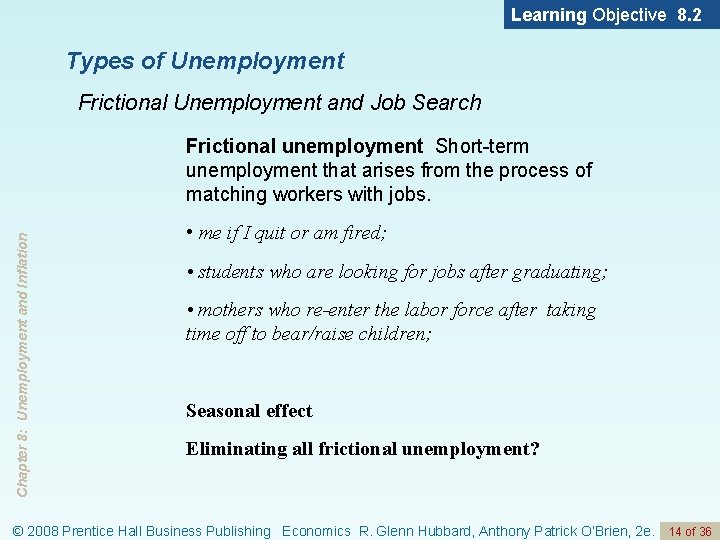
Learning Objective 8. 2 Types of Unemployment Frictional Unemployment and Job Search Chapter 8: Unemployment and Inflation Frictional unemployment Short-term unemployment that arises from the process of matching workers with jobs. • me if I quit or am fired; • students who are looking for jobs after graduating; • mothers who re-enter the labor force after taking time off to bear/raise children; Seasonal effect Eliminating all frictional unemployment? © 2008 Prentice Hall Business Publishing Economics R. Glenn Hubbard, Anthony Patrick O’Brien, 2 e. 14 of 36
Types of Unemployment Chapter 8: Unemployment and Inflation Structural unemployment Unemployment arising from a persistent mismatch between the skills and characteristics of workers and the requirements of jobs. Tend to be longer-term unemployed Widespread adoption of new technologies creates demands for people with new skills, but can render other skills obsolete Bus drivers, as subway services expand Bicycle repair experts, as motorcycles. cars, buses and subways are used more COBALT and FORTRAN programmers, as C++ and Java become more widely used Fishermen as fish stocks become depleted © 2008 Prentice Hall Business Publishing Economics R. Glenn Hubbard, Anthony Patrick O’Brien, 2 e. 15 of 36
Types of Unemployment Chapter 8: Unemployment and Inflation Cyclical unemployment Unemployment caused by a business cycle recession. – Some jobs disappear simply because the effects of slow GDP growth permeate through the economy – Policy makers spend a lot of time thinking about this type of unemployment in particular, how to maintain long term economic growth but minimize the magnitude of the business cycles © 2008 Prentice Hall Business Publishing Economics R. Glenn Hubbard, Anthony Patrick O’Brien, 2 e. 16 of 36
Learning Objective 8. 2 Types of Unemployment Chapter 8: Unemployment and Inflation Full Employment Natural rate of unemployment The normal rate of unemployment, consisting of frictional unemployment plus structural unemployment. When the remaining unemployment is only structural and frictional unemployment, the economy is said to be in Full Employment. © 2008 Prentice Hall Business Publishing Economics R. Glenn Hubbard, Anthony Patrick O’Brien, 2 e. 17 of 36
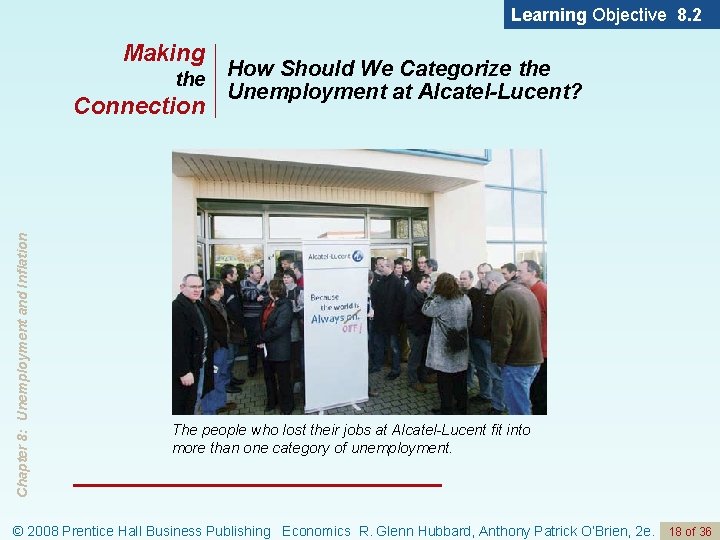
Learning Objective 8. 2 Making the Chapter 8: Unemployment and Inflation Connection How Should We Categorize the Unemployment at Alcatel-Lucent? The people who lost their jobs at Alcatel-Lucent fit into more than one category of unemployment. © 2008 Prentice Hall Business Publishing Economics R. Glenn Hubbard, Anthony Patrick O’Brien, 2 e. 18 of 36
Learning Objective 8. 3 Explaining Unemployment Government Policies and the Unemployment Rate Chapter 8: Unemployment and Inflation Unemployment Insurance and Other Payments to the Unemployed Unemployment insurance payments from the government. (a half of the average wage, around six months) Maintain income and spending, which lessens the personal hardship of being unemployed and also helps reduce the severity of recessions. Reduce the opportunity costs of being unemployed!! Government policy can affect unemployment level. © 2008 Prentice Hall Business Publishing Economics R. Glenn Hubbard, Anthony Patrick O’Brien, 2 e. 19 of 36
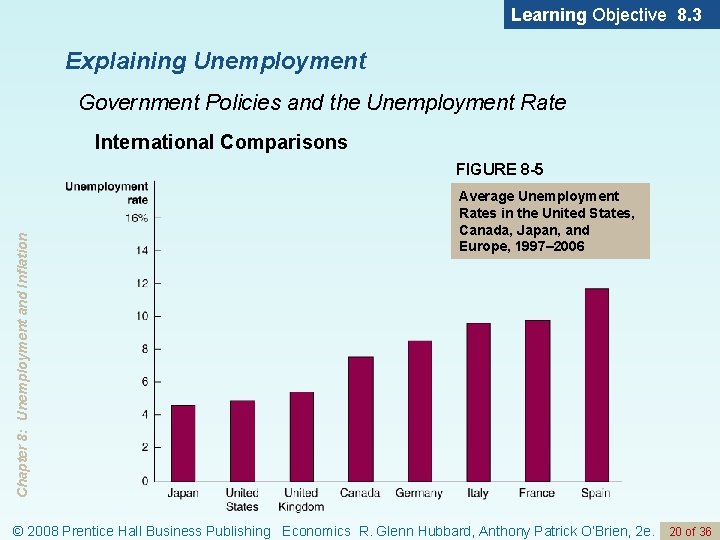
Learning Objective 8. 3 Explaining Unemployment Government Policies and the Unemployment Rate International Comparisons Chapter 8: Unemployment and Inflation FIGURE 8 -5 Average Unemployment Rates in the United States, Canada, Japan, and Europe, 1997– 2006 © 2008 Prentice Hall Business Publishing Economics R. Glenn Hubbard, Anthony Patrick O’Brien, 2 e. 20 of 36
Chapter 8: Unemployment and Inflation What we learned in our last class? How to measure the unemployment: The household survey: Working-age population (adults), Labor force, Employed, Unemployed, Discouraged workers. How to calculate the unemployment rate and the participation rate. Shortcomings of the household survey: how do the shortcomings bias the measure of the unemployment ? The establishments survey: Why the establishment survey is needed. Net number Facts in the U. S. © 2008 Prentice Hall Business Publishing Economics R. Glenn Hubbard, Anthony Patrick O’Brien, 2 e. 21 of 36
What we learned in our last class? How to measure the unemployment: Types of unemployment: Frictional, Structural, Cyclical Chapter 8: Unemployment and Inflation Natural rate of employment, Full employment. Government policy affects the unemployment: unemployment insurance and the opportunity costs of being unemployed. © 2008 Prentice Hall Business Publishing Economics R. Glenn Hubbard, Anthony Patrick O’Brien, 2 e. 22 of 36
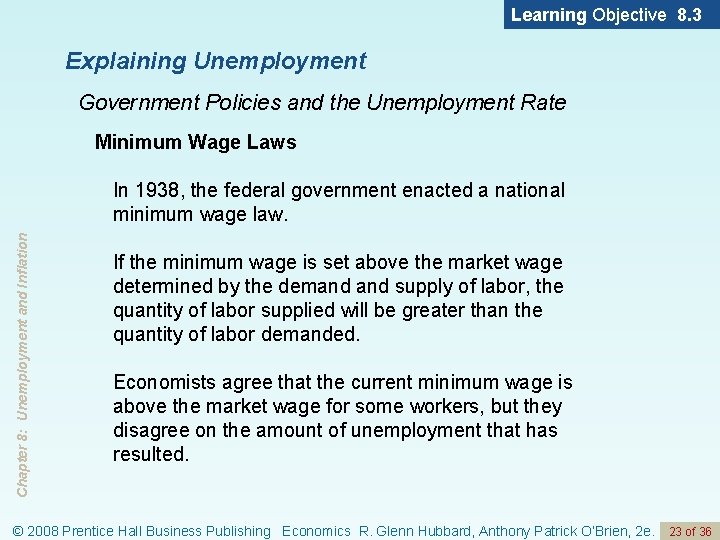
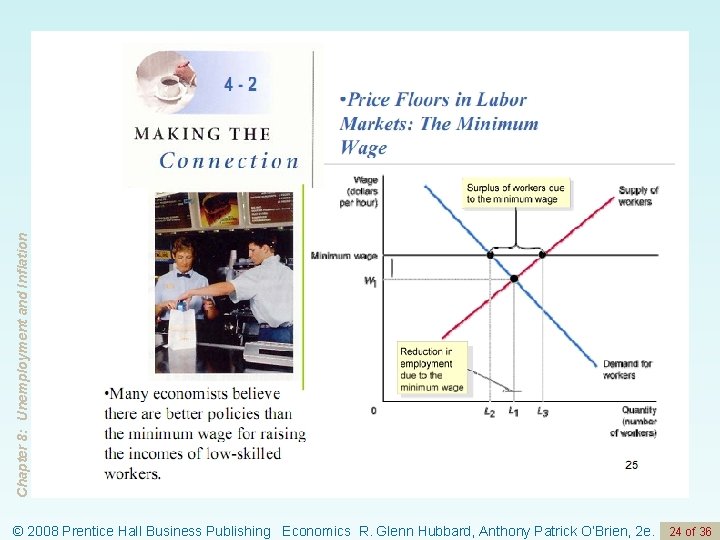
Learning Objective 8. 3 Explaining Unemployment Government Policies and the Unemployment Rate Minimum Wage Laws Chapter 8: Unemployment and Inflation In 1938, the federal government enacted a national minimum wage law. If the minimum wage is set above the market wage determined by the demand supply of labor, the quantity of labor supplied will be greater than the quantity of labor demanded. Economists agree that the current minimum wage is above the market wage for some workers, but they disagree on the amount of unemployment that has resulted. © 2008 Prentice Hall Business Publishing Economics R. Glenn Hubbard, Anthony Patrick O’Brien, 2 e. 23 of 36
Chapter 8: Unemployment and Inflation © 2008 Prentice Hall Business Publishing Economics R. Glenn Hubbard, Anthony Patrick O’Brien, 2 e. 24 of 36
Learning Objective 8. 3 Explaining Unemployment Labor Unions Chapter 8: Unemployment and Inflation Labor unions are organizations of workers that bargain with employers for higher wages and better working conditions for their members. Efficiency Wages Efficiency wage A higher-thanmarket wage that a firm pays to increase worker productivity. © 2008 Prentice Hall Business Publishing Economics R. Glenn Hubbard, Anthony Patrick O’Brien, 2 e. 25 of 36
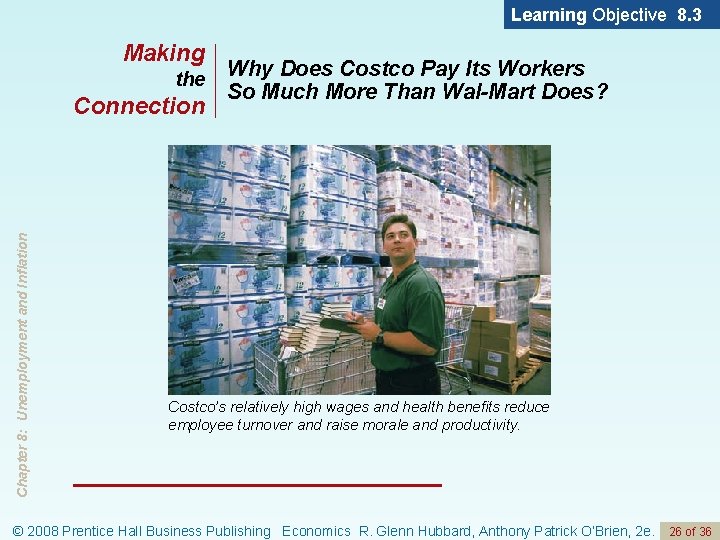
Learning Objective 8. 3 Making the Chapter 8: Unemployment and Inflation Connection Why Does Costco Pay Its Workers So Much More Than Wal-Mart Does? Costco’s relatively high wages and health benefits reduce employee turnover and raise morale and productivity. © 2008 Prentice Hall Business Publishing Economics R. Glenn Hubbard, Anthony Patrick O’Brien, 2 e. 26 of 36
Measuring Inflation Chapter 8: Unemployment and Inflation Prices in 1914: A Ford’s Model T: $600 A movie ticket: $0. 08 A Box of Kellog’s Cone flakes: $0. 08 Price level A measure of the average prices of goods and services in the economy. Inflation rate The percentage increase in the price level from one year to the next. © 2008 Prentice Hall Business Publishing Economics R. Glenn Hubbard, Anthony Patrick O’Brien, 2 e. 27 of 36
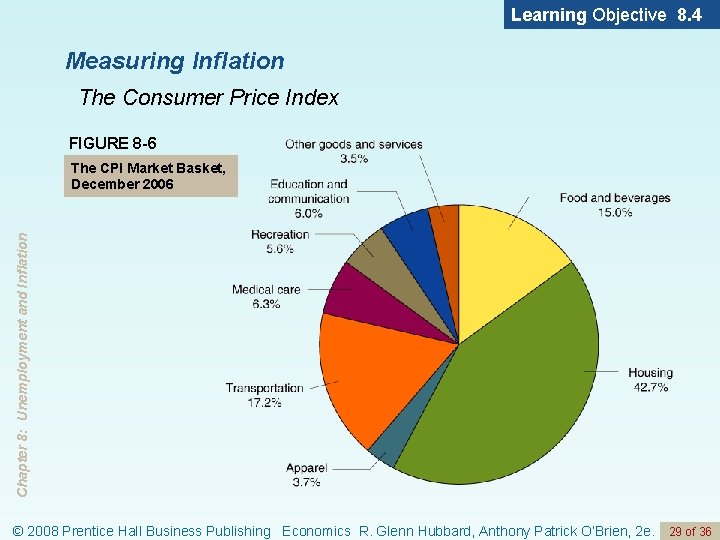
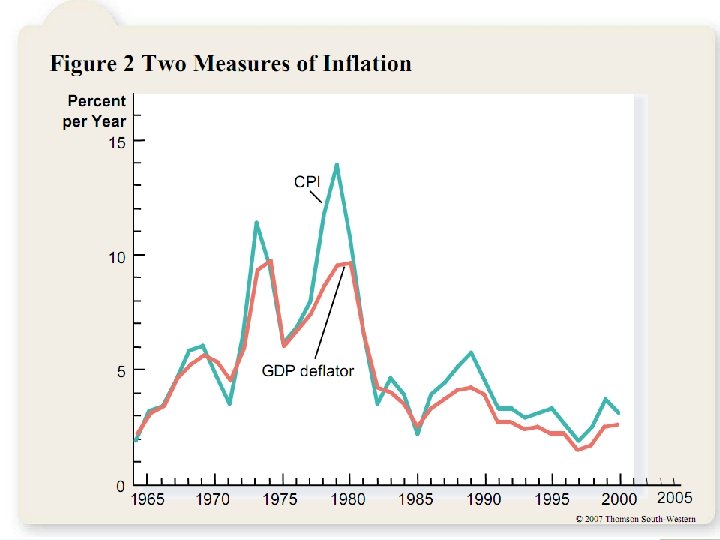
Chapter 8: Unemployment and Inflation Measuring the price level: GDP deflator: Including every final good and service. The broadest measurement! Consumer Price Index: An average of the prices of the goods and services purchased by the typical urban family of four. A market basket of 211 types of goods. Eight Categories. Cost-of-living index. Producer price index: An average of the prices received by producers of goods and services at all stages of the production process. A market basket of intermediate goods and services. © 2008 Prentice Hall Business Publishing Economics R. Glenn Hubbard, Anthony Patrick O’Brien, 2 e. 28 of 36
Learning Objective 8. 4 Measuring Inflation The Consumer Price Index FIGURE 8 -6 Chapter 8: Unemployment and Inflation The CPI Market Basket, December 2006 © 2008 Prentice Hall Business Publishing Economics R. Glenn Hubbard, Anthony Patrick O’Brien, 2 e. 29 of 36
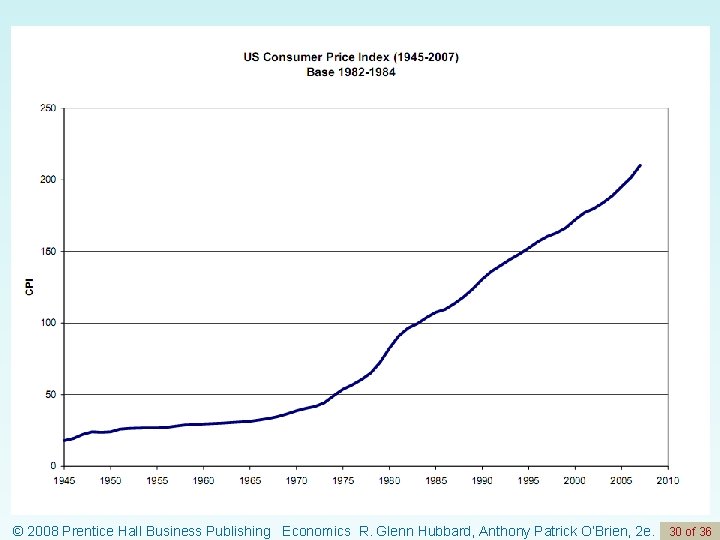
Chapter 8: Unemployment and Inflation © 2008 Prentice Hall Business Publishing Economics R. Glenn Hubbard, Anthony Patrick O’Brien, 2 e. 30 of 36
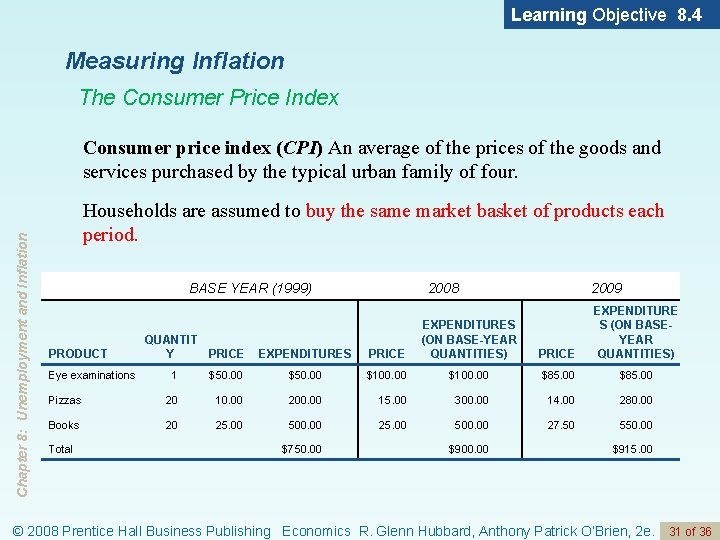
Learning Objective 8. 4 Measuring Inflation The Consumer Price Index Chapter 8: Unemployment and Inflation Consumer price index (CPI) An average of the prices of the goods and services purchased by the typical urban family of four. Households are assumed to buy the same market basket of products each period. BASE YEAR (1999) PRODUCT Eye examinations QUANTIT Y PRICE 2008 EXPENDITURES PRICE EXPENDITURES (ON BASE-YEAR QUANTITIES) 2009 PRICE EXPENDITURE S (ON BASEYEAR QUANTITIES) 1 $50. 00 $100. 00 $85. 00 Pizzas 20 10. 00 200. 00 15. 00 300. 00 14. 00 280. 00 Books 20 25. 00 500. 00 27. 50 550. 00 Total $750. 00 $900. 00 $915. 00 © 2008 Prentice Hall Business Publishing Economics R. Glenn Hubbard, Anthony Patrick O’Brien, 2 e. 31 of 36
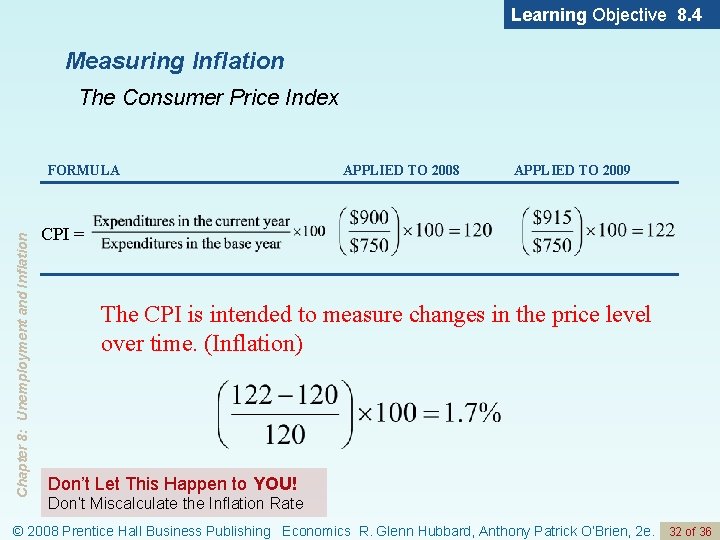
Learning Objective 8. 4 Measuring Inflation The Consumer Price Index Chapter 8: Unemployment and Inflation FORMULA APPLIED TO 2008 APPLIED TO 2009 CPI = The CPI is intended to measure changes in the price level over time. (Inflation) Don’t Let This Happen to YOU! Don’t Miscalculate the Inflation Rate © 2008 Prentice Hall Business Publishing Economics R. Glenn Hubbard, Anthony Patrick O’Brien, 2 e. 32 of 36
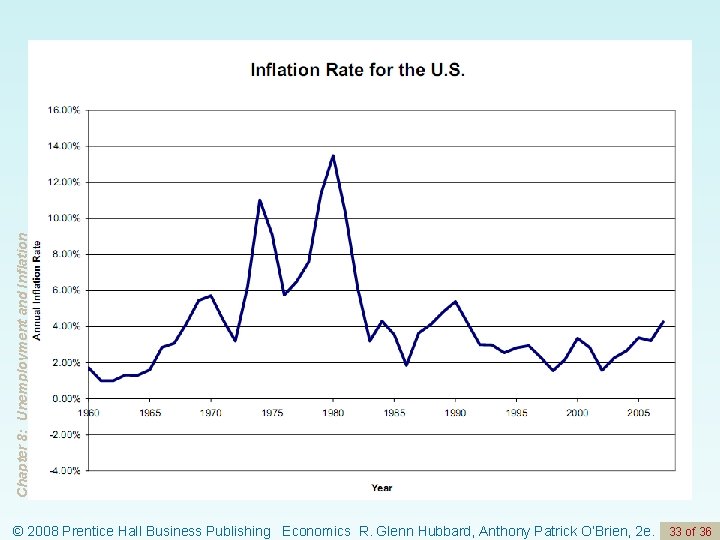
Chapter 8: Unemployment and Inflation © 2008 Prentice Hall Business Publishing Economics R. Glenn Hubbard, Anthony Patrick O’Brien, 2 e. 33 of 36
Chapter 8: Unemployment and Inflation © 2008 Prentice Hall Business Publishing Economics R. Glenn Hubbard, Anthony Patrick O’Brien, 2 e. 34 of 36
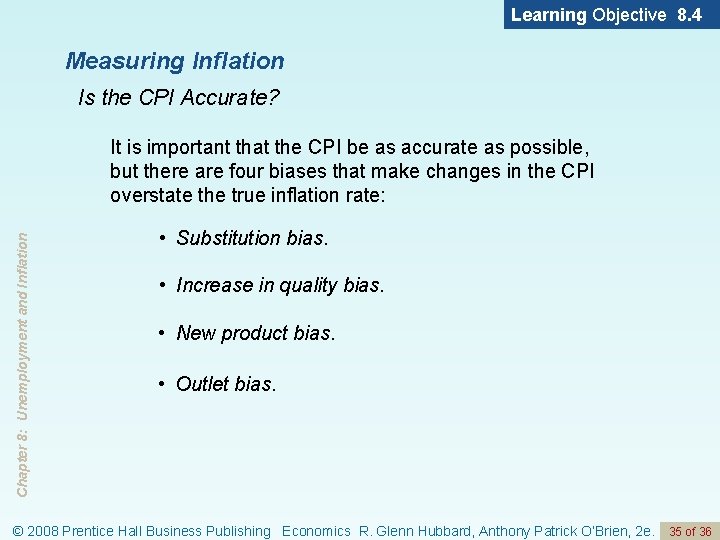
Learning Objective 8. 4 Measuring Inflation Is the CPI Accurate? Chapter 8: Unemployment and Inflation It is important that the CPI be as accurate as possible, but there are four biases that make changes in the CPI overstate the true inflation rate: • Substitution bias. • Increase in quality bias. • New product bias. • Outlet bias. © 2008 Prentice Hall Business Publishing Economics R. Glenn Hubbard, Anthony Patrick O’Brien, 2 e. 35 of 36
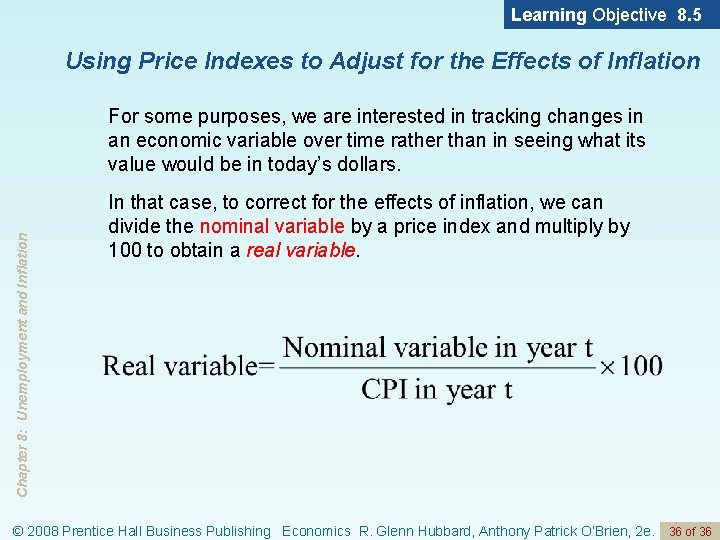
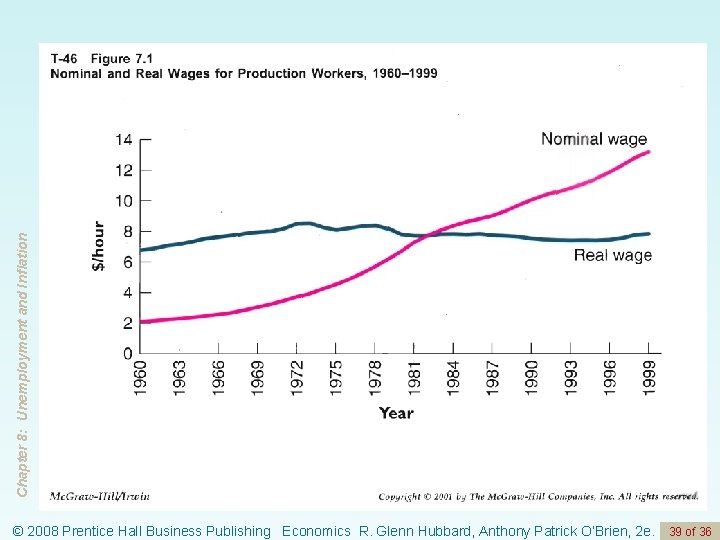
Learning Objective 8. 5 Using Price Indexes to Adjust for the Effects of Inflation Chapter 8: Unemployment and Inflation For some purposes, we are interested in tracking changes in an economic variable over time rather than in seeing what its value would be in today’s dollars. In that case, to correct for the effects of inflation, we can divide the nominal variable by a price index and multiply by 100 to obtain a real variable. © 2008 Prentice Hall Business Publishing Economics R. Glenn Hubbard, Anthony Patrick O’Brien, 2 e. 36 of 36
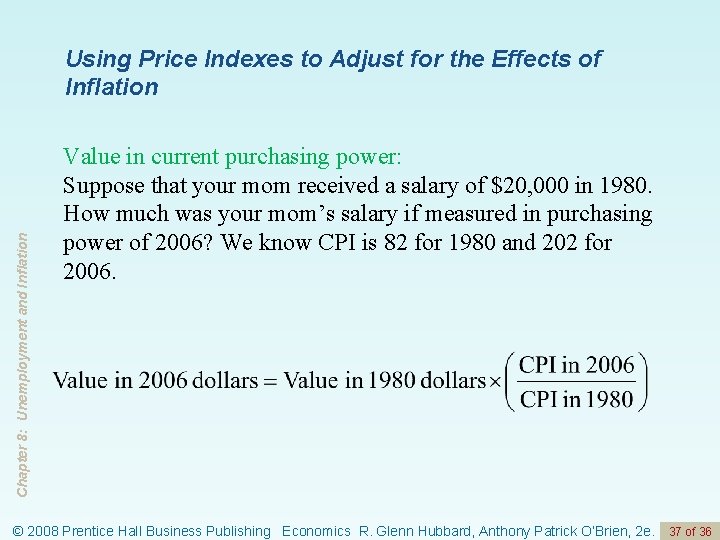
Chapter 8: Unemployment and Inflation Using Price Indexes to Adjust for the Effects of Inflation Value in current purchasing power: Suppose that your mom received a salary of $20, 000 in 1980. How much was your mom’s salary if measured in purchasing power of 2006? We know CPI is 82 for 1980 and 202 for 2006. © 2008 Prentice Hall Business Publishing Economics R. Glenn Hubbard, Anthony Patrick O’Brien, 2 e. 37 of 36
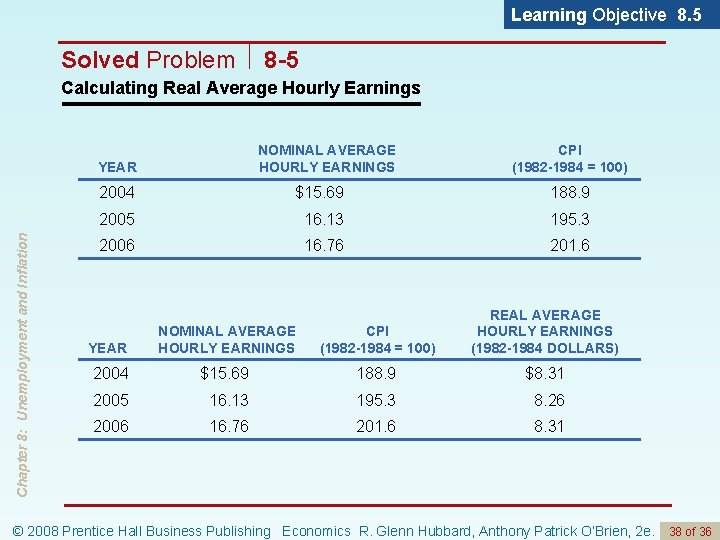
Learning Objective 8. 5 Solved Problem 8 -5 Calculating Real Average Hourly Earnings NOMINAL AVERAGE HOURLY EARNINGS Chapter 8: Unemployment and Inflation YEAR CPI (1982 -1984 = 100) 2004 $15. 69 188. 9 2005 16. 13 195. 3 2006 16. 76 201. 6 YEAR NOMINAL AVERAGE HOURLY EARNINGS CPI (1982 -1984 = 100) REAL AVERAGE HOURLY EARNINGS (1982 -1984 DOLLARS) 2004 $15. 69 188. 9 $8. 31 2005 16. 13 195. 3 8. 26 2006 16. 76 201. 6 8. 31 © 2008 Prentice Hall Business Publishing Economics R. Glenn Hubbard, Anthony Patrick O’Brien, 2 e. 38 of 36
Chapter 8: Unemployment and Inflation © 2008 Prentice Hall Business Publishing Economics R. Glenn Hubbard, Anthony Patrick O’Brien, 2 e. 39 of 36
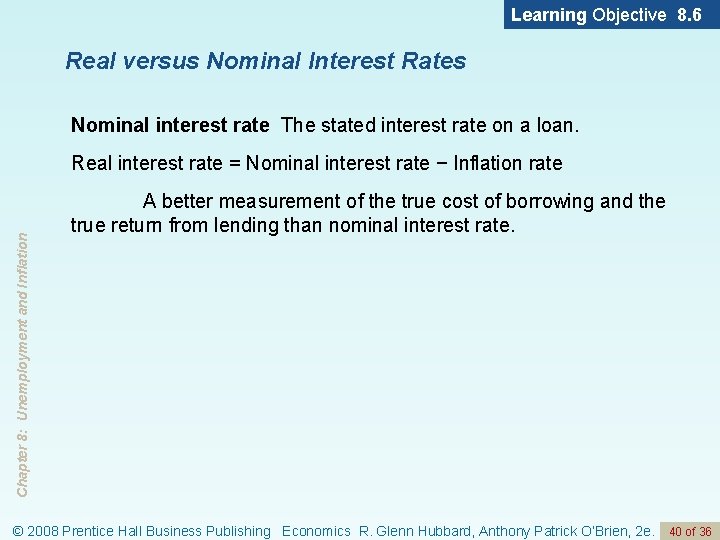
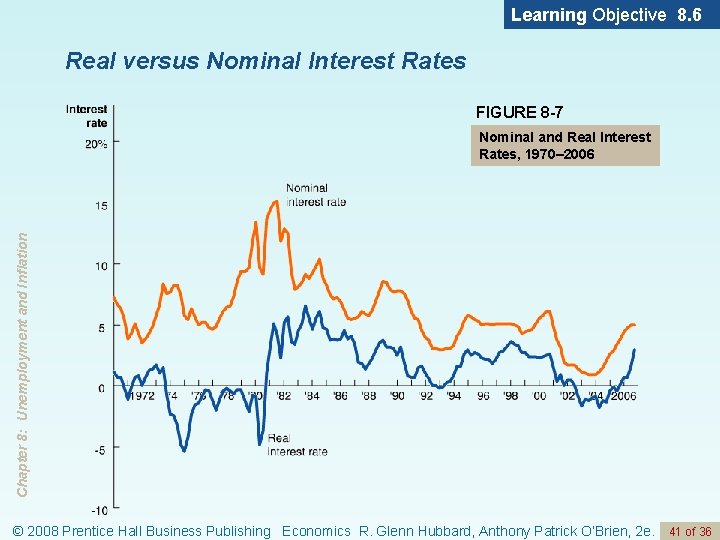
Learning Objective 8. 6 Real versus Nominal Interest Rates Nominal interest rate The stated interest rate on a loan. Chapter 8: Unemployment and Inflation Real interest rate = Nominal interest rate − Inflation rate A better measurement of the true cost of borrowing and the true return from lending than nominal interest rate. © 2008 Prentice Hall Business Publishing Economics R. Glenn Hubbard, Anthony Patrick O’Brien, 2 e. 40 of 36
Learning Objective 8. 6 Real versus Nominal Interest Rates FIGURE 8 -7 Chapter 8: Unemployment and Inflation Nominal and Real Interest Rates, 1970– 2006 © 2008 Prentice Hall Business Publishing Economics R. Glenn Hubbard, Anthony Patrick O’Brien, 2 e. 41 of 36
Learning Objective 8. 7 Does Inflation Impose Costs on the Economy? Inflation Affects the Distribution of Income Chapter 8: Unemployment and Inflation The extent to which inflation redistributes income depends in part on whether the inflation is anticipated—in which case consumers, workers, and firms can see it coming and can prepare for it— or unanticipated—in which case they do not see it coming and do not prepare for it. The Problem with Anticipated Inflation Menu costs The costs to firms of changing prices. The Costs of holding paper money. The Costs for tax payers. © 2008 Prentice Hall Business Publishing Economics R. Glenn Hubbard, Anthony Patrick O’Brien, 2 e. 42 of 36
Chapter 8: Unemployment and Inflation Cost of Inflation • Taxpayers • – People pay taxes on nominal returns, not real returns • – Thus a 33% tax on an investment which yields a 12% return would require one to pay 4% of the return to the government; if the inflation rate is 9%, then the after tax real return on the investment is -1% • – If real returns were taxed instead, then before tax real return of 3% would be taxed 33%: leaving the investor with an after tax real return of 2% • – So people care about whether real, or nominal, returns are taxed, since this affects after tax real returns (which is what people really care about). © 2008 Prentice Hall Business Publishing Economics R. Glenn Hubbard, Anthony Patrick O’Brien, 2 e. 43 of 36
Does Inflation Impose Costs on the Economy? Chapter 8: Unemployment and Inflation The Problem with Unanticipated Inflation An example: Mortgage. © 2008 Prentice Hall Business Publishing Economics R. Glenn Hubbard, Anthony Patrick O’Brien, 2 e. 44 of 36