CHAPTER 3 Strategic and Financial Logistics Pearson Education




- Slides: 38
CHAPTER 3 Strategic and Financial Logistics © Pearson Education, Inc. publishing as Prentice Hall
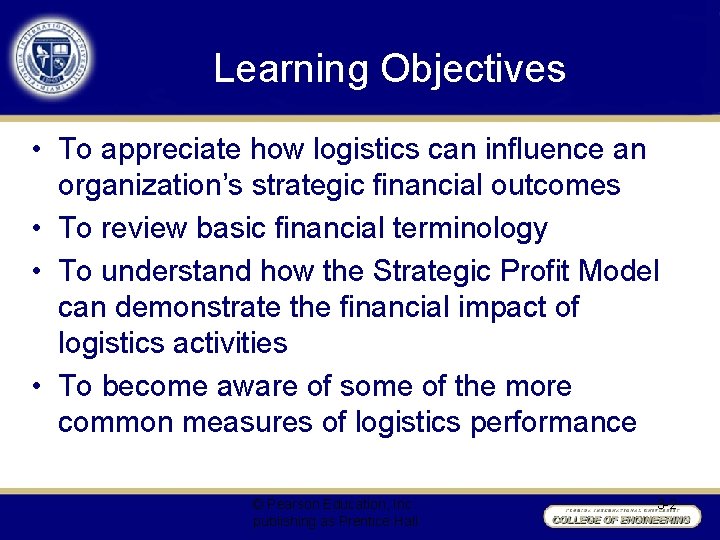
Learning Objectives • To appreciate how logistics can influence an organization’s strategic financial outcomes • To review basic financial terminology • To understand how the Strategic Profit Model can demonstrate the financial impact of logistics activities • To become aware of some of the more common measures of logistics performance © Pearson Education, Inc. publishing as Prentice Hall 3 -2
Strategic and Financial Logistics Key Terms • Assets • Cost leadership strategy • Asset turnover • Balanced scorecard • Differentiation strategy (BSC) • Expenses (costs) • Balance sheet • Focus strategy © Pearson Education, Inc. publishing as Prentice Hall 3 -3
Strategic and Financial Logistics Key Terms • • Income statement Liabilities Net profit margin Owner’s equity • Return on assets (ROA) • Revenues (sales) • Strategic Profit Model (SPM) © Pearson Education, Inc. publishing as Prentice Hall 3 -4
Connecting Strategy to Financial Performance • Logistics managers must find ways to: – communicate how logistics capabilities provide value – support corporate strategy and success in financial terms. • Logistics resides at the functional level of the organization. • Functional units must translate corporate and business unit strategies into discrete action plans. © Pearson Education, Inc. publishing as Prentice Hall 3 -5
Connecting Strategy to Financial Performance • Three generic strategies that can be pursued by an organization – Cost leadership strategy – Differentiation strategy – Focus strategy © Pearson Education, Inc. publishing as Prentice Hall 3 -6
Connecting Strategy to Financial Performance • Functional level strategies exist in: – Marketing – Finance – Manufacturing – Logistics © Pearson Education, Inc. publishing as Prentice Hall 3 -7
Connecting Strategy to Financial Performance • Logistic strategy decisions involve: – Determining the number and location of warehouses – Selecting appropriate transportation modes – Deploying inventory – Investments in technology that support logistics activities © Pearson Education, Inc. publishing as Prentice Hall 3 -8
Connecting Strategy to Financial Performance • Logistics strategy is directly influenced by strategic decisions in functional areas of: – Marketing • Product availability, desired customer service levels, and packaging design directly influence logistics decisions – Manufacturing • Strategic decisions by manufacturing to implement just-in-time system would influence logistics decisions in warehousing, transportation and inventory management © Pearson Education, Inc. publishing as Prentice Hall 3 -9
Connecting Strategy to Financial Performance • Logistics function can positively affect the financial outcome of an organization by designing a strategy to optimally support the requirement of the business. © Pearson Education, Inc. publishing as Prentice Hall 3 -10
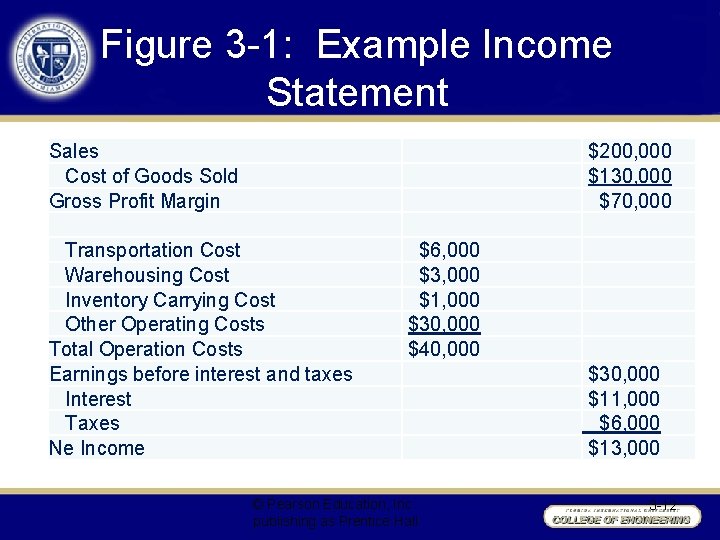
Basic Financial Terminology • Income statement shows for a period of time: – Revenues – Expenses – Profit • Also referred to as a profit and loss (P&L) statement © Pearson Education, Inc. publishing as Prentice Hall 3 -11
Figure 3 -1: Example Income Statement Sales Cost of Goods Sold Gross Profit Margin $200, 000 $130, 000 $70, 000 Transportation Cost Warehousing Cost Inventory Carrying Cost Other Operating Costs Total Operation Costs Earnings before interest and taxes Interest Taxes Ne Income $6, 000 $3, 000 $1, 000 $30, 000 $40, 000 © Pearson Education, Inc. publishing as Prentice Hall $30, 000 $11, 000 $6, 000 $13, 000 3 -12
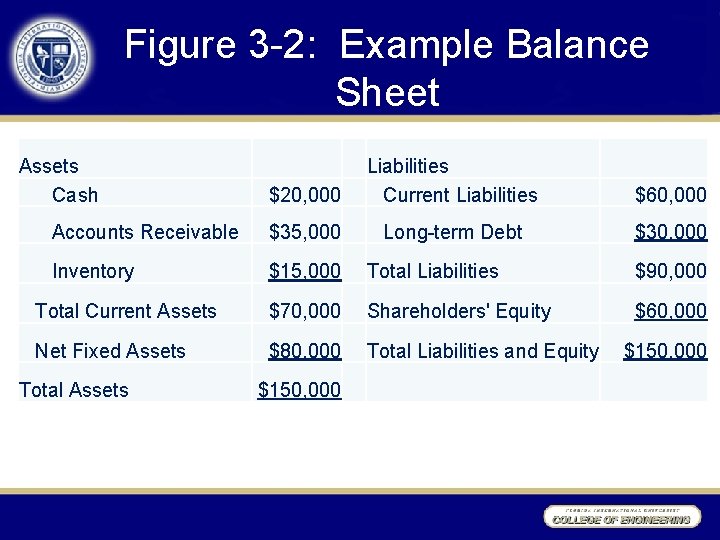
Basic Financial Terminology • Balance sheet reflects at any given point in time: – Assets – Liabilities – Owner’s equity © Pearson Education, Inc. publishing as Prentice Hall 3 -13
Figure 3 -2: Example Balance Sheet Assets Cash Liabilities $20, 000 Current Liabilities $60, 000 Accounts Receivable $35, 000 Long-term Debt $30, 000 Inventory $15, 000 Total Liabilities $90, 000 Total Current Assets $70, 000 Shareholders' Equity $60, 000 Net Fixed Assets $80, 000 Total Liabilities and Equity Total Assets $150, 000
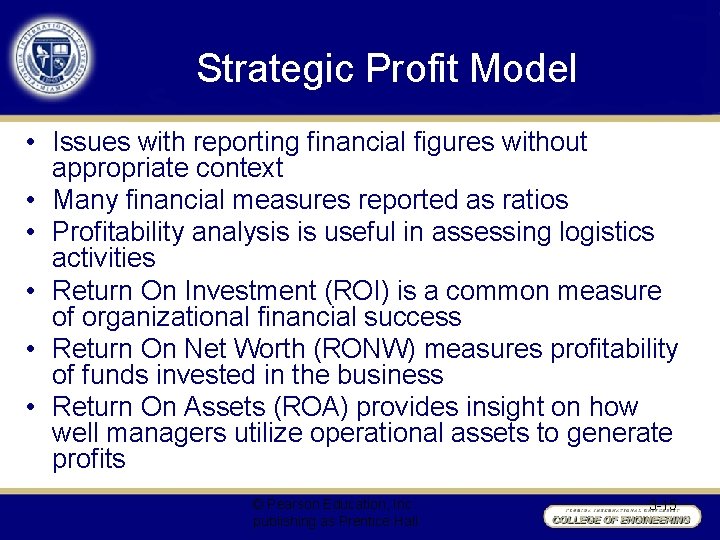
Strategic Profit Model • Issues with reporting financial figures without appropriate context • Many financial measures reported as ratios • Profitability analysis is useful in assessing logistics activities • Return On Investment (ROI) is a common measure of organizational financial success • Return On Net Worth (RONW) measures profitability of funds invested in the business • Return On Assets (ROA) provides insight on how well managers utilize operational assets to generate profits © Pearson Education, Inc. publishing as Prentice Hall 3 -15
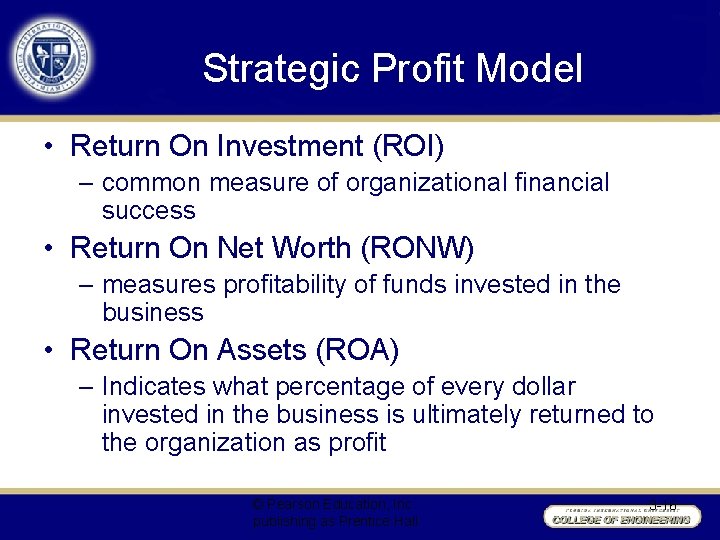
Strategic Profit Model • Return On Investment (ROI) – common measure of organizational financial success • Return On Net Worth (RONW) – measures profitability of funds invested in the business • Return On Assets (ROA) – Indicates what percentage of every dollar invested in the business is ultimately returned to the organization as profit © Pearson Education, Inc. publishing as Prentice Hall 3 -16
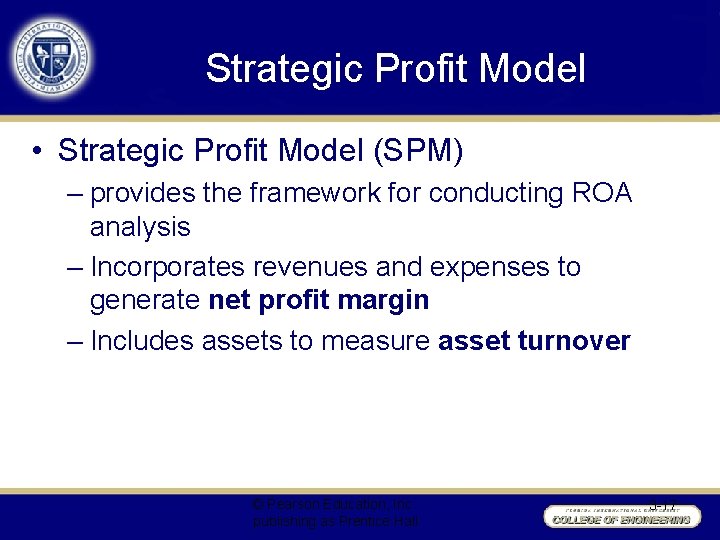
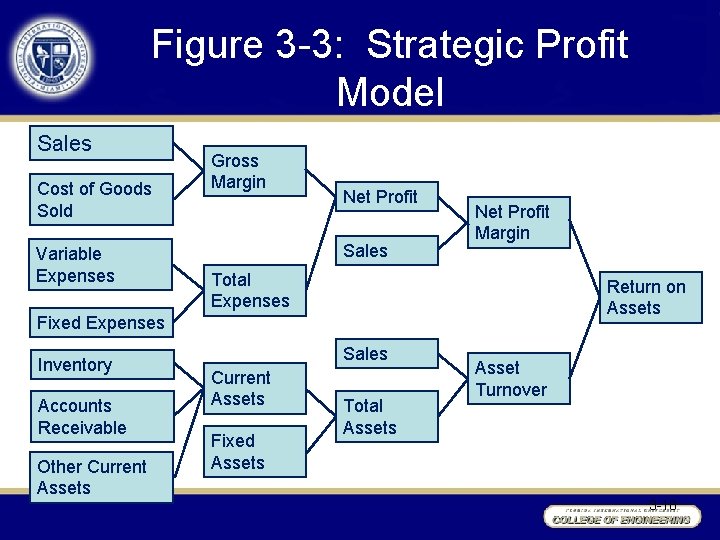
Strategic Profit Model • Strategic Profit Model (SPM) – provides the framework for conducting ROA analysis – Incorporates revenues and expenses to generate net profit margin – Includes assets to measure asset turnover © Pearson Education, Inc. publishing as Prentice Hall 3 -17
Figure 3 -3: Strategic Profit Model Sales Cost of Goods Sold Variable Expenses Gross Margin Net Profit Sales Net Profit Margin Total Expenses Return on Assets Fixed Expenses Inventory Accounts Receivable Other Current Assets Sales Current Assets Fixed Assets Total Assets Asset Turnover 3 -18
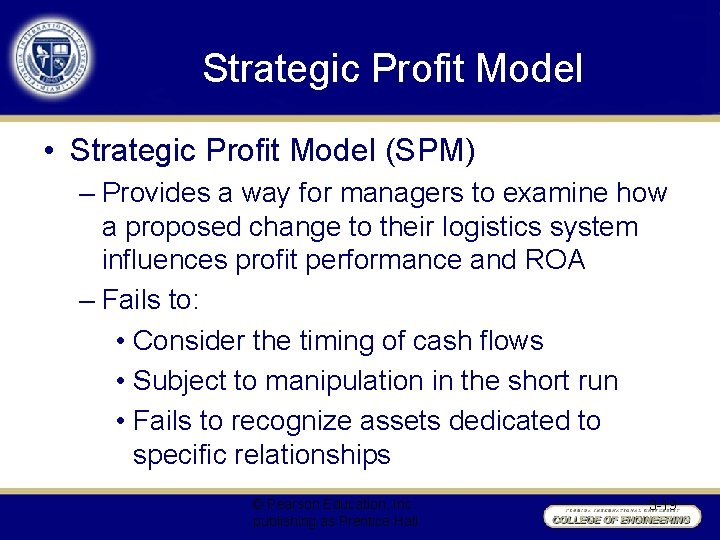
Strategic Profit Model • Strategic Profit Model (SPM) – Provides a way for managers to examine how a proposed change to their logistics system influences profit performance and ROA – Fails to: • Consider the timing of cash flows • Subject to manipulation in the short run • Fails to recognize assets dedicated to specific relationships © Pearson Education, Inc. publishing as Prentice Hall 3 -19
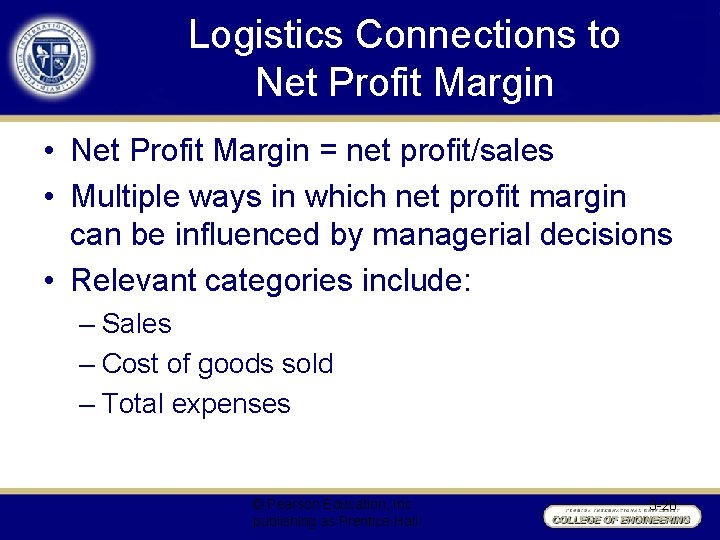
Logistics Connections to Net Profit Margin • Net Profit Margin = net profit/sales • Multiple ways in which net profit margin can be influenced by managerial decisions • Relevant categories include: – Sales – Cost of goods sold – Total expenses © Pearson Education, Inc. publishing as Prentice Hall 3 -20
Logistics Connections to Asset Turnover • Asset turnover= total sales/total assets • Inventory is the most relevant logistics asset • Logistics decisions can influence speed at which invoices are paid – accounts receivable © Pearson Education, Inc. publishing as Prentice Hall 3 -21
Balanced Scorecard • Balance scorecard (BSC) is a strategic planning and performance management system used in industry, government, and nonprofit organizations. © Pearson Education, Inc. publishing as Prentice Hall 3 -22
Balanced Scorecard • Management should evaluate their businesses from four perspectives – Customers – Internal business processes – Learning and growth – Financial • Forces managers to look beyond traditional financial measures (more holistic approach) © Pearson Education, Inc. publishing as Prentice Hall 3 -23
Common Logistics Measures 5 types of performance in Logistics Management Systems: • Asset management • Cost • Customer service • Productivity • Logistics quality © Pearson Education, Inc. publishing as Prentice Hall 3 -24
Common Logistics Measures • • Transportation Warehousing Inventory Design and implementation of measures © Pearson Education, Inc. publishing as Prentice Hall 3 -25
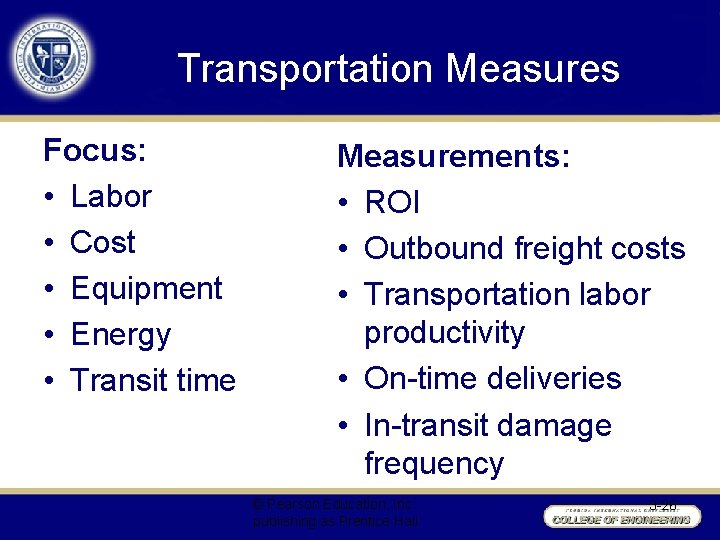
Transportation Measures Focus: • Labor • Cost • Equipment • Energy • Transit time Measurements: • ROI • Outbound freight costs • Transportation labor productivity • On-time deliveries • In-transit damage frequency © Pearson Education, Inc. publishing as Prentice Hall 3 -26
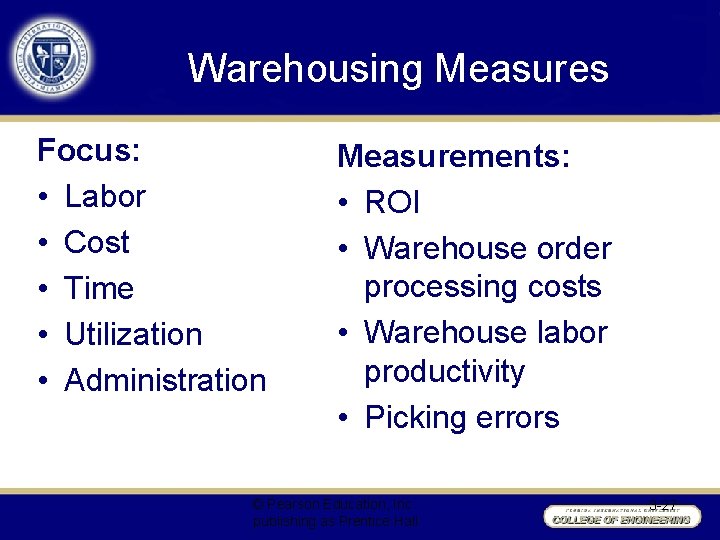
Warehousing Measures Focus: • Labor • Cost • Time • Utilization • Administration Measurements: • ROI • Warehouse order processing costs • Warehouse labor productivity • Picking errors © Pearson Education, Inc. publishing as Prentice Hall 3 -27
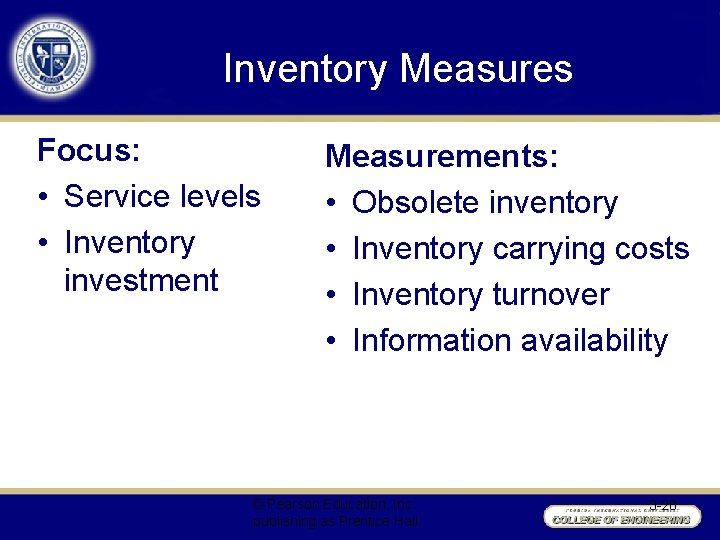
Inventory Measures Focus: • Service levels • Inventory investment Measurements: • Obsolete inventory • Inventory carrying costs • Inventory turnover • Information availability © Pearson Education, Inc. publishing as Prentice Hall 3 -28
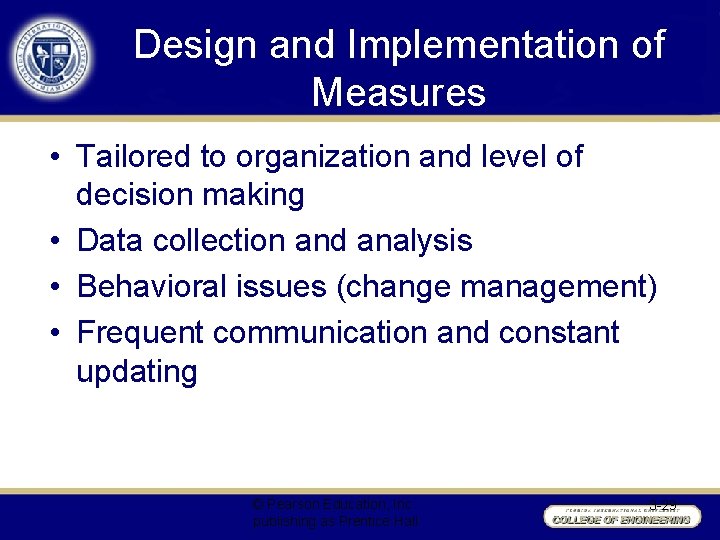
Design and Implementation of Measures • Tailored to organization and level of decision making • Data collection and analysis • Behavioral issues (change management) • Frequent communication and constant updating © Pearson Education, Inc. publishing as Prentice Hall 3 -29
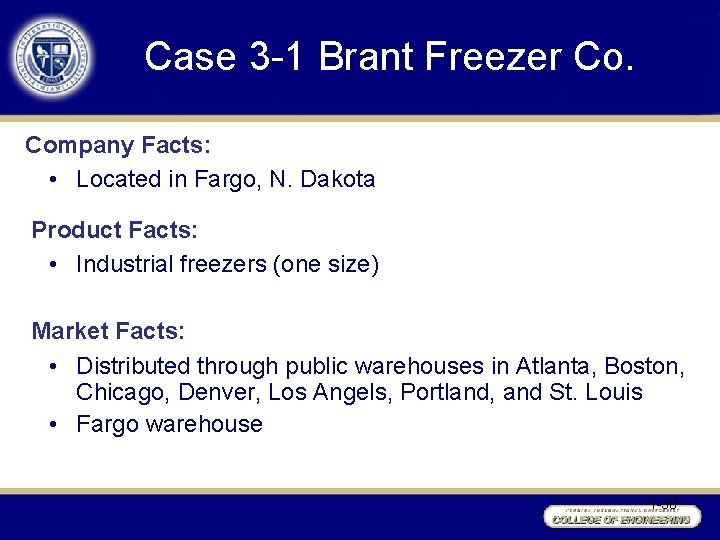
Case 3 -1 Brant Freezer Co. Company Facts: • Located in Fargo, N. Dakota Product Facts: • Industrial freezers (one size) Market Facts: • Distributed through public warehouses in Atlanta, Boston, Chicago, Denver, Los Angels, Portland, and St. Louis • Fargo warehouse 1 -30
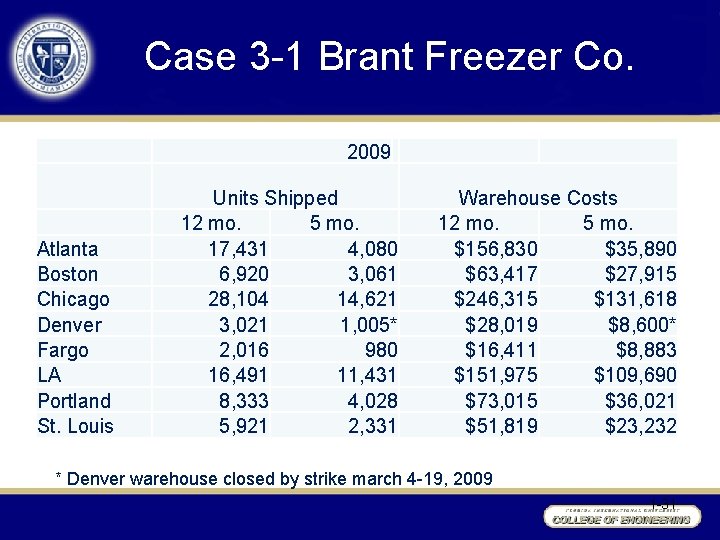
Case 3 -1 Brant Freezer Co. 2009 Atlanta Boston Chicago Denver Fargo LA Portland St. Louis Units Shipped 12 mo. 5 mo. 17, 431 4, 080 6, 920 3, 061 28, 104 14, 621 3, 021 1, 005* 2, 016 980 16, 491 11, 431 8, 333 4, 028 5, 921 2, 331 Warehouse Costs 12 mo. 5 mo. $156, 830 $35, 890 $63, 417 $27, 915 $246, 315 $131, 618 $28, 019 $8, 600* $16, 411 $8, 883 $151, 975 $109, 690 $73, 015 $36, 021 $51, 819 $23, 232 * Denver warehouse closed by strike march 4 -19, 2009 1 -31
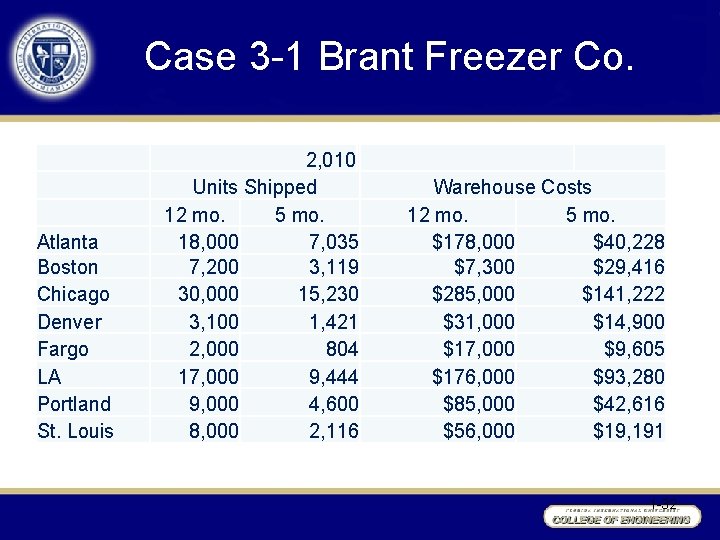
Case 3 -1 Brant Freezer Co. Atlanta Boston Chicago Denver Fargo LA Portland St. Louis 2, 010 Units Shipped 12 mo. 5 mo. 18, 000 7, 035 7, 200 3, 119 30, 000 15, 230 3, 100 1, 421 2, 000 804 17, 000 9, 444 9, 000 4, 600 8, 000 2, 116 Warehouse Costs 12 mo. 5 mo. $178, 000 $40, 228 $7, 300 $29, 416 $285, 000 $141, 222 $31, 000 $14, 900 $17, 000 $9, 605 $176, 000 $93, 280 $85, 000 $42, 616 $56, 000 $19, 191 1 -32
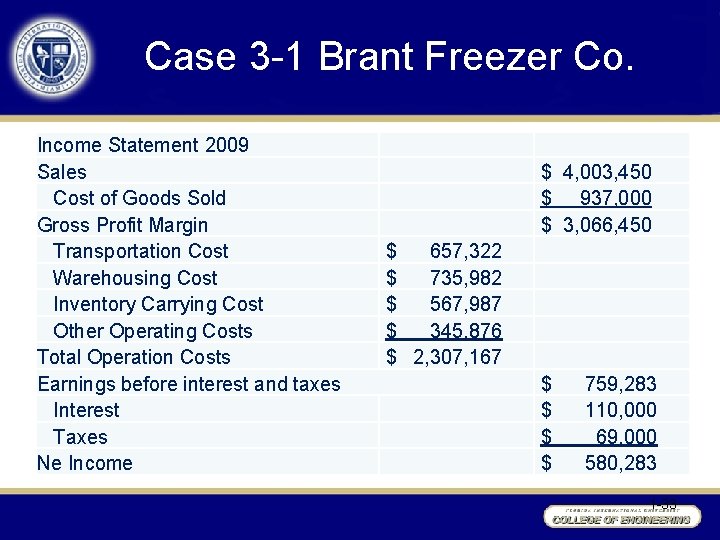
Case 3 -1 Brant Freezer Co. Income Statement 2009 Sales Cost of Goods Sold Gross Profit Margin Transportation Cost Warehousing Cost Inventory Carrying Cost Other Operating Costs Total Operation Costs Earnings before interest and taxes Interest Taxes Ne Income $ 4, 003, 450 $ 937, 000 $ 3, 066, 450 $ 657, 322 $ 735, 982 $ 567, 987 $ 345, 876 $ 2, 307, 167 $ 759, 283 $ 110, 000 $ 69, 000 $ 580, 283 1 -33
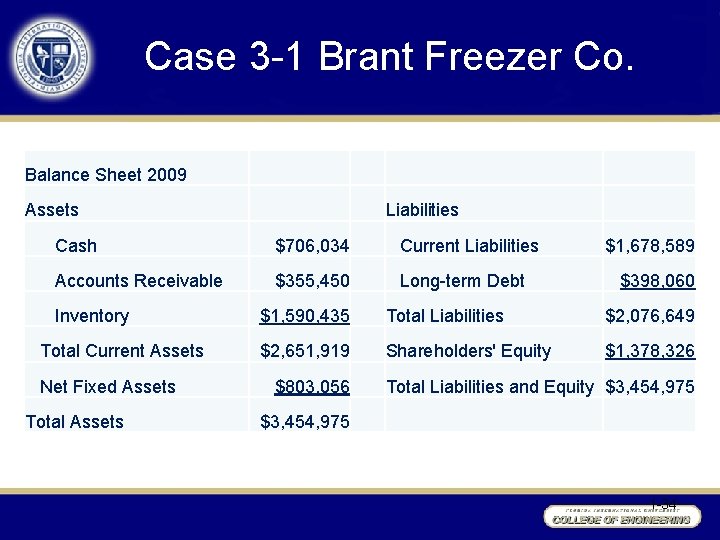
Case 3 -1 Brant Freezer Co. Balance Sheet 2009 Assets Liabilities Cash $706, 034 Current Liabilities Accounts Receivable $355, 450 Long-term Debt $1, 678, 589 $398, 060 Inventory $1, 590, 435 Total Liabilities $2, 076, 649 Total Current Assets $2, 651, 919 Shareholders' Equity $1, 378, 326 Net Fixed Assets Total Assets $803, 056 Total Liabilities and Equity $3, 454, 975 1 -34
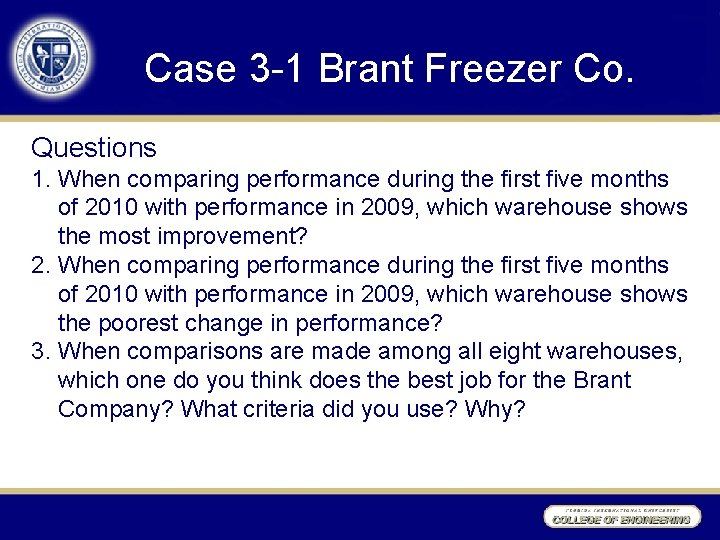
Case 3 -1 Brant Freezer Co. Questions 1. When comparing performance during the first five months of 2010 with performance in 2009, which warehouse shows the most improvement? 2. When comparing performance during the first five months of 2010 with performance in 2009, which warehouse shows the poorest change in performance? 3. When comparisons are made among all eight warehouses, which one do you think does the best job for the Brant Company? What criteria did you use? Why?
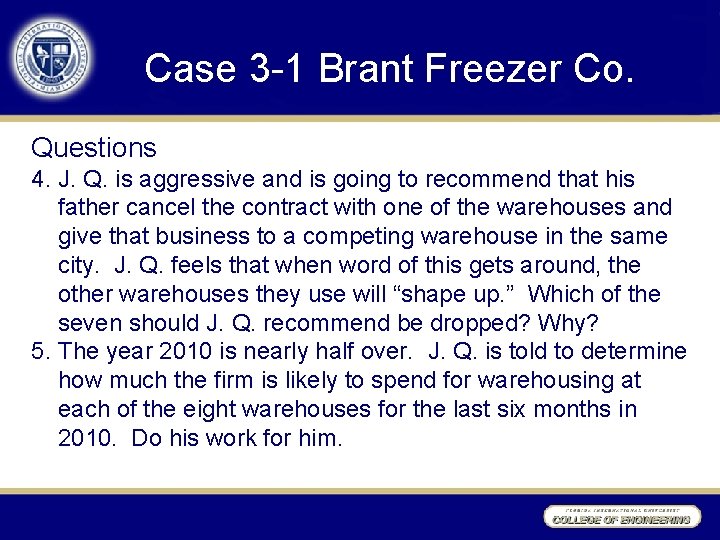
Case 3 -1 Brant Freezer Co. Questions 4. J. Q. is aggressive and is going to recommend that his father cancel the contract with one of the warehouses and give that business to a competing warehouse in the same city. J. Q. feels that when word of this gets around, the other warehouses they use will “shape up. ” Which of the seven should J. Q. recommend be dropped? Why? 5. The year 2010 is nearly half over. J. Q. is told to determine how much the firm is likely to spend for warehousing at each of the eight warehouses for the last six months in 2010. Do his work for him.
Case 3 -1 Brant Freezer Co. Questions 6. When comparing the 2009 figures with the 2010 figures shown in the table, the amount budgeted for each warehouse in 2010 was greater than actual 2009 costs. How much of the increase is caused by increased volume of business (units shipped) and how much by inflation? 7. Use the 2009 income statement and balance sheet to complete a Strategic Profit Model for J. Q. 8. Holding all other information constant, what would be the effect on ROA for 2010 if warehousing costs declined 10 percent from 2009 levels?