Chapter 2 Data of Macroeconomics Mentor Pham Xuan

- Slides: 27
Chapter 2 Data of Macroeconomics Mentor Pham Xuan Truong truongpx@ftu. edu. vn
Content I National income - Gross domestic products (GDP) 1 Definition 2 Methods of computing GDP 3 Other measurements of national income 4 Nominal GDP, real GDP and GDP deflator 5 GDP and net economic welfare II Cost of living - Consumer price index (CPI) 1 Definition 2 Method of computing CPI 3 Problems in measuring CPI 4 CPI versus GDP deflator 5 Apply CPI in practice
I Gross domestic products (GDP) 1 Definition Gross Domestic Product (GDP) is the market value of all final goods and services produced within an economy in a given period of time. Concepts must be noticed - Market value: reflect the value of the goods - of all: all items produced in the economy and sold legally in markets excluding most items produced and sold illicitly or produced and consumed at home - Final goods and services: Value of intermediate goods is already included in the prices of the final goods - Produced within an economy: Goods and services produced domestically, regardless of the nationality of
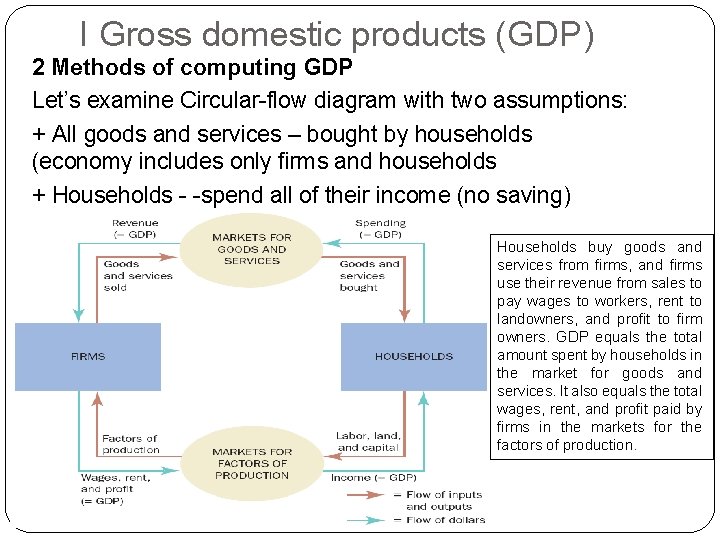
I Gross domestic products (GDP) 2 Methods of computing GDP Let’s examine Circular-flow diagram with two assumptions: + All goods and services – bought by households (economy includes only firms and households + Households - -spend all of their income (no saving) Households buy goods and services from firms, and firms use their revenue from sales to pay wages to workers, rent to landowners, and profit to firm owners. GDP equals the total amount spent by households in the market for goods and services. It also equals the total wages, rent, and profit paid by firms in the markets for the factors of production.
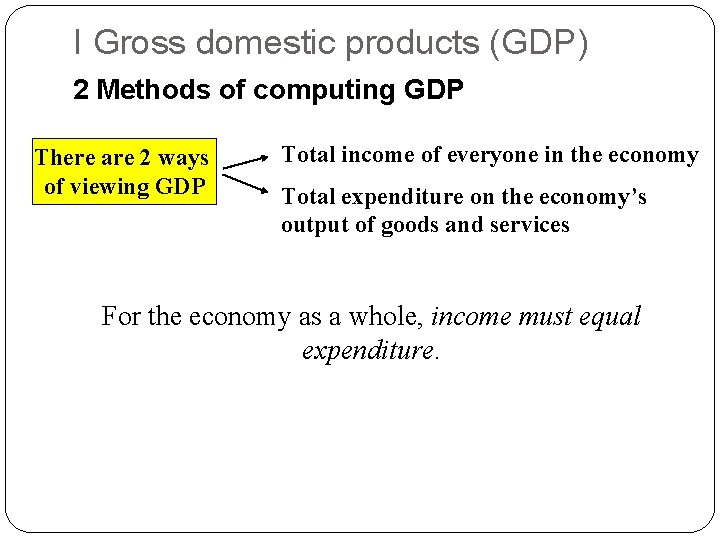
I Gross domestic products (GDP) 2 Methods of computing GDP There are 2 ways of viewing GDP Total income of everyone in the economy Total expenditure on the economy’s output of goods and services For the economy as a whole, income must equal expenditure.
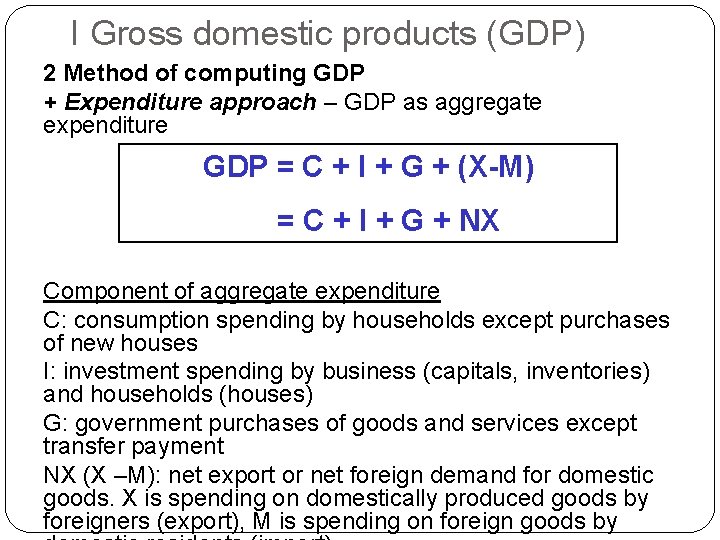
I Gross domestic products (GDP) 2 Method of computing GDP + Expenditure approach – GDP as aggregate expenditure GDP = C + I + G + (X-M) = C + I + G + NX Component of aggregate expenditure C: consumption spending by households except purchases of new houses I: investment spending by business (capitals, inventories) and households (houses) G: government purchases of goods and services except transfer payment NX (X –M): net export or net foreign demand for domestic goods. X is spending on domestically produced goods by foreigners (export), M is spending on foreign goods by
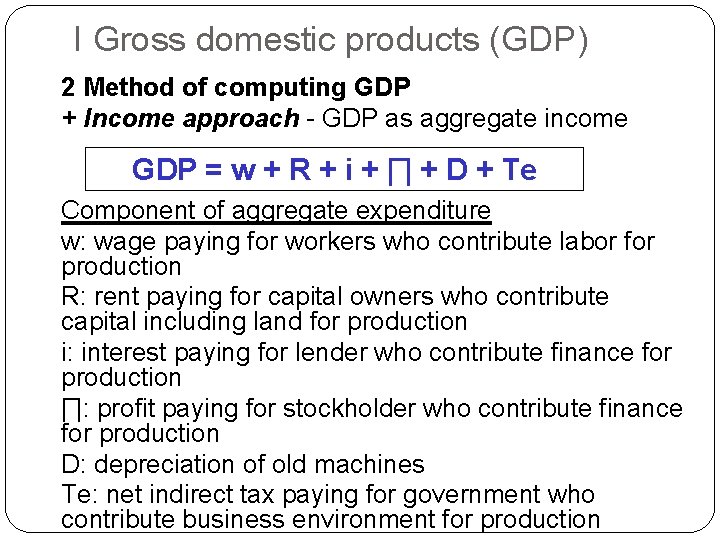
I Gross domestic products (GDP) 2 Method of computing GDP + Income approach - GDP as aggregate income GDP = w + R + i + ∏ + D + Te Component of aggregate expenditure w: wage paying for workers who contribute labor for production R: rent paying for capital owners who contribute capital including land for production i: interest paying for lender who contribute finance for production ∏: profit paying for stockholder who contribute finance for production D: depreciation of old machines Te: net indirect tax paying for government who contribute business environment for production
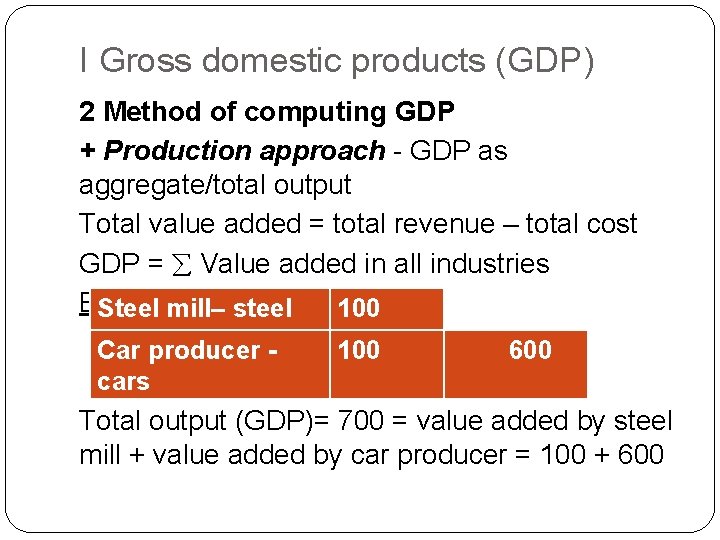
I Gross domestic products (GDP) 2 Method of computing GDP + Production approach - GDP as aggregate/total output Total value added = total revenue – total cost GDP = Value added in all industries Example Steel mill– steel 100 products Car producer cars 100 600 Total output (GDP)= 700 = value added by steel mill + value added by car producer = 100 + 600
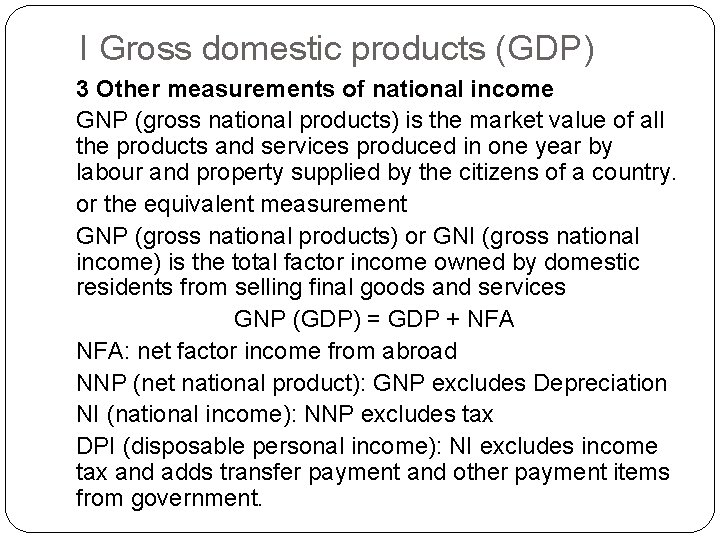
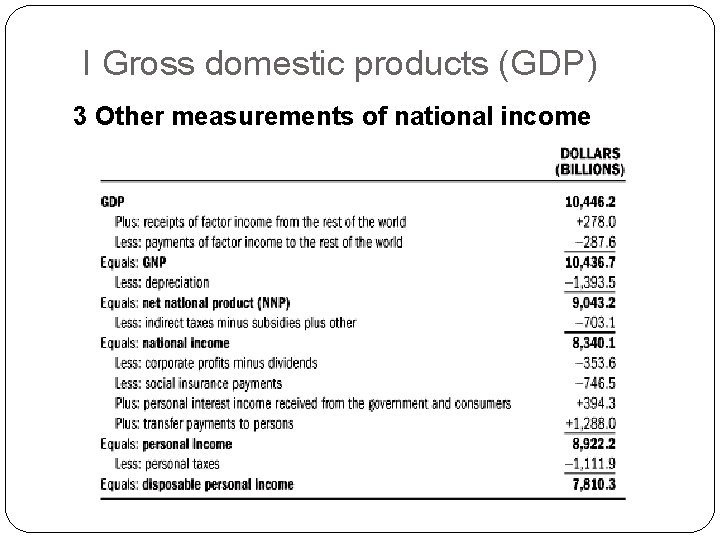
I Gross domestic products (GDP) 3 Other measurements of national income GNP (gross national products) is the market value of all the products and services produced in one year by labour and property supplied by the citizens of a country. or the equivalent measurement GNP (gross national products) or GNI (gross national income) is the total factor income owned by domestic residents from selling final goods and services GNP (GDP) = GDP + NFA: net factor income from abroad NNP (net national product): GNP excludes Depreciation NI (national income): NNP excludes tax DPI (disposable personal income): NI excludes income tax and adds transfer payment and other payment items from government.
I Gross domestic products (GDP) 3 Other measurements of national income
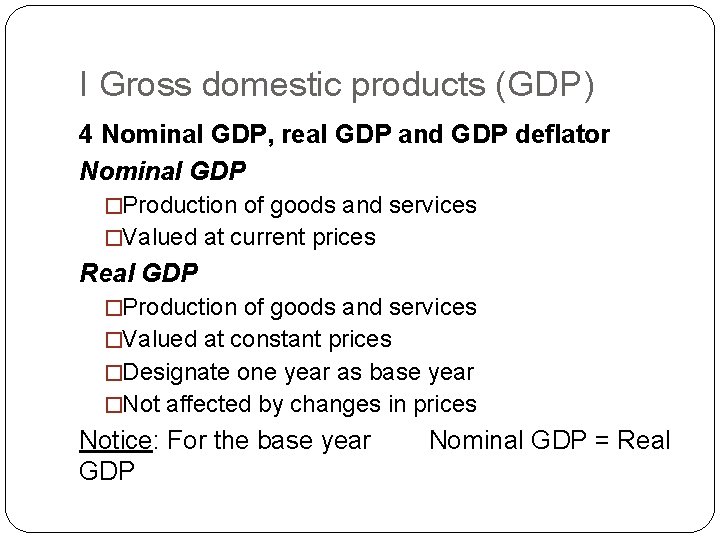
I Gross domestic products (GDP) 4 Nominal GDP, real GDP and GDP deflator Total spending rises from one year to the next + Economy - producing a larger output of goods and services + And/or goods and services are being sold at higher prices Nominal GDP reflects both changes of output and price, whereas real GDP only reflect change of output
I Gross domestic products (GDP) 4 Nominal GDP, real GDP and GDP deflator Nominal GDP �Production of goods and services �Valued at current prices Real GDP �Production of goods and services �Valued at constant prices �Designate one year as base year �Not affected by changes in prices Notice: For the base year GDP Nominal GDP = Real
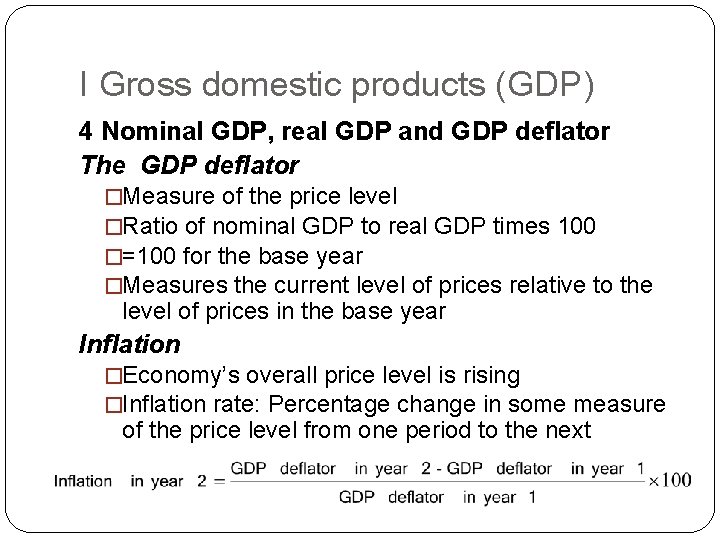
I Gross domestic products (GDP) 4 Nominal GDP, real GDP and GDP deflator The GDP deflator �Measure of the price level �Ratio of nominal GDP to real GDP times 100 �=100 for the base year �Measures the current level of prices relative to the level of prices in the base year Inflation �Economy’s overall price level is rising �Inflation rate: Percentage change in some measure of the price level from one period to the next
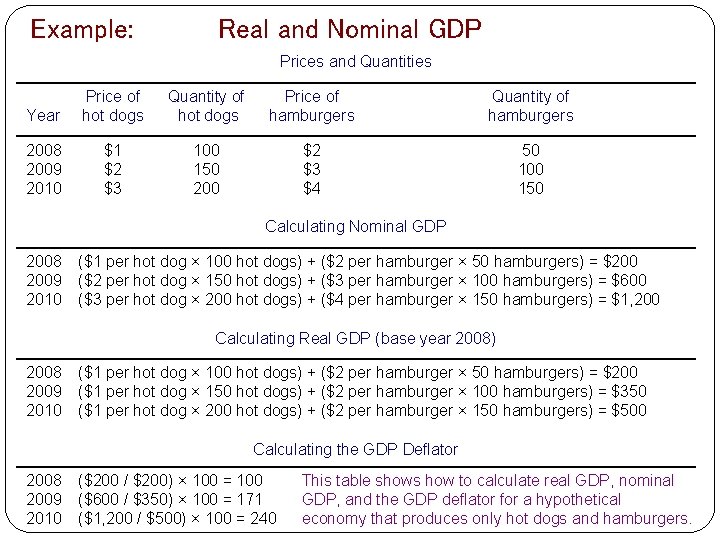
Example: Real and Nominal GDP Prices and Quantities Year Price of hot dogs Quantity of hot dogs Price of hamburgers Quantity of hamburgers 2008 2009 2010 $1 $2 $3 100 150 200 $2 $3 $4 50 100 150 Calculating Nominal GDP 2008 2009 2010 ($1 per hot dog × 100 hot dogs) + ($2 per hamburger × 50 hamburgers) = $200 ($2 per hot dog × 150 hot dogs) + ($3 per hamburger × 100 hamburgers) = $600 ($3 per hot dog × 200 hot dogs) + ($4 per hamburger × 150 hamburgers) = $1, 200 Calculating Real GDP (base year 2008) 2008 2009 2010 ($1 per hot dog × 100 hot dogs) + ($2 per hamburger × 50 hamburgers) = $200 ($1 per hot dog × 150 hot dogs) + ($2 per hamburger × 100 hamburgers) = $350 ($1 per hot dog × 200 hot dogs) + ($2 per hamburger × 150 hamburgers) = $500 Calculating the GDP Deflator 2008 2009 2010 ($200 / $200) × 100 = 100 ($600 / $350) × 100 = 171 ($1, 200 / $500) × 100 = 240 This table shows how to calculate real GDP, nominal GDP, and the GDP deflator for a hypothetical economy that produces only hot dogs and hamburgers.
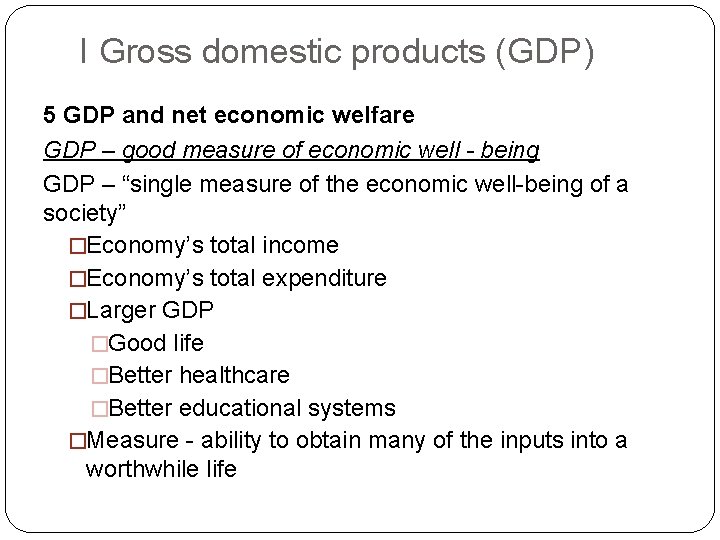
I Gross domestic products (GDP) 5 GDP and net economic welfare GDP – good measure of economic well - being GDP – “single measure of the economic well-being of a society” �Economy’s total income �Economy’s total expenditure �Larger GDP �Good life �Better healthcare �Better educational systems �Measure - ability to obtain many of the inputs into a worthwhile life
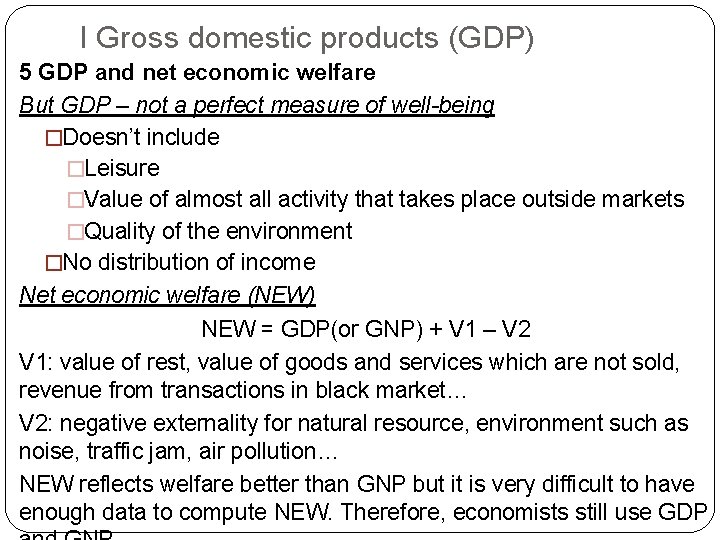
I Gross domestic products (GDP) 5 GDP and net economic welfare But GDP – not a perfect measure of well-being �Doesn’t include �Leisure �Value of almost all activity that takes place outside markets �Quality of the environment �No distribution of income Net economic welfare (NEW) NEW = GDP(or GNP) + V 1 – V 2 V 1: value of rest, value of goods and services which are not sold, revenue from transactions in black market… V 2: negative externality for natural resource, environment such as noise, traffic jam, air pollution… NEW reflects welfare better than GNP but it is very difficult to have enough data to compute NEW. Therefore, economists still use GDP
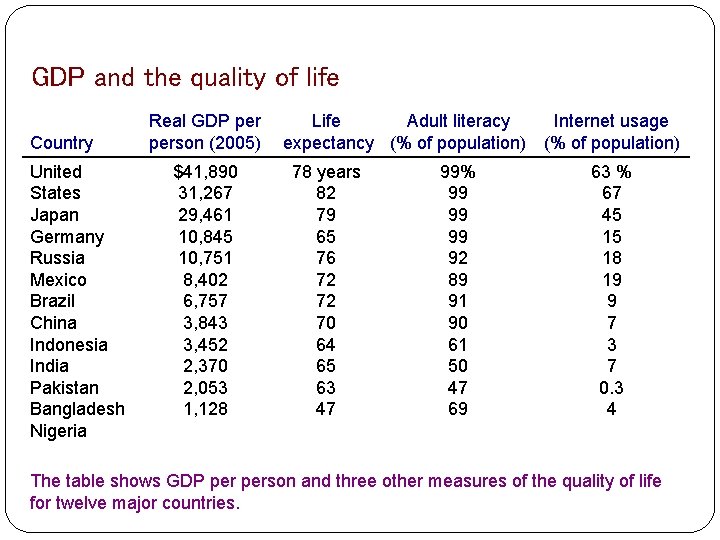
GDP and the quality of life Country United States Japan Germany Russia Mexico Brazil China Indonesia India Pakistan Bangladesh Nigeria Real GDP person (2005) $41, 890 31, 267 29, 461 10, 845 10, 751 8, 402 6, 757 3, 843 3, 452 2, 370 2, 053 1, 128 Life Adult literacy Internet usage expectancy (% of population) 78 years 82 79 65 76 72 72 70 64 65 63 47 99% 99 99 99 92 89 91 90 61 50 47 69 63 % 67 45 15 18 19 9 7 3 7 0. 3 4 The table shows GDP person and three other measures of the quality of life for twelve major countries.
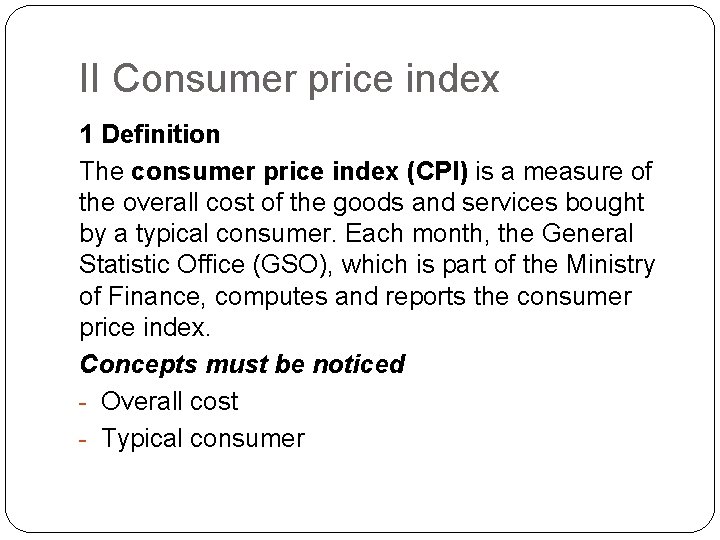
II Consumer price index 1 Definition The consumer price index (CPI) is a measure of the overall cost of the goods and services bought by a typical consumer. Each month, the General Statistic Office (GSO), which is part of the Ministry of Finance, computes and reports the consumer price index. Concepts must be noticed - Overall cost - Typical consumer
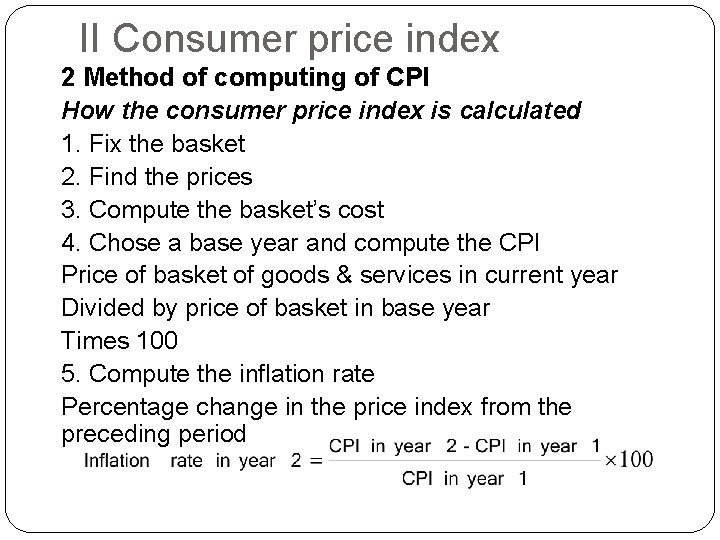
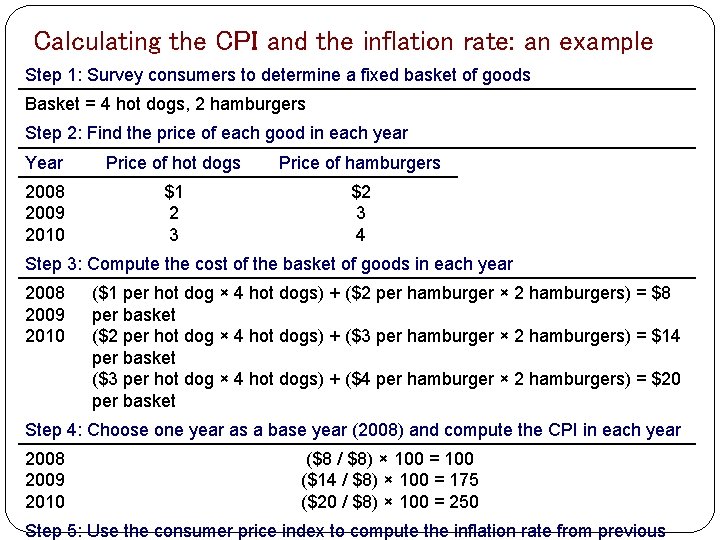
II Consumer price index 2 Method of computing of CPI How the consumer price index is calculated 1. Fix the basket 2. Find the prices 3. Compute the basket’s cost 4. Chose a base year and compute the CPI Price of basket of goods & services in current year Divided by price of basket in base year Times 100 5. Compute the inflation rate Percentage change in the price index from the preceding period
Calculating the CPI and the inflation rate: an example Step 1: Survey consumers to determine a fixed basket of goods Basket = 4 hot dogs, 2 hamburgers Step 2: Find the price of each good in each year Year Price of hot dogs Price of hamburgers 2008 2009 2010 $1 2 3 $2 3 4 Step 3: Compute the cost of the basket of goods in each year 2008 2009 2010 ($1 per hot dog × 4 hot dogs) + ($2 per hamburger × 2 hamburgers) = $8 per basket ($2 per hot dog × 4 hot dogs) + ($3 per hamburger × 2 hamburgers) = $14 per basket ($3 per hot dog × 4 hot dogs) + ($4 per hamburger × 2 hamburgers) = $20 per basket Step 4: Choose one year as a base year (2008) and compute the CPI in each year 2008 2009 2010 ($8 / $8) × 100 = 100 ($14 / $8) × 100 = 175 ($20 / $8) × 100 = 250 Step 5: Use the consumer price index to compute the inflation rate from previous
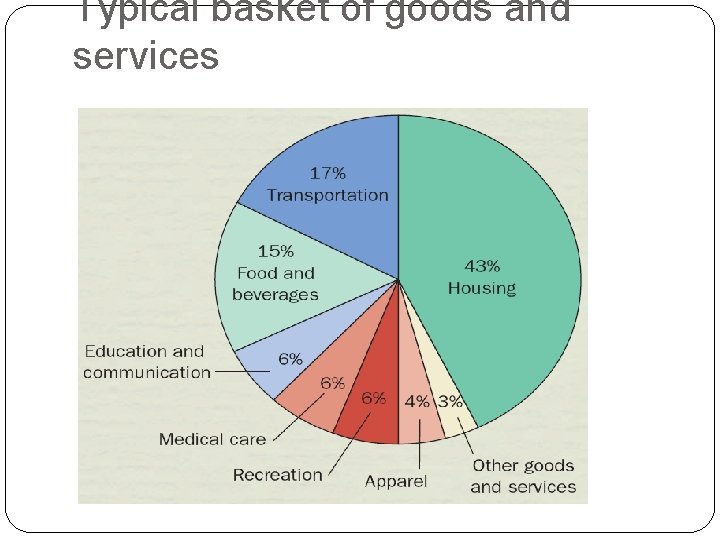
Typical basket of goods and services
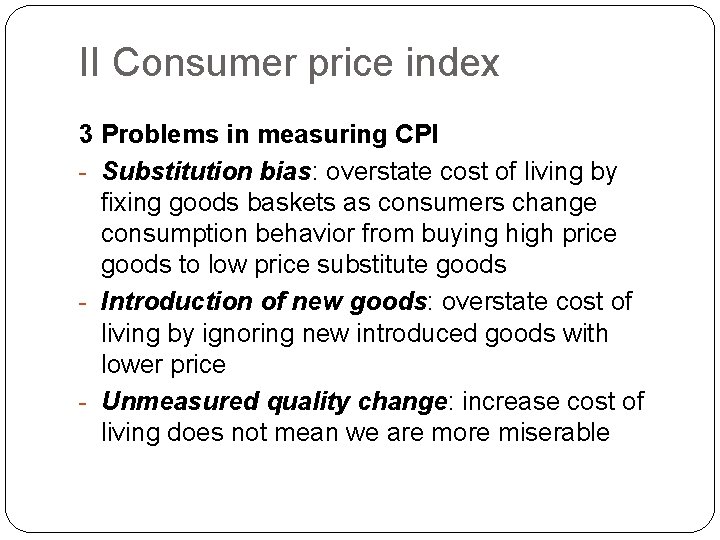
II Consumer price index 3 Problems in measuring CPI - Substitution bias: overstate cost of living by fixing goods baskets as consumers change consumption behavior from buying high price goods to low price substitute goods - Introduction of new goods: overstate cost of living by ignoring new introduced goods with lower price - Unmeasured quality change: increase cost of living does not mean we are more miserable
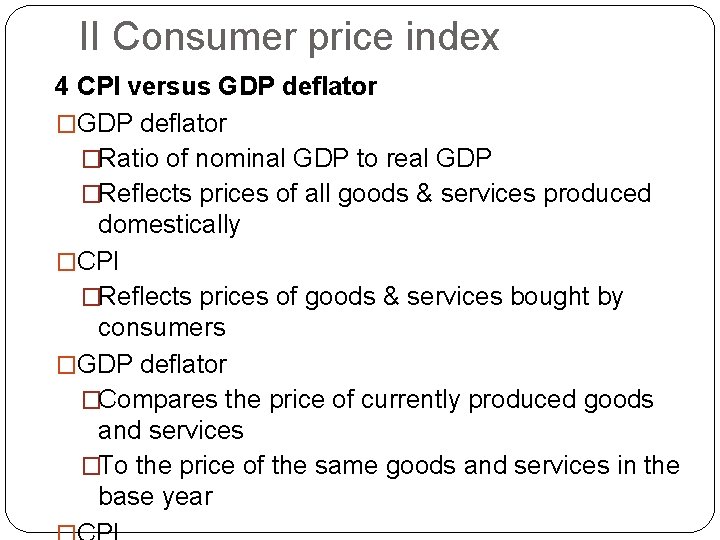
II Consumer price index 4 CPI versus GDP deflator �Ratio of nominal GDP to real GDP �Reflects prices of all goods & services produced domestically �CPI �Reflects prices of goods & services bought by consumers �GDP deflator �Compares the price of currently produced goods and services �To the price of the same goods and services in the base year
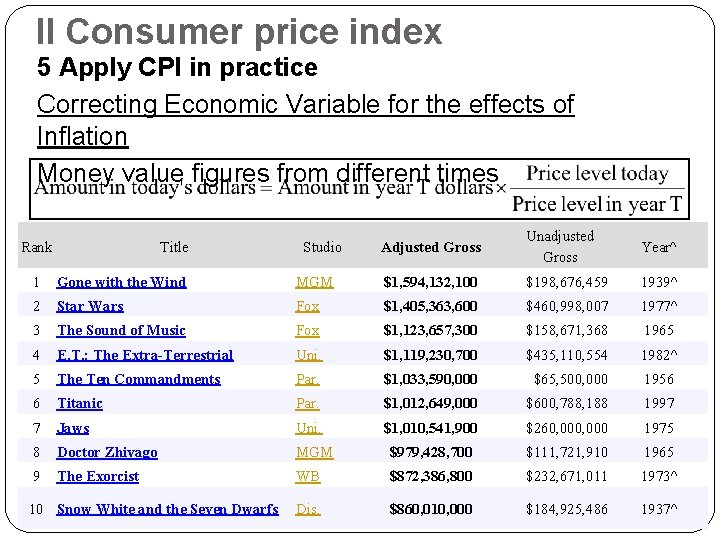
II Consumer price index 5 Apply CPI in practice Correcting Economic Variable for the effects of Inflation Money value figures from different times Rank Title Studio Adjusted Gross Unadjusted Gross Year^ 1 Gone with the Wind MGM $1, 594, 132, 100 $198, 676, 459 1939^ 2 Star Wars Fox $1, 405, 363, 600 $460, 998, 007 1977^ 3 The Sound of Music Fox $1, 123, 657, 300 $158, 671, 368 1965 4 E. T. : The Extra-Terrestrial Uni. $1, 119, 230, 700 $435, 110, 554 1982^ 5 The Ten Commandments Par. $1, 033, 590, 000 $65, 500, 000 1956 6 Titanic Par. $1, 012, 649, 000 $600, 788, 188 1997 7 Jaws Uni. $1, 010, 541, 900 $260, 000 1975 8 Doctor Zhivago MGM $979, 428, 700 $111, 721, 910 1965 9 The Exorcist WB $872, 386, 800 $232, 671, 011 1973^ Dis. $860, 010, 000 $184, 925, 486 1937^ 10 Snow White and the Seven Dwarfs
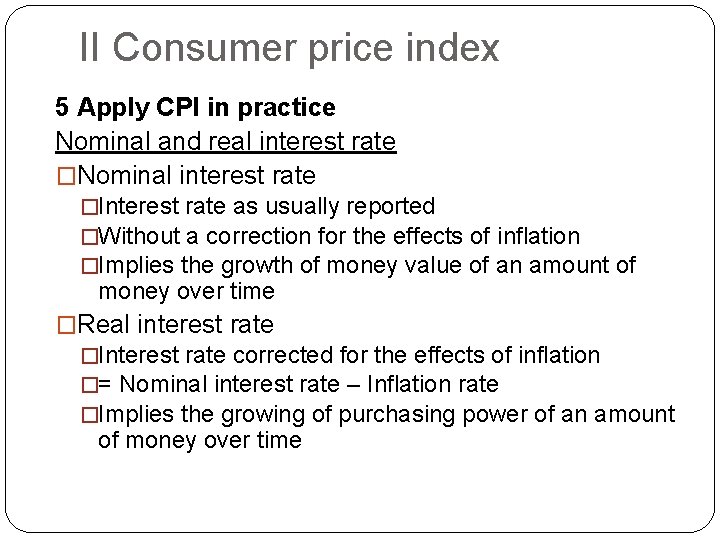
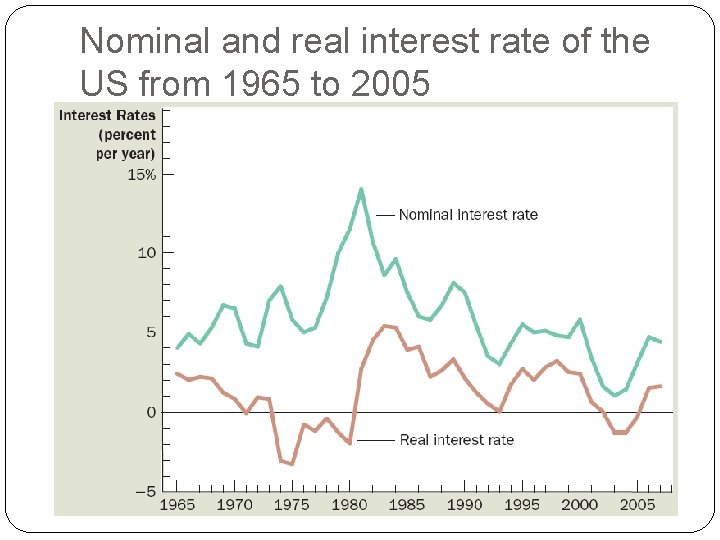
II Consumer price index 5 Apply CPI in practice Nominal and real interest rate �Nominal interest rate �Interest rate as usually reported �Without a correction for the effects of inflation �Implies the growth of money value of an amount of money over time �Real interest rate �Interest rate corrected for the effects of inflation �= Nominal interest rate – Inflation rate �Implies the growing of purchasing power of an amount of money over time
Nominal and real interest rate of the US from 1965 to 2005
Key concepts - Gross domestic products (GDP) - Gross national products (GNP) - Nominal GDP, real GDP, GDP deflator - Consumer price index (CPI) - Inflation rate - Nominal interest rate, real interest rate