Capital income share UTIPUNIDO Theil index top decile


")


- Slides: 22
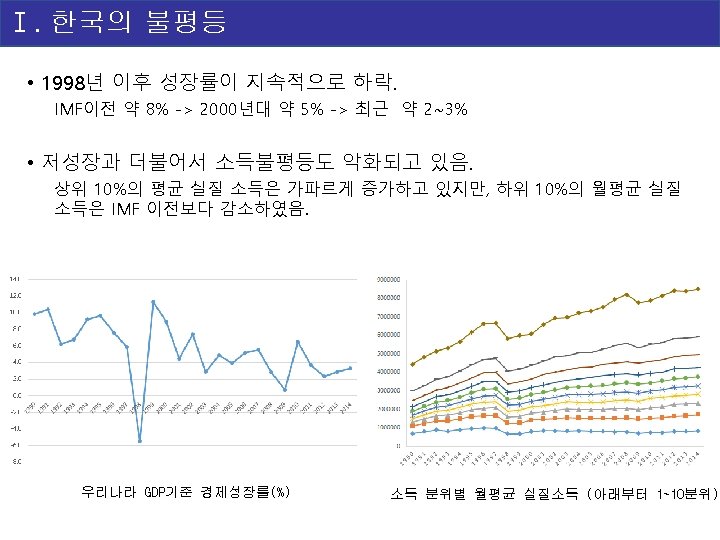
Ⅰ. 한국의 불평등 Capital income share, UTIP-UNIDO Theil index, top decile income share, and Gini coefficient in South Korea 50% 0, 50 45% 0, 45 40% 0, 40 35% 0, 35 30% 0, 30 25% 0, 25 20% 0, 20 15% 1965 0, 15 1970 1975 Capital income share (L) 1980 1985 1990 UTIP-UNIDO Theil index (R) 1995 2000 Top decile total income share (L) 2005 2010 Gini coefficient (R)
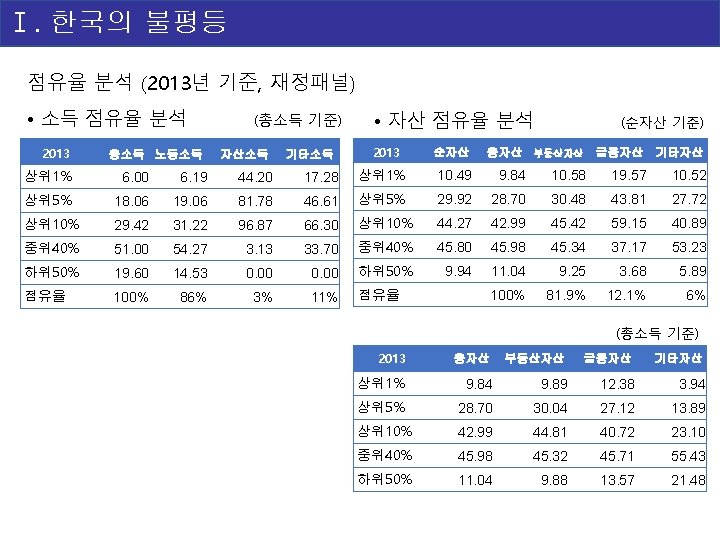
Ⅰ. 한국의 불평등 • 자산의 집중도 심화. Capital income ratio in South Korea: 1966 -2013 1000% 900% 800% % of national income 700% 600% 500% 400% 300% 200% 1965 1970 1975 1980 National wealth (B) 1985 1990 National wealth 1995 2000 Private wealth 2005 2010
Ⅰ. 한국의 불평등 Capital income ratio: international comparison 800% Private wealth 700% % of national income 600% 500% 400% 300% 200% 1965 1970 1975 USA 1980 France 1985 Germany 1990 Italy Spain 1995 UK 2000 Japan 2005 S. Korea 2010
Ⅰ. 한국의 불평등 Return to capital and the growth rate 12% 11% 10% 9% 8% 7% 6% 5% 4% 3% 2% 1965 1970 1975 1980 r (national wealth) 1985 1990 r (private wealth) 1995 2000 Income growth rate 2005 2010
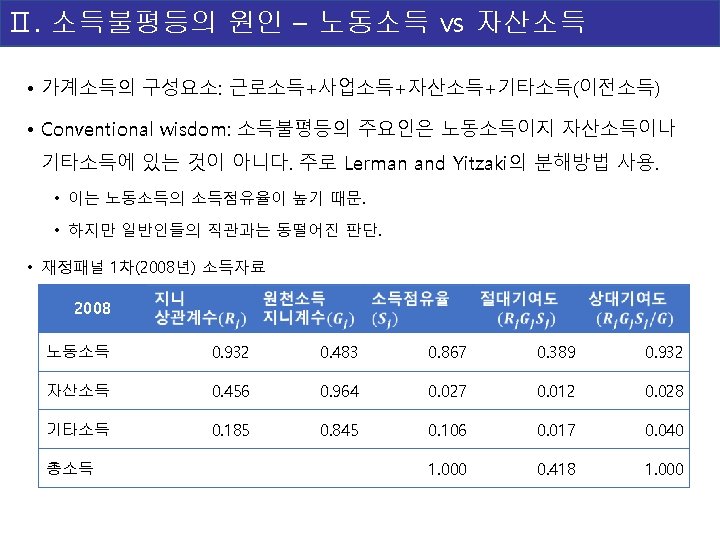
Ⅱ. 소득불평등의 원인--샤플리값 분해 Order ND’s MC JS’s MC KT’s MC Total 0. 000 <ND JS KT> 0. 483 0. 003 -0. 068 0. 418 ND 0. 483 <ND KT JS> 0. 483 -0. 018 -0. 047 0. 418 JS 0. 964 <JS ND KT> -0. 478 0. 964 -0. 068 0. 418 KT 0. 845 <JS KT ND> -0. 413 0. 964 -0. 133 0. 418 ND+JS 0. 486 <KT ND JS> -0. 410 -0. 018 0. 845 0. 418 ND+KT 0. 436 <KT JS ND> -0. 413 -0. 014 0. 845 0. 418 JS+KT 0. 831 합계 -0. 748 1. 882 1. 375 2. 509 ND+JS+KT 0. 418 절대기여 -0. 125 0. 314 0. 229 0. 418 상대기여 -0. 298 0. 750 0. 548 1. 000
Ⅱ. 소득불평등의 원인--샤플리값 분해 Order ND’s MC JS’s MC KT’s MC Total 0. 000 <ND JS KT> 0. 446 0. 017 -0. 044 0. 418 ND 0. 446 <ND KT JS> 0. 446 -0. 006 -0. 022 0. 418 JS 0. 028 <JS ND KT> 0. 435 0. 028 -0. 044 0. 418 KT 0. 042 <JS KT ND> 0. 309 0. 028 0. 081 0. 418 ND+JS 0. 463 <KT ND JS> 0. 382 -0. 006 0. 042 0. 418 ND+KT 0. 424 <KT JS ND> 0. 309 0. 067 0. 042 0. 418 JS+KT 0. 109 합계 2. 327 0. 129 0. 053 2. 509 ND+JS+KT 0. 418 절대기여 0. 388 0. 021 0. 009 0. 418 상대기여 0. 928 0. 051 0. 021 1. 000
Ⅱ. 소득불평등의 원인--샤플리값 분해 Gini index • CV(Coefficient Variation)
Ⅲ. 자산불평등의 원인 – capital gains capital-income ratios with and without capital gains 800% 700% % of national income 600% 500% 400% 300% 200% 1965 1970 1975 1980 1985 1990 1995 2000 Observed beta (national wealth) Observed beta (private wealth) Simulated beta (national wealth) Simulated beta (private wealth) 2005 2010
Ⅲ. 자산불평등의 원인 – capital gains Decomposition of private wealth growth in South Korea, 1966 -2013 Decomposition of wealth growth rate Income growth rate () Real growth rate of wealth ( ) Savings-induced wealth growth rate () Share of total wealth accumulation coming from Capital gains-induced wealth growth rate ( ) Initial wealth savings Capi tal gain s 39% 59% 40% 60% 46% 51% 47% 53% 19% 59% 24% 76% 25% 53% 32% 68% 42% 34% 55% 47% 29% 62% 38% 23% 34% 41% 59% Multiplicative 2% 1966 -2013 7. 3% 8. 4% 3. 3% 4. 9% Additive 2% Multiplicative 22% 1966 -1980 9. 4% 11. 4% 2. 7% 8. 5% Additive 22% Multiplicative 24% 1980 -1998 7. 6% 8. 2% 4. 5% 3. 6% Additive 24% Multiplicative 43% 1998 -2013 4. 9% 5. 8% 2. 4% 3. 4% Additive 41%