Can they give us the growth we want


 � Yield (High is not always")


- Slides: 11
Can they give us the growth we want?
How to build a superior portfolio of dividend yielding stocks By Peter O’Shea And Jonathan Worrall
� 1926 – 2005 Dividends contributed almost 40% of the average annual return of stocks on the S&P Index � Since 1926 nearly half of the 10. 3% annual stock market return has come from dividends and dividend reinvestment
� Less volatile—bought for long-term � Tend to be more mature companies--make sure they are not on downward slope � Easy value calculation--Predictable cash flow � Imposes financial discipline on management � Dividend stocks attract investors � Long-term winners tend to be stocks with above average yields and relatively low payout ratios
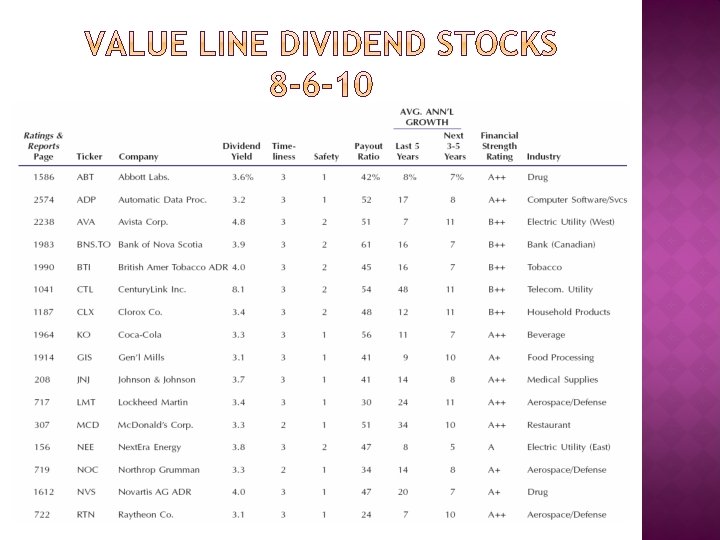
� Historical performance of dividend (consistency and growth) � Yield (High is not always better; watch out for company using debt to finance) � Payout ratio ((30 -50% considered moderate) � Ability of company to continue paying dividends (Fundamental Analysis) � Taxes (Rate for dividends vs. bonds)
� Consistent sales and earnings growth � Good management � Best in industry � Competitive advantage � Well-funded pension plans � Strong free-cash flow (double dividend payment) � Low debt/equity
“Dividends still don’t lie: the truth about investing in blue chip stocks and winning in the stock market” By Kelley Wright Editor, Investment Quality Trends
� Dividend increase at least 5 times over 12 yrs � S&P Quality is in “A” category � At least 5 million shares outstanding � At least 80 institutional investors � At least 25 years uninterrupted dividends � Earnings have improved in at least 7 of last 12 years. This criteria eliminates 98% of the roughly 15, 000 publicly traded stocks (275 companies)
� Valuation is determined by historical low and high yields. � At least 12 years of data. � Average the top three years and the low three years for dividend yields. � Prices are undervalued or overvalued when they are within 10% range of historic levels. � Caution: markets are a reflection of the thoughts, opinions, and emotions of millions of investors
� Rising 10% off undervalued base, stock enters into a rising trend. � This is called the holding area. � When price reaches level within 10% of the historically low yield calculation, it is considered overvalued. � Trend for overall market must also be considered—bulls or bears in control. � Values can be found in any market, however.