Biomedical Signal processing Zhongguo Liu Biomedical Engineering School
 Biomedical Engineering School of Control Science and Engineering,")
Biomedical Signal processing 研究生生物医学信号处理实践课 Zhongguo Liu(刘忠国) Biomedical Engineering School of Control Science and Engineering, Shandong University http: //course. sdu. edu. cn/bdsp. html 生物医学信号处理网站“教学资料”栏目下 2022/2/16 1 1 Zhongguo Liu_Biomedical Engineering_Shandong Univ.

教材:John L. Semmlow编 Biosignal and Biomedical Image Processing MATLABBased Applications,2004年第一版 参考2008年第二版配书程序 2022/2/16 2 2 Zhongguo Liu_Biomedical Engineering_Shandong Univ.

第 3章_Spectral Analysis: Classical Methods 3. 1 INTRODUCTION Determining the frequency content of a waveform is termed spectral analysis, which can be thought of as a mathematical prism. Fig 3. 1 EEG signal and the resultant power spectrum( Zhongguo Liu_Biomedical Welch Method ) Engineering_Shandong Univ. 11

Fig 3. 1 程序 addpath 'E: Program FilesMATLABbiosignalcdChapter 3' load fig 1_data; n = length(eeg); subplot(2, 1, 1); t = (1: n)/100; % Assume sample rate is 100 Hz plot(t, eeg, 'k'); xlabel('Time (sec)'); ylabel ('EEG'); [ps, f] = pwelch(eeg, 256, 100, 128); subplot(2, 1, 2); plot(f, ps, 'k'); xlabel('Frequency (Hz)'); ylabel('Power Spetrrum'); [ps, f] = pwelch(x, window, noverlap, nfft, fs) Zhongguo Liu_Biomedical Engineering_Shandong Univ. 12
 from a waveform consisting of a 100")
3. 1 INTRODUCTION Spectra(左Fourier transform, 右averaging technique) from a waveform consisting of a 100 Hz sine wave and white noise. the 100 Hz component is no longer visible( 右), averaging technique produces a better estimate of the white noise spectrum. (The spectrum of white noise should 14 Zhongguo Liu_Biomedical Engineering_Shandong Univ.
![Fig 3. 2 程序 [data, time] = sig_noise(100, -14. 9, 1024); T =. 001;](http://slidetodoc.com/presentation_image_h2/be0b1b614fb6fbb7bffbb9ad67cd4bae/image-14.jpg "Fig 3. 2 程序 [data, time] = sig_noise(100, -14. 9, 1024); T =. 001;")
Fig 3. 2 程序 [data, time] = sig_noise(100, -14. 9, 1024); T =. 001; % The sample frequency is 1 k. Hz. N = length(data); % lentgh of the data array (1024) Y = fft(data); % Calculate FFT Mag = abs(Y); PS 1 = Mag. ^2; % power sepctrum freq = [1/(N*T): 1/T]; % frequencies of PS subplot(1, 2, 1); plot(freq(1, 1: 512), PS 1(1, 1: 512)/100, 'k'); % Plot PS xlabel('Frequency (Hz)'); ylabel('Power Spectrum (db)'); % Estimate the Welch spectrum [PS, f] = pwelch(data, triang(32), 16, 32, 1000); subplot(1, 2, 2); plot(f, PS*20500, 'k'); % Plot PS xlabel('Frequency (Hz)'); ylabel('Power Spectrum (db)'); [ps, f] = pwelch(x, window, noverlap, nfft, fs) Zhongguo Liu_Biomedical Engineering_Shandong Univ. 15

THE FOURIER TRANSFORM: FOURIER SERIES ANALYSIS Periodic Functions :Fourier series analysis, harmonic decomposition:Fourier series sine and cosine components (3. 1) (3. 2) T is the period or time length of the waveform, f. T=1/T, Fourier series sine and cosine components can be summed to reconstruct the original waveform: (3. 3) Zhongguo Liu_Biomedical Engineering_Shandong Univ. 16
 A square")
THE FOURIER TRANSFORM: FOURIER SERIES ANALYSIS reconstruct the original waveform: (3. 3) A square wave is approximated by a series of 3 and 6 sine waves Zhongguo Liu_Biomedical Engineering_Shandong Univ. 17

Fig 3. 3 程序 :方波重建 N = 512; N 1 = 2*N; t = (1: N 1)/N 1; % Time vector % Generate function x = [-ones(N, 1); ones(N, 1)]; % Square wave X = abs(fft(x))/N; y = zeros(1, N 1); subplot(2, 2, 1) for i = 1: 6 j = 1 + 2*(i-1); y = y - X(2*i) * sin(2*pi*j*t); if i == 3 plot(t, x, ': k', t, y, 'k'); xlabel('Time(sec)'); text(. 1, 1, ['N = ', num 2 str(i)]); ylabel('x(t)') end subplot(2, 2, 2); plot(t, x, ': k', t, y, 'k'); xlabel('Time(sec)'); text(. 1, 1, ['N = ', num 2 str(i)]); ylabel('x(t)') Zhongguo Liu_Biomedical Engineering_Shandong Univ. 18
 A triangle")
THE FOURIER TRANSFORM: FOURIER SERIES ANALYSIS reconstruct the original waveform: (3. 3) A triangle wave is approximated by a series of 3 and 6 cosine waves Zhongguo Liu_Biomedical Engineering_Shandong Univ. 19

Fig 3. 3 程序 :三角波重建 N = 512; N 1 = 2*N; t = (1: N 1)/N 1; % Time vector % Generate function x 1 = [(1: N)*2/N (N: -1: 1)*2/N] - 1; % Triangle wave x 1 = x 1'; X 1 = abs(fft(x 1))/N; y = zeros(1, N 1); subplot(2, 2, 1) for i = 1: 6 j = 1 + 2*(i-1); y = y - X 1(2*i) * cos(2*pi*j*t); if i == 3 plot(t, x 1, ': k', t, y, 'k'); xlabel('Time(sec)'); ylabel('x(t)'); text(. 1, 1, ['N = ', num 2 str(i)]); axis([0 1 -1. 5]); end subplot(2, 2, 2); plot(t, x 1, ': k', t, y, 'k'); xlabel('Time(sec)'); text(. 1, 1, ['N = ', num 2 str(i)]); ylabel('x(t)'); axis([0 1 -1. 5]); Zhongguo Liu_Biomedical Engineering_Shandong Univ. 20

THE FOURIER TRANSFORM: FOURIER SERIES ANALYSIS Spectral information is usually presented as a frequency plot, a plot of sine and cosine amplitude vs. component number m, or the equivalent frequency f. f =m/T it is more intuitive to plot the amplitude and phase angle of a sinusoidal wave using the rectangular-topolar transformation: acos(x)+bsin(x)=Csin(x+Θ) (3. 4 ) Zhongguo Liu_Biomedical Engineering_Shandong Univ. 21

THE FOURIER TRANSFORM: FOURIER SERIES ANALYSIS Spectral information : plot the amplitude and phase angle of a sinusoidal wave (f =m/T) acos(x)+bsin(x)=Csin(x+Θ) (3. 4) A triangle or sawtooth wave (left) and the first 10 terms of its Fourier series (right) Zhongguo Liu_Biomedical Engineering_Shandong Univ. 22

THE FOURIER TRANSFORM: FOURIER SERIES ANALYSIS Symmetry Some waveforms are symmetrical or anti-symmetrical about t =0, so that, a(k)=0 or b(k) )=0 in Eq. (3). Zhongguo Liu_Biomedical Engineering_Shandong Univ. 23

THE FOURIER TRANSFORM: FOURIER SERIES ANALYSIS Discrete Time Fourier Analysis The spectra is repetitive at frequencies mf. T (m=1, 2, 3, . . . ). The discrete Fourier series of any waveform is theoretically infinite, but it is periodic and symmetric about fs/2(fs/2 is the. Nyquist frequency). Discrete Fourier Transform : (3. 6 ) The Inverse Discrete Fourier Transform : (3. 7) fm=mf 1 =m/TP=m/NTs =mfs/N Zhongguo Liu_Biomedical Engineering_Shandong Univ. 24

THE FOURIER TRANSFORM: FOURIER SERIES ANALYSIS Aperiodic Functions the sinusoidal components can exist at all frequencies, not just multiple frequencies or harmonics. the frequencies obtained by analysis are only samples along a continuous frequency spectrum of a periodic triangle wave for three different periods. Zhongguo Liu_Biomedical Engineering_Shandong Univ. 25

THE FOURIER TRANSFORM: FOURIER SERIES ANALYSIS Frequency Resolution If the sampling time is Ts, the frequency resolution of the spectra will approximately be the same as the frequency spacing, 1/(NTs). zero padding does not enhance the underlying resolution of the transform since the number of points that actually provide information remains the same; however, zero padding does provide an interpolated transform with a smoother appearance, and can make it easier to estimate the frequency of peaks in the spectra. Zhongguo Liu_Biomedical Engineering_Shandong Univ. 26

THE FOURIER TRANSFORM: FOURIER SERIES ANALYSIS Truncated Fourier Analysis: Data Windowing in EEG and ECG analysis , the waveforms being analyzed continue over the lifetime of the subject. Obviously, only a portion of such waveforms can be used, and some attention must be paid to how the waveform is truncated: windowing. (window: tapering functions) Zhongguo Liu_Biomedical Engineering_Shandong Univ. 27

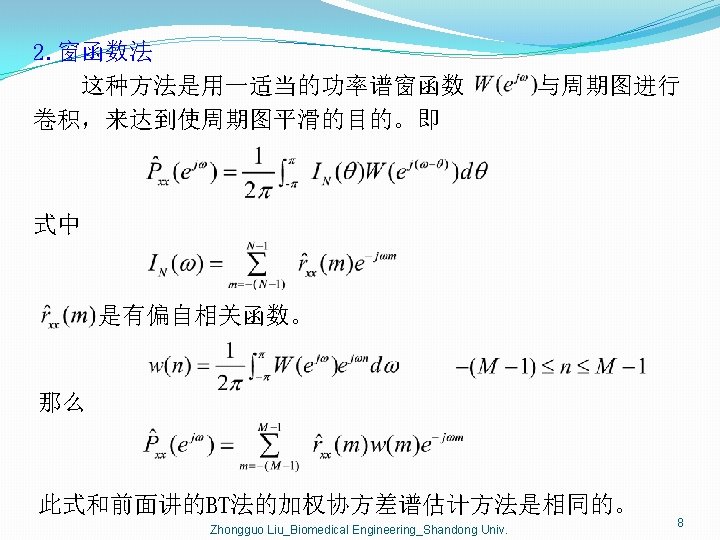
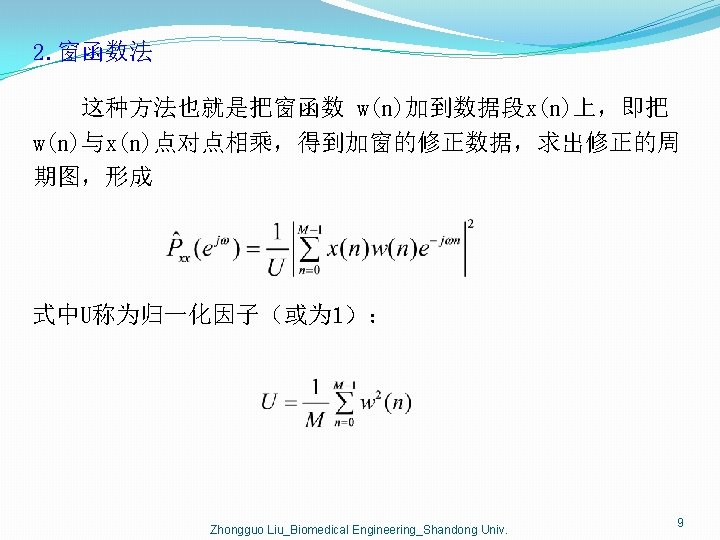
THE FOURIER TRANSFORM: FOURIER SERIES ANALYSIS Power Spectrum The power spectrum is commonly defined as the Fourier transform of the autocorrelation function rxx(n). (3 -14) rxx(n) has even symmetry , sine terms b(k)=0. 则 (3 -15) Zhongguo Liu_Biomedical Engineering_Shandong Univ. 28
 The")
THE FOURIER TRANSFORM: FOURIER SERIES ANALYSIS Power Spectrum(energy , power spectral density ) The direct approach:Parseval定理 1) 能量型信号 energy spectral density (3 -17) 为能量谱密度,简称能量谱。 2)功率型信号 power spectral density 是截断信号 的傅里叶变换 为功率谱密度,简称功率谱 Zhongguo Liu_Biomedical Engineering_Shandong Univ. 29
 (3")
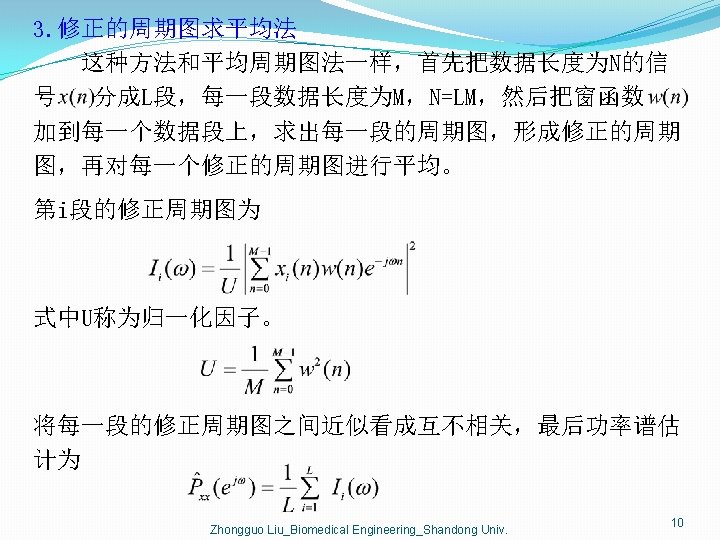
THE FOURIER TRANSFORM: FOURIER SERIES ANALYSIS Power Spectrum(energy , power spectral density ) (3 -18) Power spectrum is based on the Fourier transform followed by averaging, called periodogram. Averaging is achieved by dividing the waveform into a number of overlapping segments. Welch periodograms Fig 3. 9 A waveform. Zhongguo is divided into three segments with a 50% overlap Liu_Biomedical Engineering_Shandong Univ. 30
 MATLAB IMPLEMENTATION Direct FFT and Windowing X")
Power Spectrum (energy , power spectral density) MATLAB IMPLEMENTATION Direct FFT and Windowing X = fft(x, n) Magnitude = abs(X) Phase = angle(X) [x, t] = sig_noise([f], [SNR], N); where f specifies the frequency of the sinusoid(s) in Hz, SNR specifies the desired noise associated with the sinusoid(s) in db, and N is the number of points. The routine assumes a sample frequency of 1 k. Hz. Zhongguo Liu_Biomedical Engineering_Shandong Univ. 31
 Ex. 3. 1 Determine power spectrum of")
Power Spectrum (energy , power spectral density) Ex. 3. 1 Determine power spectrum of a sig_noise. N = 1024; fs = 1000. [x, t] = sig_noise(250, -7, N); % 250 Hz sin plus white noise) Y = fft(x); % Calculate FFT Mag = abs(Y); %Compute magnitude complex array PS = Mag. ^2; % power sepctrum: magnitude squared freq = (1: N); % Fill vector with frequencies of PS plot(freq, 20*log 10(PS), 'k'); % Plot PS in log scale xlabel('Frequency (Hz)', 'Font. Size', 16); ylabel('Power Spectrum (db)', 'Font. Size', 16); axis([1 1000 0 120]) Zhongguo Liu_Biomedical Engineering_Shandong Univ. 32
 Ex. 3. 1 Determine power spectrum of")
Power Spectrum (energy , power spectral density) Ex. 3. 1 Determine power spectrum of a sig_noise. FIGURE 3. 10 Zhongguo Liu_Biomedical Engineering_Shandong Univ. 33
 The Welch Method for Power Spectral Density")
Power Spectrum (energy , power spectral density) The Welch Method for Power Spectral Density MATLAB Signal Processing Toolbox [PS, f] = pwelch(x, window, noverlap, nfft, fs) By default, x is divided into eight sections with 50% overlap, each section is windowed with a Hamming window and eight periodograms are computed and averaged. If pwelch is called with no output arguments, the default is to plot the power spectral estimate in d. B per unit frequency. 34 Zhongguo Liu_Biomedical Engineering_Shandong Univ.
 Ex. 3. 2 Apply Welch’s method to")
Power Spectrum (energy , power spectral density) Ex. 3. 2 Apply Welch’s method to the signalin Ex. 3. 1. Use 128 -point data segments and a 50% overlap. FIGURE 3. 11 N = 1024; fs = 1000. [x, t] = sig_noise(250, -7, N); % 250 Hz sin plus white noise % Estimate the Welch spectrum using 128 point %segments, a triangular filter, and a 50% overlap. [PS, f] = pwelch(x, triang(128), [ ], 128, fs); plot(f, 10*log 10(PS)); % Plot in d. B xlabel('Frequency (Hz)'); ylabel('Power Spectrum'); Zhongguo Liu_Biomedical Engineering_Shandong Univ. 35
 Window Functions w = window_name(N); w =")
Power Spectrum (energy , power spectral density) Window Functions w = window_name(N); w = window(@name, N, opt) Generate vector w of length N, containing the window function of the associated name: bartlett, blackman, gausswin, hamming( default), hann, kaiser, rectwin, and triang, chebwin (has a second argument to specify the constant level of sidelobe amplitude. ). opt 见 doc window 中的 chebwin, kaiser等 查看窗的幅频响应 freqz(chebwin(10), 1) Zhongguo Liu_Biomedical Engineering_Shandong Univ. 36
 Window Functions To apply a window to")
Power Spectrum (energy , power spectral density) Window Functions To apply a window to the Fourier series analysis: w = triang (N); x = x. * w’; % Multiply (point-by-point) data by window X = fft(x); % Calculate FFT [PS, f] = pwelch(x, triang(128), 64, 128, 1000); Note that in the example above it was necessary to transpose the window function W so that it was in the same format as the data. The window function produces a row vector. Zhongguo Liu_Biomedical Engineering_Shandong Univ. 37

Power Spectrum: Window Functions Figure 3. 12 two spectra for a sig_noise (235 Hz and 250 Hz) using Welch method with two windows. Triangular Window data = sig_noise([235 250], -10, 1024); N = length(data); Fs = 1 k. Hz [PS, f] = pwelch(data, triang(128), 64, 128, 1000); subplot(2, 1, 1); plot(f, PS, 'k'); %title('(Triangular Window)'); Chebyshev window (db)'); xlabel('Frequency (Hz)'); ylabel('Power Spectrum [PS, f] = pwelch(data, chebwin(128, 80), 64, 128, 1000); subplot(2, 1, 2); plot(f, PS, 'k'); %title(‘(Chebyshev window)'); xlabel('Frequency (Hz)'); ylabel('Power Spectrum (db)'); Zhongguo Liu_Biomedical Engineering_Shandong Univ. 38

练习 3 -1,3 -2,3 -7,3 -8,3 -9,3 -10 Zhongguo Liu_Biomedical Engineering_Shandong Univ. 39
- Slides: 38