Chapter 12 Signal processing Signal processing refers to


x. TR")

=TR/(Active time) or. TR/(TE+1/2 Ts+to) • Each slice has its own")

 • If ωmax is the maximum frequency in the signal,")

")


 and ¼")

 • PSD of SE • After Gz to refocus the")


")


=1/FOV Δx=pixel size in image Δk=pixel size")


 and are: A)")
")
 SNRα (voxel volume) {(Ny)(NEX)/BW}1/2 NEX")
increasing TR 2)Decreasing TE 3)Using lower")
 {(Nz)(Ny)(NEX)/BW}1/2 • SNR(in 3 D) α")

 • • • • 1) Increase if: >>Increase")
 Increasing TR:")
 Increasing TE: • Increase T 2")
 • Advantages: • Can suppress various tissue by selecting appropriate TI")

- Slides: 47
Chapter 12 Signal processing
• Signal processing refers to analog and/or digital manipulation of signal • Image processing is a form of signal processing in which the manipulations are performed on digitized image • Aliasing may happens when analog signal is digitized and again the digitized signal converted to analog
Sequences of events in SE
Time requirements • Frequency encoding step takes about 10 ms(4 -8 ms for high field and 1630 ms in low field) • Phase encoding step takes 1 -5 ms • Each RF pulse (with a Gz gradient) takes 2 -10 ms • Time spend from center of 90 degree pulse to the end echo readout is: • TE+1/2 sampling time)=TE+1/2 Ts • Active time=TE+1/2 Ts+To • Time spend to obtain one slice image =Ny(number of phase encoding)x. TR
• The center of the k-space always contain the weakest phase encoding gradient and hence most signal • The periphery of k-space contain highest phase encoding gradient and hence weakest signal
• Time spend to obtain one slice image =Ny(number of phase encoding)x. TR
Multi slice technique
Max NO of Slices(coverage)=TR/(Active time) or. TR/(TE+1/2 Ts+to) • Each slice has its own k-space
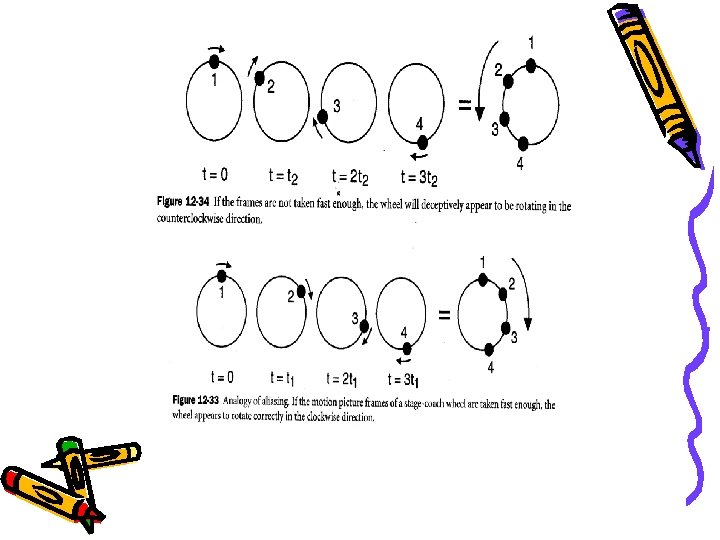
Aliasing • when analog signal is digitized and again the digitized signal converted to analog may happen • Undersampling Alising
Sampling Theorem (Nyquist law) • If ωmax is the maximum frequency in the signal, the sampling rate must be at least twice the maximum frequency to avoid aliasing. ωsampling=1/ΔTs≥ 2ωmax Ts=Nx. ΔTs=256 x ΔTs In a composite signal minimum sampling should be at least two times the maximum frequency present in the sample
• In MRI imaging; to reduce sampling time; minimum possible sampling of the signal is performed therefore: Bandwidth(BW)=2(ωmax)=1/ΔTs ΔTs=Ts/Nx=8 ms/256=0. 0000137 BW=1/ ΔTs=1/0. 0000137=32 k. Hz=± 16 k. Hz • In MRI k space is the digitized version of received signal • A minimum of two samples/cycle is taken and is put in data space
Signal to Noise ratio (SNR)
Chapter 13 Data space
Where dose k-space come from • K-space derived from data space • It is a digitized version of data space • The x axis is spatial frequency • It has 256 phase encoding steps on y axis (+127 to -127) and 256 frequency on x-axis • Each line in the data space contain signal from entire slice • In the center row and column we put the signal with no phase encoding gradient (in x and y direction) hence max signal
• The time taken to go from one row to another is TR • The time taken to go from one point in a row to another is ΔTs • The time taken to fill one row of data space is: • Ts =(ΔTs )(Nx)=(50 ms)(256)=8. 12 ms • The time taken to fill one column of data space is Nyx. TR (for TR=500 ms and Ny=256); it is about 2 min
Motion artifact • The time to fill one row is about 8 ms • The time to fill one column is about 2 min • The motion artifact is mainly in y direction or in phase encoding direction
Properties of K space • 1 -The center of data space contains maximum signal • 2 -The maximum amplitude occurs in the center row • 3 -In y direction because of phase encoding gradient • 4 -In x direction because of rephasing and dephasing
Image of k space • The k space appear as a series of concentric rings of signal intensities oscillating from max to min • The intensities on the center is max and decrease when goes to periphery
Edge of k space • The detail information provides by periphery data • The is no absolute relation between center data and center of the image
K space symmetry • Image can be constructed from ½ (1/2 NEX) and ¼ (1/4 NEX) of the data
Chapter 14 Pulse sequence diagram
Pulse sequence diagram (PSD) • PSD of SE • After Gz to refocus the spins a negative pulse is applied • Crusher gradients are applied at each sides of 180 pulse to achieve more accurate refocusing at time TE
• When apply Gx when we are reading the echo, we end up dephasing everything • To get a good signal during Gx, a negative gradient with area equal to ½ Gx is applied before Gx
• Pre Gx gradient can be positive if it comes before 180 focussing pulse • In this case spins defase in positive direction but with 180 degree pulse they reverse
Chapter 15 Field of View (FOV)
• FOV: desired part of the body under investigation. • FOV depends on: • 1 -BW • 2 -Gradients
FOV • • • • FOV is selected by operator FOV depends on BW and Gradients. In x direction: Bx=(Gx). x γ. Bx= γ. (Gx). x fx=γ. (Gx)x fmax=γ. (Gx)FOV/2 -fmax=-γ. (Gx)FOV/2 +fmax to fmax=2 fmax=BW BW=γ. (Gx)FOV FOVx=BW/γ. Gx To FOV BW Gradient
What is the min possible FOV: • FOVmin=BWmin/ γ Gmax • BWmin and Gmax are machin dependent. For Echospeed Plus 1. 5 T scanner: • Gmax=23 m. T/m • BWmin=± 4 k. Hz=8 k. Hz • Therefore FOVmin=0. 8 cm
Chapter 16 K space Final Frontier
• What is the dimensions of the kspace matrix • The data matrix of the image is very asymmetric • Its y direction is taken in Ny. TR which is about several min • Its x direction is about 8 ms
• • • We had FOVx=BW/γ. Gx We know that BW=1/ΔTs Therefore FOVx=BW/γ. Gx=1/ γ. Gx ΔTs Or : 1/FOVx= γ. Gx ΔTs Term γ. Gx ΔTs is denoted Δkx hence • Δkx =γ(MHz/Tesla). Gx(mili. Tesla/m). ΔTs (ms) • Δkx (cycle/m)=1/FOV
• Main thing is: • • Δkx(cycle/m)=1/FOV Δx=pixel size in image Δk=pixel size in k space X=FOVx=sum of the pixels in image • K=sume of the pixels in kspace • K space is the spatial frequency domain • In Y direction the same is true (ky=1/ Δy) or Δky=1/FOVy
• The relation between phase and frequency is: • Θ=∫ωdt • ω=γ. B= γ. G. x • Θy= ωy. ty= γ. By. ty= γ. Gy. y. ty= (γ. Gy. ty)y=ky. y
Chapter 17 Scan parameters and Optimization
Scan parameters • • • • Primary parameters (are set directly) and are: A) contribute to image contrast: TR TE TI FA (flip angle) B) Contribute to coverage Slice thickness Interslice gap C) Contribute to resolution FOV (in x and y direction) Nx Ny NEX Bandwidth
Scan parameters From the primary parameters we can get secondary parameters which are: 1) S/N 2) Resolution 3) Coverage 5) Scan time 6) Image contrast
• • • SNR (signal to noise ratio) SNRα (voxel volume) {(Ny)(NEX)/BW}1/2 NEX (number of excitation) NEX => SNR by (NEX)1/2 BW => SNR BW=N (number of pixel in x direction)/Ts (read out or sampling time) example 256/8=32 KHz • (S 1+S 2)/(N 1+N 2)=2 S/(2)1/2 N=(2)1/2 S/N
SNR increase by doing the following: • • 1)increasing TR 2)Decreasing TE 3)Using lower BW (by BW-1/2) 4)Using volume imaging 5)Increasing NEX (by NEX 1/2) 6)Increasing Ny (by Ny 1/2) 7)Increasing voxel size
SNR in 3 D • SNRα (voxel volume) {(Nz)(Ny)(NEX)/BW}1/2 • SNR(in 3 D) α (Nz)1/2 SNR(in 2 D) • 1/BW=Ts/Nx=> • SNRα (voxel volume) {(Ny)(NEX)(Ts)/Nx}1/2 • T=Ts. Ny. NEX=> • SNR α(voxel volume)(total sampling time of all the signals) 1/2
• • • Resolution It is determined by : 1 -Pixel size=FOV/No. of pixels Ny =>better Res. 2 -Total sampling time • Acquisition time • Scan time=TR. Ny. NEX • FSE time=TR. Ny. NEX/ETL • In 3 D: • Time=TR. Ny. Nz. NEX
Coverage (distance covered by multislice acquisition) • • • • 1) Increase if: >>Increase slice thickness >>increase interslice gap >>Increase TR or decrease the last TE (i. e. Increase TR/TE) >>Decrease sampling time Ts (resulting in lower TE) 2) Coverage increase if: >>Increase TE >>Increase Ts >>Increase ETL in FSE imaging (due to longer final TE) 3)Increase interslice gap causes: >>Increase coverage >>Decrease cross-talk artifact >>Increase SNR (due to increasing effective TR by reducing cross-talk) • >>Decrease detection of small lesions (which may lies within the gap)
What happens if we increase or decrease TR • • • 1) Increasing TR: Increase SNR (according to T 1 recovery curve) Increase coverage (more slice) Decrease T 1 W image Increase PD and T 2 weighting Increase scan time 2)Decreasing TR: Decrease SNR Decrease coverage Increase T 1 W Decrease PD and T 2 weighting
What happens if we change TE • 1) Increasing TE: • Increase T 2 W • Increase dephasing and thus decrease SNR (according to t 2 decay curve) • Decrease number of possible slice (decrease coverage) • No change in scan time • 2)Decreasing TE: • Decrease T 2 W or PDW • Increase SNR (less dephasing) • Increase coverage • No change in scan time
TI (inversion time) • Advantages: • Can suppress various tissue by selecting appropriate TI • 1 -STIR when TI=0. 693 T 1(fat) • 2 -FLAIR when TI=0. 693 T 1(fluid) • Disadvantages: • 1 -Decrease SNR • 2 -Decrease coverage (by a factor of about 2 due to presence of the extra 180 degree pulse)