ARDAGH GLASS VALUATION COMPETITIVE ANALYSIS DEAL STRUCTURE A
- Slides: 22
ARDAGH GLASS: VALUATION, COMPETITIVE ANALYSIS & DEAL STRUCTURE A Report Prepared for Battcock Jenkinson Advisors LLC by MATRIX Partners LLP
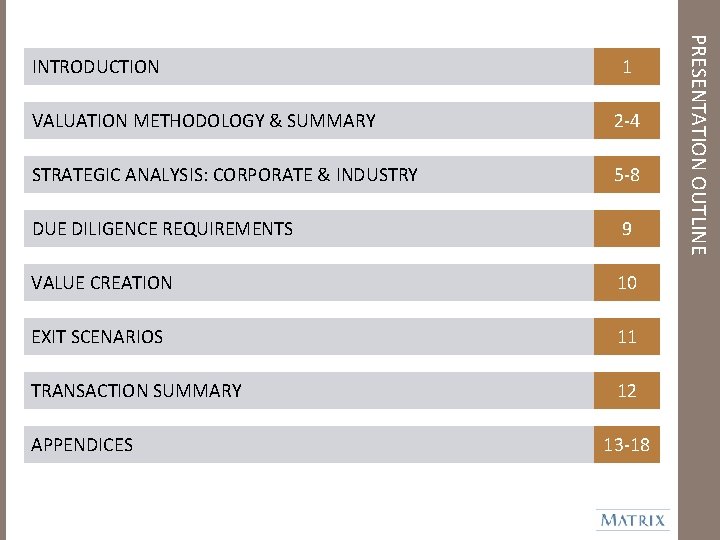
1 VALUATION METHODOLOGY & SUMMARY 2 -4 STRATEGIC ANALYSIS: CORPORATE & INDUSTRY 5 -8 DUE DILIGENCE REQUIREMENTS 9 VALUE CREATION 10 EXIT SCENARIOS 11 TRANSACTION SUMMARY 12 APPENDICES 13 -18 PRESENTATION OUTLINE INTRODUCTION
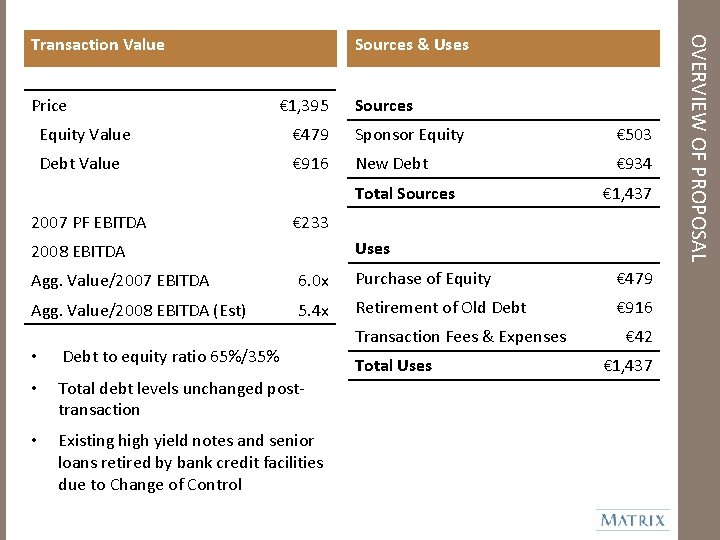
Price Sources & Uses € 1, 395 Sources Equity Value € 479 Sponsor Equity € 503 Debt Value € 916 New Debt € 934 Total Sources 2007 PF EBITDA € 1, 437 € 233 Uses 2008 EBITDA Agg. Value/2007 EBITDA 6. 0 x Purchase of Equity € 479 Agg. Value/2008 EBITDA (Est) 5. 4 x Retirement of Old Debt € 916 • Debt to equity ratio 65%/35% • Total debt levels unchanged posttransaction • Existing high yield notes and senior loans retired by bank credit facilities due to Change of Control Transaction Fees & Expenses Total Uses € 42 € 1, 437 OVERVIEW OF PROPOSAL Transaction Value
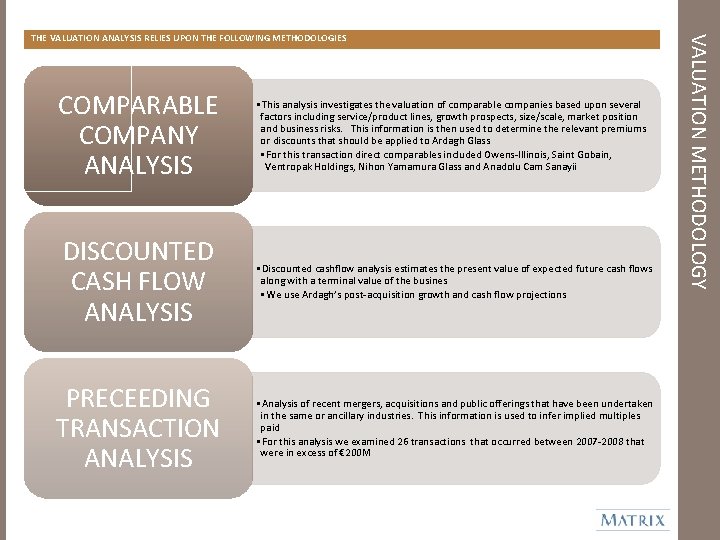
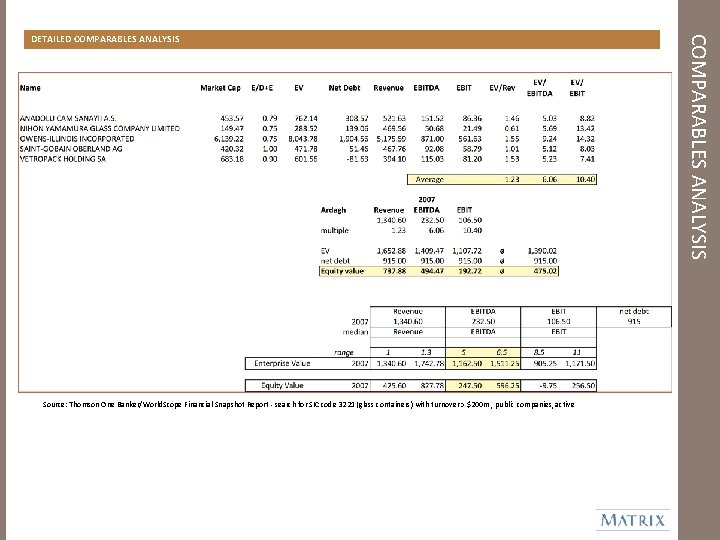
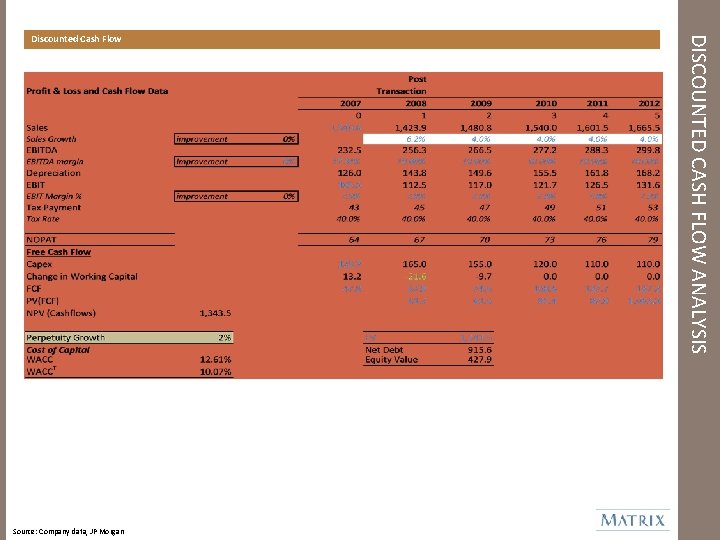
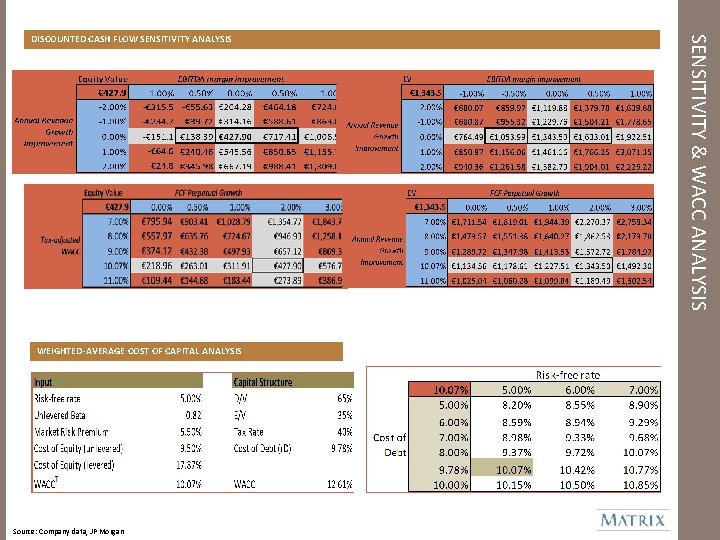
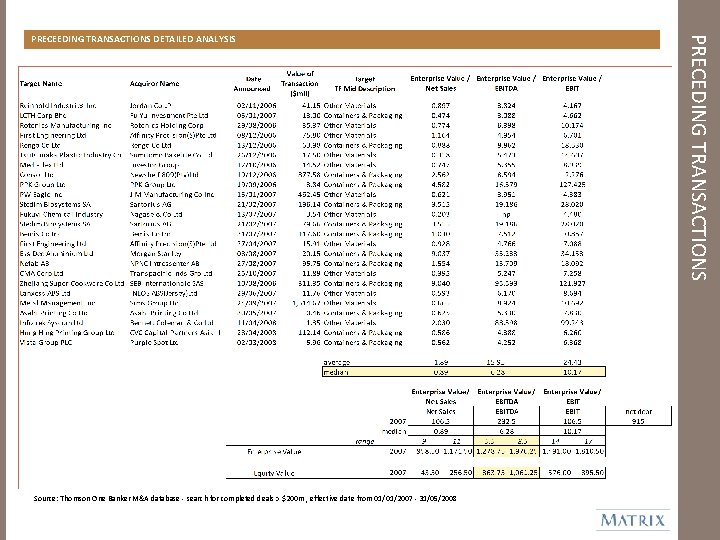
COMPARABLE COMPANY ANALYSIS • This analysis investigates the valuation of comparable companies based upon several factors including service/product lines, growth prospects, size/scale, market position and business risks. This information is then used to determine the relevant premiums or discounts that should be applied to Ardagh Glass • For this transaction direct comparables included Owens-Illinois, Saint Gobain, Ventropak Holdings, Nihon Yamamura Glass and Anadolu Cam Sanayii DISCOUNTED CASH FLOW ANALYSIS • Discounted cashflow analysis estimates the present value of expected future cash flows along with a terminal value of the busines • We use Ardagh’s post-acquisition growth and cash flow projections PRECEEDING TRANSACTION ANALYSIS • Analysis of recent mergers, acquisitions and public offerings that have been undertaken in the same or ancillary industries. This information is used to infer implied multiples paid • For this analysis we examined 26 transactions that occurred between 2007 -2008 that were in excess of € 200 M VALUATION METHODOLOGY THE VALUATION ANALYSIS RELIES UPON THE FOLLOWING METHODOLOGIES
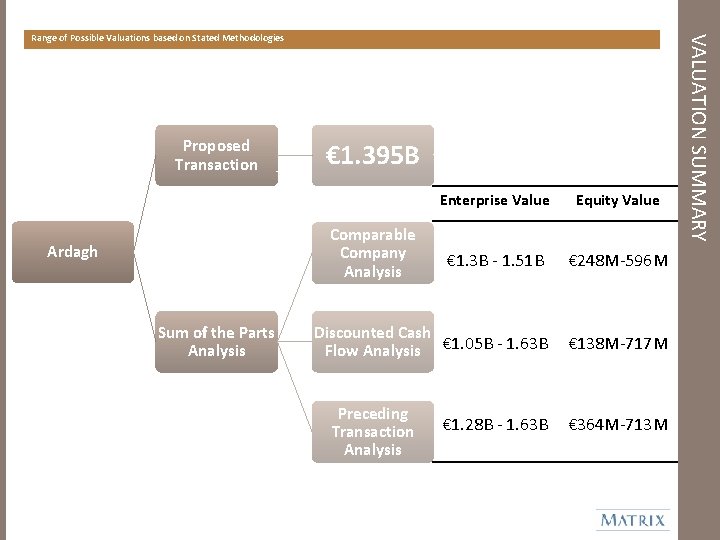
Proposed Transaction € 1. 395 B Enterprise Value Equity Value € 1. 3 B - 1. 51 B € 248 M-596 M Discounted Cash Flow Analysis € 1. 05 B - 1. 63 B € 138 M-717 M Comparable Company Analysis Ardagh Sum of the Parts Analysis Preceding Transaction Analysis € 1. 28 B - 1. 63 B € 364 M-713 M VALUATION SUMMARY Range of Possible Valuations based on Stated Methodologies
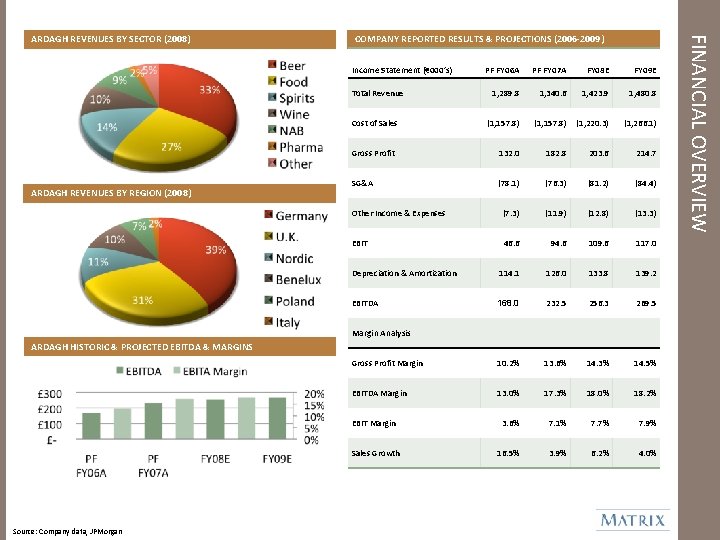
COMPANY REPORTED RESULTS & PROJECTIONS (2006 -2009) Income Statement (€ 000’s) PF FY 06 A PF FY 07 A FY 08 E FY 09 E 1, 289. 8 1, 340. 6 1, 423. 9 1, 480. 8 (1, 157. 8) (1, 220. 3) (1, 266. 1) Gross Profit 132. 0 182. 8 203. 6 214. 7 SG&A (78. 1) (76. 3) (81. 2) (84. 4) Other Income & Expenses (7. 3) (11. 9) (12. 8) (13. 3) EBIT 46. 6 94. 6 109. 6 117. 0 Depreciation & Amortization 114. 1 126. 0 133. 8 139. 2 EBITDA 168. 0 232. 5 256. 3 269. 5 Gross Profit Margin 10. 2% 13. 6% 14. 3% 14. 5% EBITDA Margin 13. 0% 17. 3% 18. 0% 18. 2% EBIT Margin 3. 6% 7. 1% 7. 7% 7. 9% Sales Growth 16. 5% 3. 9% 6. 2% 4. 0% Total Revenue Cost of Sales ARDAGH REVENUES BY REGION (2008) Margin Analysis ARDAGH HISTORIC & PROJECTED EBITDA & MARGINS Source: Company data, JPMorgan FINANCIAL OVERVIEW ARDAGH REVENUES BY SECTOR (2008)
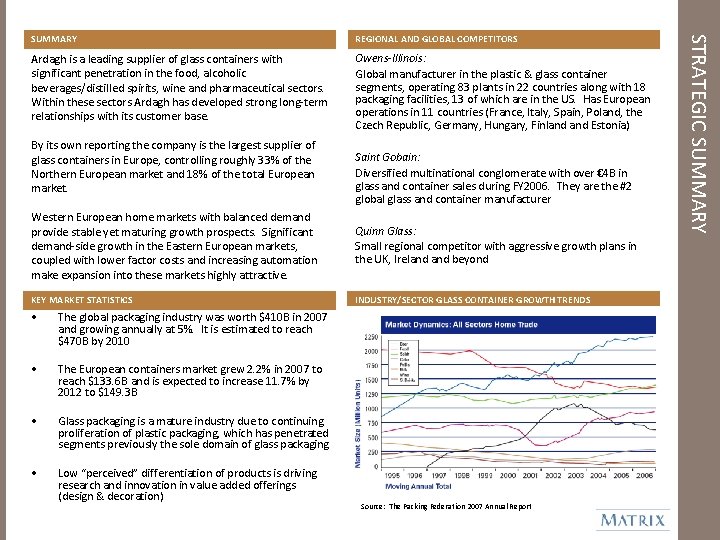
REGIONAL AND GLOBAL COMPETITORS Ardagh is a leading supplier of glass containers with significant penetration in the food, alcoholic beverages/distilled spirits, wine and pharmaceutical sectors. Within these sectors Ardagh has developed strong long-term relationships with its customer base. Owens-Illinois: Global manufacturer in the plastic & glass container segments, operating 83 plants in 22 countries along with 18 packaging facilities, 13 of which are in the US. Has European operations in 11 countries (France, Italy, Spain, Poland, the Czech Republic, Germany, Hungary, Finland Estonia) By its own reporting the company is the largest supplier of glass containers in Europe, controlling roughly 33% of the Northern European market and 18% of the total European market. Saint Gobain: Diversified multinational conglomerate with over € 4 B in glass and container sales during FY 2006. They are the #2 global glass and container manufacturer Western European home markets with balanced demand provide stable yet maturing growth prospects. Significant demand-side growth in the Eastern European markets, coupled with lower factor costs and increasing automation make expansion into these markets highly attractive. Quinn Glass: Small regional competitor with aggressive growth plans in the UK, Ireland beyond KEY MARKET STATISTICS INDUSTRY/SECTOR GLASS CONTAINER GROWTH TRENDS • The global packaging industry was worth $410 B in 2007 and growing annually at 5%. It is estimated to reach $470 B by 2010 • The European containers market grew 2. 2% in 2007 to reach $133. 6 B and is expected to increase 11. 7% by 2012 to $149. 3 B • Glass packaging is a mature industry due to continuing proliferation of plastic packaging, which has penetrated segments previously the sole domain of glass packaging • Low “perceived” differentiation of products is driving research and innovation in value added offerings (design & decoration) Source: The Packing Federation 2007 Annual Report STRATEGIC SUMMARY
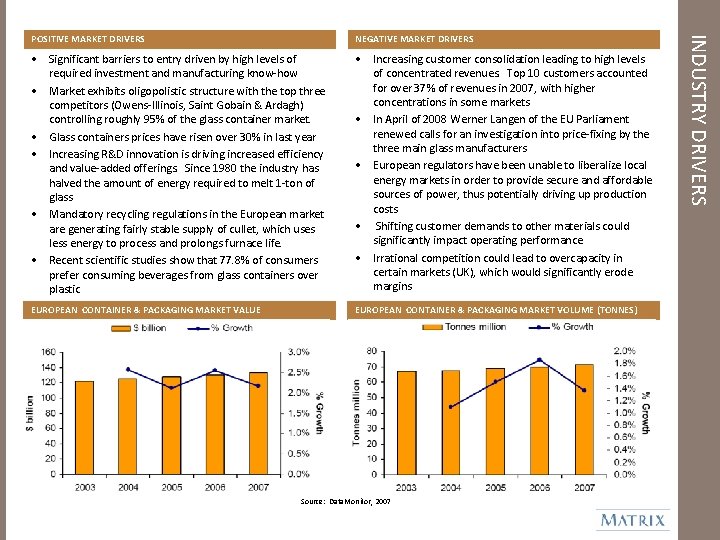
NEGATIVE MARKET DRIVERS • Significant barriers to entry driven by high levels of required investment and manufacturing know-how • Market exhibits oligopolistic structure with the top three competitors (Owens-Illinois, Saint Gobain & Ardagh) controlling roughly 95% of the glass container market. • Glass containers prices have risen over 30% in last year • Increasing R&D innovation is driving increased efficiency and value-added offerings. Since 1980 the industry has halved the amount of energy required to melt 1 -ton of glass • Mandatory recycling regulations in the European market are generating fairly stable supply of cullet, which uses less energy to process and prolongs furnace life. • Recent scientific studies show that 77. 8% of consumers prefer consuming beverages from glass containers over plastic • Increasing customer consolidation leading to high levels of concentrated revenues. Top 10 customers accounted for over 37% of revenues in 2007, with higher concentrations in some markets • In April of 2008 Werner Langen of the EU Parliament renewed calls for an investigation into price-fixing by the three main glass manufacturers • European regulators have been unable to liberalize local energy markets in order to provide secure and affordable sources of power, thus potentially driving up production costs • Shifting customer demands to other materials could significantly impact operating performance • Irrational competition could lead to overcapacity in certain markets (UK), which would significantly erode margins EUROPEAN CONTAINER & PACKAGING MARKET VALUE EUROPEAN CONTAINER & PACKAGING MARKET VOLUME (TONNES) Source: Data. Monitor, 2007 INDUSTRY DRIVERS POSITIVE MARKET DRIVERS
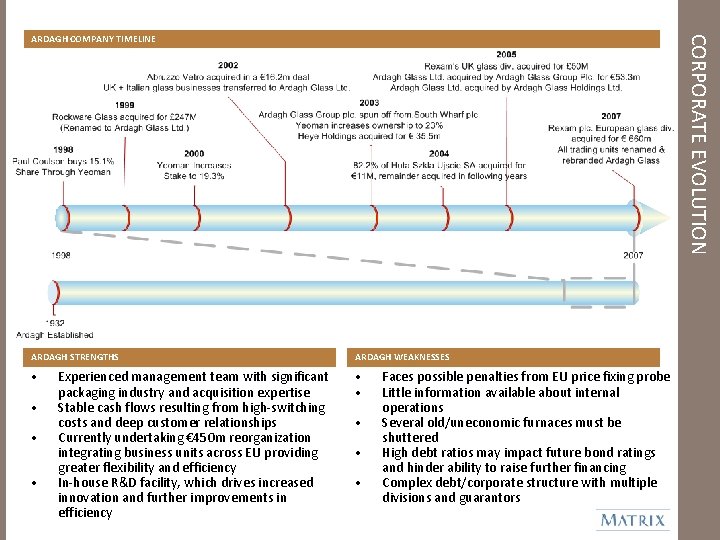
CORPORATE EVOLUTION ARDAGH COMPANY TIMELINE ARDAGH STRENGTHS ARDAGH WEAKNESSES • • • Experienced management team with significant packaging industry and acquisition expertise Stable cash flows resulting from high-switching costs and deep customer relationships Currently undertaking € 450 m reorganization integrating business units across EU providing greater flexibility and efficiency In-house R&D facility, which drives increased innovation and further improvements in efficiency • • • Faces possible penalties from EU price fixing probe Little information available about internal operations Several old/uneconomic furnaces must be shuttered High debt ratios may impact future bond ratings and hinder ability to raise further financing Complex debt/corporate structure with multiple divisions and guarantors
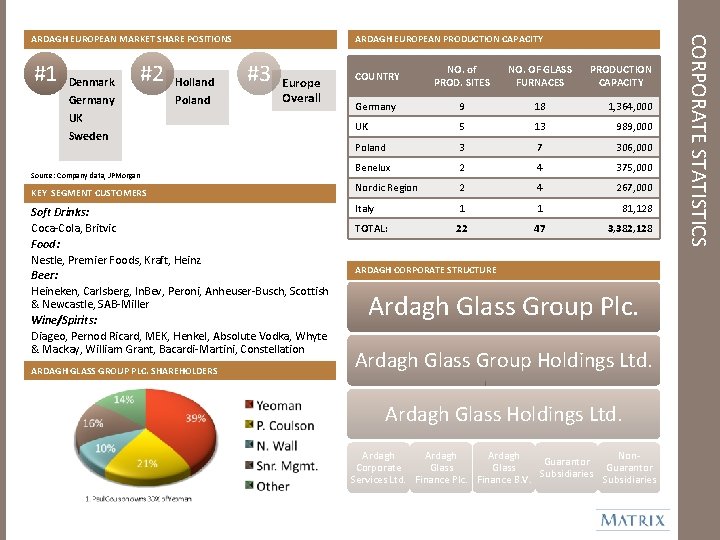
#1 Denmark Germany #2 Holland Poland ARDAGH EUROPEAN PRODUCTION CAPACITY #3 Europe Overall UK Sweden Source: Company data, JPMorgan KEY SEGMENT CUSTOMERS Soft Drinks: Coca-Cola, Britvic Food: Nestle, Premier Foods, Kraft, Heinz Beer: Heineken, Carlsberg, In. Bev, Peroni, Anheuser-Busch, Scottish & Newcastle, SAB-Miller Wine/Spirits: Diageo, Pernod Ricard, MEK, Henkel, Absolute Vodka, Whyte & Mackay, William Grant, Bacardi-Martini, Constellation ARDAGH GLASS GROUP PLC. SHAREHOLDERS COUNTRY NO. of PROD. SITES NO. OF GLASS FURNACES PRODUCTION CAPACITY Germany 9 18 1, 364, 000 UK 5 13 989, 000 Poland 3 7 306, 000 Benelux 2 4 375, 000 Nordic Region 2 4 267, 000 Italy 1 1 81, 128 TOTAL: 22 47 3, 382, 128 ARDAGH CORPORATE STRUCTURE Ardagh Glass Group Plc. Ardagh Glass Group Holdings Ltd. Ardagh Glass Holdings Ltd. Ardagh Non. Guarantor Corporate Glass Guarantor Subsidiaries Services Ltd. Finance Plc. Finance B. V. Subsidiaries CORPORATE STATISTICS ARDAGH EUROPEAN MARKET SHARE POSITIONS
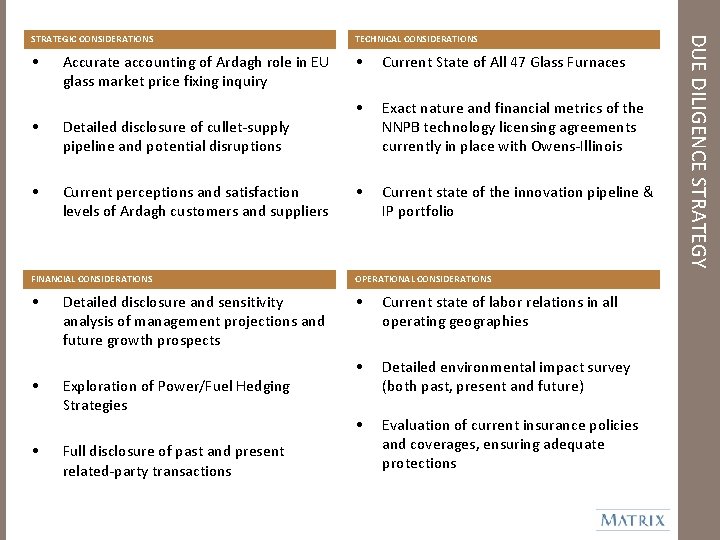
TECHNICAL CONSIDERATIONS • • Current State of All 47 Glass Furnaces • Exact nature and financial metrics of the NNPB technology licensing agreements currently in place with Owens-Illinois • Current state of the innovation pipeline & IP portfolio Accurate accounting of Ardagh role in EU glass market price fixing inquiry • Detailed disclosure of cullet-supply pipeline and potential disruptions • Current perceptions and satisfaction levels of Ardagh customers and suppliers FINANCIAL CONSIDERATIONS OPERATIONAL CONSIDERATIONS • • Current state of labor relations in all operating geographies • Detailed environmental impact survey (both past, present and future) • Evaluation of current insurance policies and coverages, ensuring adequate protections • • Detailed disclosure and sensitivity analysis of management projections and future growth prospects Exploration of Power/Fuel Hedging Strategies Full disclosure of past and present related-party transactions DUE DILIGENCE STRATEGY STRATEGIC CONSIDERATIONS
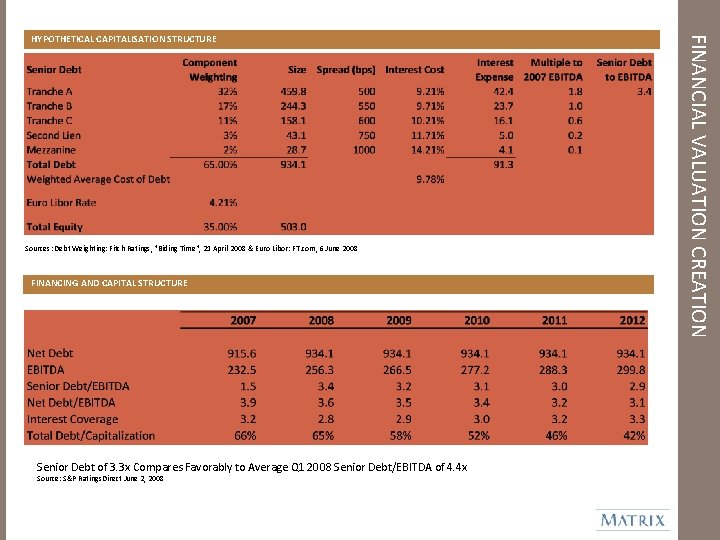
Sources: Debt Weighting: Fitch Ratings, "Biding Time", 21 April 2008 & Euro Libor: FT. com, 6 June 2008 FINANCING AND CAPITAL STRUCTURE Senior Debt of 3. 3 x Compares Favorably to Average Q 1 2008 Senior Debt/EBITDA of 4. 4 x Source: S&P Ratings. Direct June 2, 2008 FINANCIAL VALUATION CREATION HYPOTHETICAL CAPITALISATION STRUCTURE
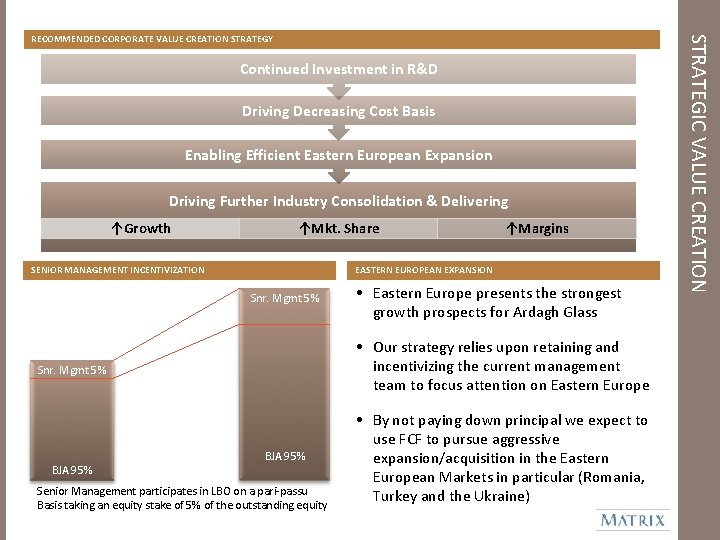
Continued Investment in R&D Driving Decreasing Cost Basis Enabling Efficient Eastern European Expansion Driving Further Industry Consolidation & Delivering ↑Growth ↑Mkt. Share SENIOR MANAGEMENT INCENTIVIZATION EASTERN EUROPEAN EXPANSION Snr. Mgmt 5% • Eastern Europe presents the strongest growth prospects for Ardagh Glass • Our strategy relies upon retaining and incentivizing the current management team to focus attention on Eastern Europe Snr. Mgmt 5% BJA 95% ↑Margins BJA 95% Senior Management participates in LBO on a pari-passu Basis taking an equity stake of 5% of the outstanding equity • By not paying down principal we expect to use FCF to pursue aggressive expansion/acquisition in the Eastern European Markets in particular (Romania, Turkey and the Ukraine) STRATEGIC VALUE CREATION RECOMMENDED CORPORATE VALUE CREATION STRATEGY
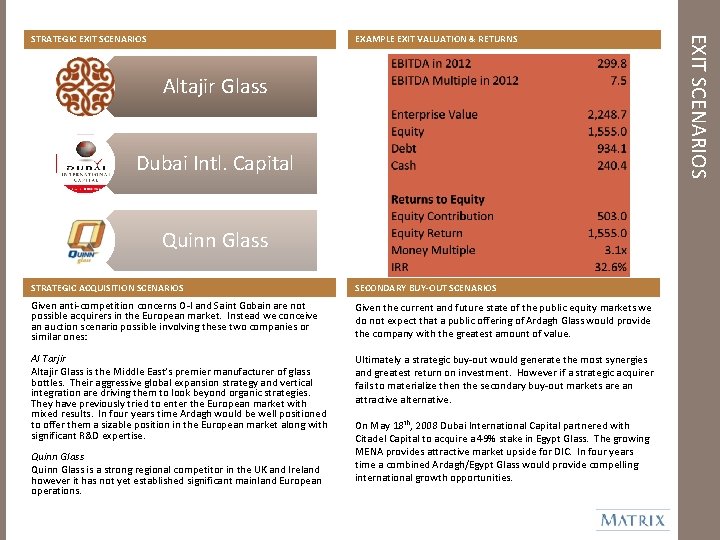
EXAMPLE EXIT VALUATION & RETURNS Altajir Glass Dubai Intl. Capital Quinn Glass STRATEGIC ACQUISITION SCENARIOS SECONDARY BUY-OUT SCENARIOS Given anti-competition concerns O-I and Saint Gobain are not possible acquirers in the European market. Instead we conceive an auction scenario possible involving these two companies or similar ones: Given the current and future state of the public equity markets we do not expect that a public offering of Ardagh Glass would provide the company with the greatest amount of value. Al Tarjir Altajir Glass is the Middle East’s premier manufacturer of glass bottles. Their aggressive global expansion strategy and vertical integration are driving them to look beyond organic strategies. They have previously tried to enter the European market with mixed results. In four years time Ardagh would be well positioned to offer them a sizable position in the European market along with significant R&D expertise. Ultimately a strategic buy-out would generate the most synergies and greatest return on investment. However if a strategic acquirer fails to materialize then the secondary buy-out markets are an attractive alternative. Quinn Glass is a strong regional competitor in the UK and Ireland however it has not yet established significant mainland European operations. On May 18 th, 2008 Dubai International Capital partnered with Citadel Capital to acquire a 49% stake in Egypt Glass. The growing MENA provides attractive market upside for DIC. In four years time a combined Ardagh/Egypt Glass would provide compelling international growth opportunities. EXIT SCENARIOS STRATEGIC EXIT SCENARIOS
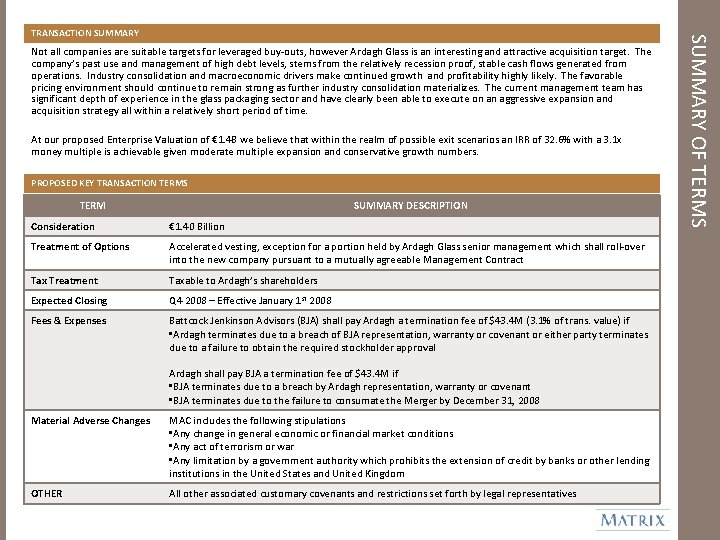
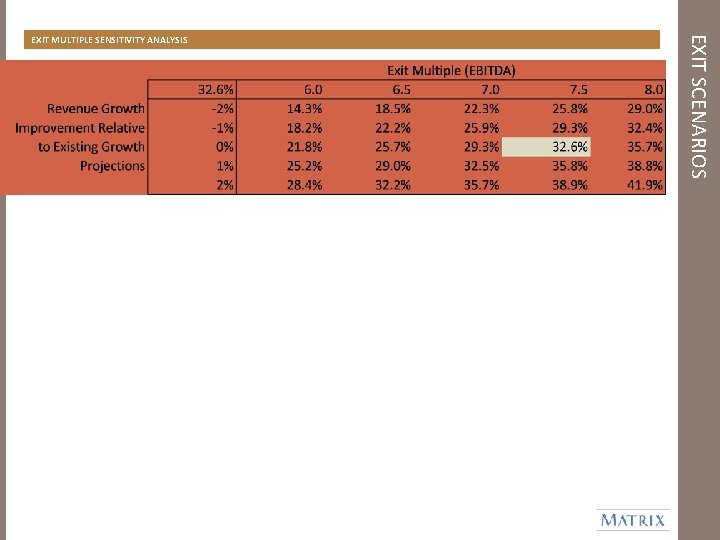
Not all companies are suitable targets for leveraged buy-outs, however Ardagh Glass is an interesting and attractive acquisition target. The company’s past use and management of high debt levels, stems from the relatively recession proof, stable cash flows generated from operations. Industry consolidation and macroeconomic drivers make continued growth and profitability highly likely. The favorable pricing environment should continue to remain strong as further industry consolidation materializes. The current management team has significant depth of experience in the glass packaging sector and have clearly been able to execute on an aggressive expansion and acquisition strategy all within a relatively short period of time. At our proposed Enterprise Valuation of € 1. 4 B we believe that within the realm of possible exit scenarios an IRR of 32. 6% with a 3. 1 x money multiple is achievable given moderate multiple expansion and conservative growth numbers. PROPOSED KEY TRANSACTION TERMS TERM SUMMARY DESCRIPTION Consideration € 1. 40 Billion Treatment of Options Accelerated vesting, exception for a portion held by Ardagh Glass senior management which shall roll-over into the new company pursuant to a mutually agreeable Management Contract Tax Treatment Taxable to Ardagh’s shareholders Expected Closing Q 4 2008 – Effective January 1 st 2008 Fees & Expenses Battcock Jenkinson Advisors (BJA) shall pay Ardagh a termination fee of $43. 4 M (3. 1% of trans. value) if • Ardagh terminates due to a breach of BJA representation, warranty or covenant or either party terminates due to a failure to obtain the required stockholder approval Ardagh shall pay BJA a termination fee of $43. 4 M if • BJA terminates due to a breach by Ardagh representation, warranty or covenant • BJA terminates due to the failure to consumate the Merger by December 31, 2008 Material Adverse Changes MAC includes the following stipulations • Any change in general economic or financial market conditions • Any act of terrorism or war • Any limitation by a government authority which prohibits the extension of credit by banks or other lending institutions in the United States and United Kingdom OTHER All other associated customary covenants and restrictions set forth by legal representatives SUMMARY OF TERMS TRANSACTION SUMMARY
APPENDIX
Source: Thomson One Banker/World. Scope Financial Snapshot Report - search for SIC code 3221 (glass containers) with turnover > $200 m , public companies, active COMPARABLES ANALYSIS DETAILED COMPARABLES ANALYSIS
Source: Company data, JP Morgan DISCOUNTED CASH FLOW ANALYSIS Discounted Cash Flow
WEIGHTED-AVERAGE COST OF CAPITAL ANALYSIS Source: Company data, JP Morgan SENSITIVITY & WACC ANALYSIS DISCOUNTED CASH FLOW SENSITIVITY ANALYSIS
Source: Thomson One Banker M&A database - search for completed deals > $200 m , effective date from 01/01/2007 - 31/05/2008 PRECEDING TRANSACTIONS PRECEEDING TRANSACTIONS DETAILED ANALYSIS
EXIT SCENARIOS EXIT MULTIPLE SENSITIVITY ANALYSIS
These materials were designed for use by specific persons familiar with the business and the affairs of your company and MATRIX assumes no obligation to update or otherwise revise these materials. Nothing contained herein should be construed as tax, accounting or legal advice. You (and each of your employees, representatives or other agents) may disclose to any and all persons, without limitation of any kind, the tax treatment and tax structure of the transactions contemplated by these materials and all materials of any kind (including opinions or other tax analyses) that are provided to you relating to such tax treatment and structure. For this purpose, the tax treatment of a transaction is the purported or claimed U. S. federal income tax treatment of the transaction and the tax structure of a transaction is any fact that may be relevant to understanding the purported or claimed U. S. federal income tax treatment of the transaction. MATRIX has adopted policies and guidelines designed to preserve the independence of its research analysts. MATRIX’s policies prohibit employees from directly or indirectly offering a favorable research rating or specific price target, or offering to change a research rating or price target, as consideration for or an inducement to obtain business or other compensation. MATRIX’s policies prohibit research analysts from being compensated for their involvement in investment banking transactions except to the extent such participation is intended to benefit investor clients. LEGAL DISCLOSURE These materials have been provided to you by MATRIX Partners ("MATRIX") in connection with a fictitious potential engagement and may not be used or relied upon for any purpose other than as specifically contemplated by a written agreement with MATRIX. In addition, these materials may not be disclosed, in whole or in part, or summarized or otherwise referred to except as agreed in writing by MATRIX. The information used in preparing these materials was obtained from or through you or your representatives or from public sources. MATRIX assumes no responsibility for independent verification of such information and has relied on such information being complete and accurate in all material respects. To the extent such information includes estimates and forecasts of future financial performance (including estimates of potential cost savings and synergies) prepared by or reviewed or discussed with the managements of your company and/or other potential transaction participants or obtained from public sources, we have assumed that such estimates and forecasts have been reasonably prepared on bases reflecting the best currently available estimates and judgments of such managements (or, with respect to estimates and forecasts obtained from public sources, represent reasonable estimates).