APHG REVIEW PART III INDUSTRY ECONOMIC ACTIVITIES Primary


 •")


 B. Zone in transition C. Zone of")


- Slides: 31
APHG REVIEW PART III
INDUSTRY
ECONOMIC ACTIVITIES • Primary • Raw Materials: Agriculture, mining, fishing, and forestry • Secondary • Manufacturing: capital (for industry) and consumer goods These three levels are often subdivided within the economic activity group “tertiary” as services may be utilized by both consumers & producers. • Tertiary • Consumer: retail and personal services; entertainment • Quaternary • Business/Producer services: trade, insurance, banking, advertising, transportation and information services • Quinary • Public (government) Services: health, education, research, transportation, tourism & recreation
COTTAGE INDUSTRY • Home-based manufacturing found mainly before the IR.
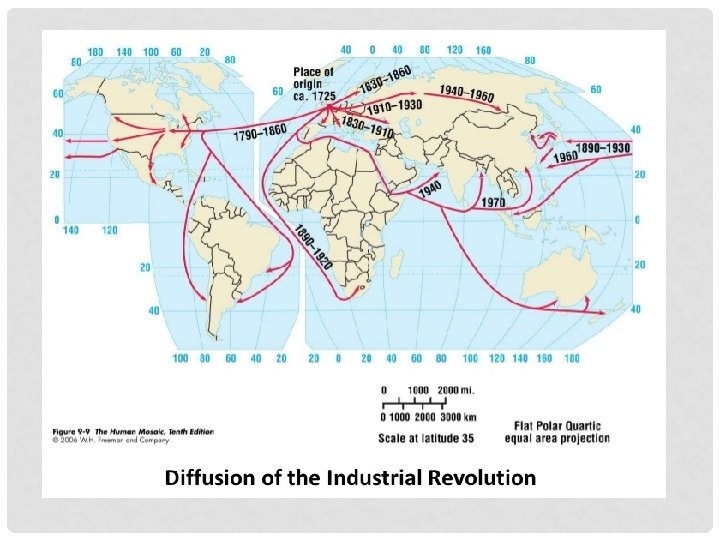
INDUSTRIAL REVOLUTION 1760 -1850 • Series of improvements in industrial technology that transformed the process of manufacturing goods. • Started in England, diffused to Western Europe and then to the United States by 1825. • Large Coal deposits were an integral part of the start and diffusion of the IR.
DIFFUSION OF THE INDUSTRIAL REVOLUTION TO MAINLAND EUROPE • Early 1800 innovations diffused to mainland Europe, Germany and the low countries. • Proximity to coal fields • Proximity to water • Later 1800 innovations • Location criteria included proximity to railroads. London and Paris became big centers of Industry
INDUSTRIAL REVOLUTION HEARTHS • Fig. 11 -1: The Industrial Revolution originated in areas of northern England. Factories often clustered near coalfields
MANUFACTURING REGIONS Fig. 11 -3: The world’s major manufacturing regions are found in North America, Europe, and East Asia. Other manufacturing centers are also found elsewhere.
WEBER’S LEAST COST THEORY • Where should an industry be located?
3 MAJOR FACTORS THAT DETERMINE LOCATION OF MANUFACTURING • 1. Transportation (most important) • Raw materials (inputs) to factory • Finished goods (outputs) to market • Distance and weight most important factors. • 2. Labor • High labor costs reduce profit • May locate farther from inputs/ market if cheap labor can make up for added transport costs. • 3. Agglomeration • Similar businesses cluster in the same area. • Businesses support each other, reduce costs
Bulk Reducing Heavier input, shorter distance to plant • Input Factory • Input Lighter output, longer distance to market, lo Factory Market Lighter input, longer distance to plant. Bulk Gaining Heavier output, shorter distance to market
AGGLOMERATION • The concept industries clump together for mutual advantages. • Grouping together of many firms from the same industry in a single area for collective or cooperative use of infrastructure and sharing of labor resources • Example: Silicon Valley (also called in APHG a technopole)
SILICON VALLEY
URBAN PATTERNS
BURGESS’ LAND USE MODEL DEVELOPED IN THE 1920 S • As used in urban areas: society within an urban area is often arranged in a series of concentric rings in positions defined by social factors. • The most expensive land is often in the center the city and the land on the edge of the city is cheaper. • Cities grew outwards from the original site so the oldest buildings would be in the middle of the city and the youngest would be on the edge.
BURGESS MODEL A. Central Business District (CBR) B. Zone in transition C. Zone of independent workers' homes D. Zone of better residences E. Commuter's Zone
BID RENT CURVE • Space for downtown commercial real estate is sold or leased by the square foot. By comparison, land in the suburbs is sold by the acre. Along the curve you could plot different land uses. • Land for a suburban home or space for a suburban apartment building are not that much different in price. However, land for that apartment building and land for building downtown is vastly different in price. The bid-rent curve represents the cost-to-distance relationship of real estate prices in the urban landscape. The closer one moves toward the peak land or CBD, the more expensive the price for CBD land.
RANK-SIZE DISTRIBUTION OF SETTLEMENTS • Geographers observe that ranking cities/towns from largest to smaller population produces a regular pattern of hierarchy. • This is the Rank-Size Rule. The country’s nth-largest settlement is 1/n the population of the largest settlement. • In other words, the second-largest city is one-half the size of the largest, the fourth-largest city is one-fourth the size of the largest, and so on. • The United States’ cities follow Rank-Size Rule. New York is largest, ½ of New York is Los Angeles, a 1/3 of New York is Chicago, a ¼ of New York is Philadelphia, etc.
RANK-SIZE DISTRIBUTION
PRIMATE CITY DISTRIBUTION OF SETTLEMENTS • If the settlement hierarchy does not graph as a straight line, then the country does not have a rank-size distribution of settlements. • Instead, it may follow the primate city rule. This is where the largest settlement has more than twice as many people as the second-ranking settlement. In this distribution, the country’s largest city is called the primate city. • Denmark: Copenhagen is the primate city with 1 million inhabitants. The second largest is Arhus with only 200, 000. • United Kingdom/England: London has 8 million, whereas as Birmingham, the second-largest – has only 2 million.
THE THREE URBAN LAND USE MODELS
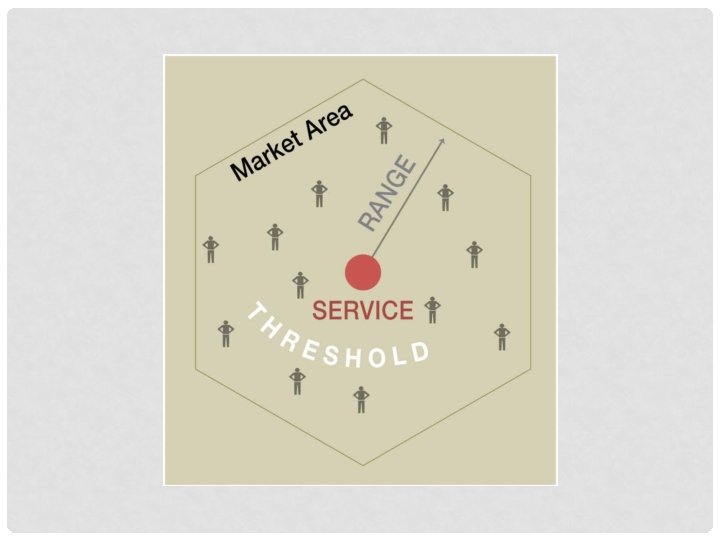
CENTRAL PLACE THEORY WALTER CHRISTALLER • Theory explains how the most profitable location can be identified. • A central place is a market center for the exchange of goods and services by people attracted from the surrounding area. • Businesses in central places compete against each other to serve as markets for goods and services for the surrounding region. • Market area or Hinterland The area surrounding a service from which customers are attracted • To establish a market area, a circle is drawn around the node of a service on a map. The territory around the circle is its market area.
SERVICES TERTIARY SECTOR OF ECONOMIC ACTIVITIES
TYPES OF SERVICES -Public -Consumer Services -Business
TYPES OF SERVICES
RANGE OF SERVICE • Maximum distance people are willing to travel to use a service. • People are willing to go only a short distance for everyday consumer services, such as groceries and pharmacies. • But they will travel longer distances for other services such as a concert or professional ball game. • Therefore, the range of a service must be determined from the radius of a circle that is irregularly shaped rather than perfectly round. The irregularly shaped circle takes in the territory for which the proposed site is closer than competitors’ sites.
THRESHOLD OF A SERVICE • The minimum number of people/customers needed to support the service in order to make a profit. • Once the range has been determined, a service provider must determine whether a location is suitable by counting the potential customers inside the irregularly shaped circle. • How expected consumers inside the range are counted depends on the product. – Convenience stores and fast-food restaurants appeal to nearly everyone, whereas other goods and services appeal primarily to certain consumer groups.
SERVICES IN CBDS • Public Services • City hall, state agencies and libraries • Sports facilities (stadiums) • Business Services • Banking, finance, journalism, law firms • Consumer Services • Retail stores with HIGH TRESHOLD and HIGH RANGE • Retail services for downtown workers.