Unit 7 Cities and Urban Land Use Cities

Unit 7 Cities and Urban Land Use

Cities are everywhere

Physical City �Is a continuous development that contains a central city, many nearby cities, towns and suburbs.
- earliest cities, predating written")
Social Classification-Sjoberg Cities change over time � 1. Folk- (preliterate)- earliest cities, predating written language. � 2. Feudal- During the middle ages- dependent relationship between wealthy land owners and peasants. � 3. Preindustrial- little machine technology, people and animals form basis for economic production. � 4. Urban- industrial- W. Europe, America, Japan. Production through machines, and energy sources from fossil fuels and atomic power.

Function and Location of Ancient Cities � Functions of cities included: ◦ Centers of power-headquarters of early heads of state. ◦ Religious centers-priests, temples and shrines located in cities. ◦ Economic centers-markets for trade, wealthy merchants, land livestock owners, traders operating and living in urban areas. ◦ Educational centers-city residents included teachers and philosophers to educate the urban elite.

City

Urban Growth in China � Huang River and its tributaries. � Han Dynasty as large as the Roman Empire.

Medieval, Preindustrial and Industrial World Cities

Medieval cities � The largest settlements were centers of government, church and markets. � Roads connected to hinterlands. � Most cities were surrounded by walls. � Streets were narrow and winding. � Occupational groups were clustered together. � Ethnicity defined communities and sought to keep out people who differed from themselves. � “ghetto” first described the segregation of Jews in Venice.

Urbanization and Mediterranean � City-states-self-governing the nearby countryside. � Greeks communities that included ◦ Athens-first city to reach 100, 000 in population. ◦ Urban empire included large parts of the interior of Europe along with Mediterranean shores. � Phoenicians-N. Africa/SW Asia � Romans � The cities were connected by a network of land sea routes.

Preindustrial Cities. � Urban centers for culture. � Mark Jefferson named them: Primate Cities –larger in other cities in the area and representing national culture. ◦ Kyoto-old Japan ◦ Paris-French culture ◦ London-all that is English.

Preindustrial Cities � Mercantile City-where trade became central to the city design. ◦ No matter where the city was located, it’s central square was fronted by government and religious buildings, housing for the rich. ◦ Streets leading to the square were arteries of commerce, lined with shops that specialized in products brought by the trade routes. ◦ Ex. London, Lisbon, Amsterdam

Industrial Revolution Cities

Industrial Revolution � Created the Manufacturing City ◦ Factories attracted workers from rural areas. In some countries tenements were constructed for worker housing. ◦ Broad, straight boulevards to accommodate the flow of commercial traffic, eventually cars. ◦ Developers divided cities into regular sized lots as land was a commodity to be bought and sold. ◦ Some cities retained their historic square, others lost organization. ◦ Problems of sanitation, overcrowding, pollution and disaray.

Cities � Modern City- Little attention is paid building aesthetics or design. Multiple CBD’s and disbursed suburbs. The Hallmark of American Life. � Postmodernism- city spaces become more people friendly � Edge City- characterized by extensive office and retail space ◦ 1950’s-60’s- suburbanization ◦ 1970 -80’s- malls ◦ 1990 -2000’s- big box retailers

Urbanization � Process by which cities grow. This has two dimensions: ◦ An increase in the number of people living in cities. ◦ An increase in the percentage of people living in cities.

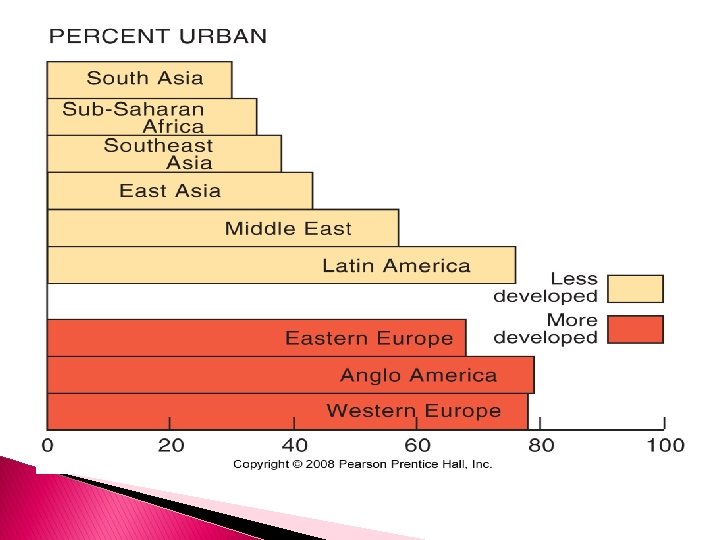
Percent living in urban areas. More developed countries have higher % in urban areas.

Urbanized area � 80% of USA lives in urbanized areas ◦ 30% in central cities ◦ 50% surrounding jurisdictions

Cities with 3 million or more
 An MSA includes the following: 1. An urbanized area with")
Metropolitan Statistical Area (MSA) An MSA includes the following: 1. An urbanized area with a population of at least 50, 000. 2. The county within which the city is located. 3. Adjacent counties with a high population density and a large percentage of residents working in the central city’s county.

Micropolitan Statistical Area � Urbanized area between 10, 000 and 50, 000. � The county in which it is found adjacent counties tied to the city

Megalopolis

Megalopolis § Adjacent MSA’s overlap. A county between two central cities may send large number of commuters to jobs in each. Megalopolis-Greek word meaning “Great City” § Boswash Corridor § §
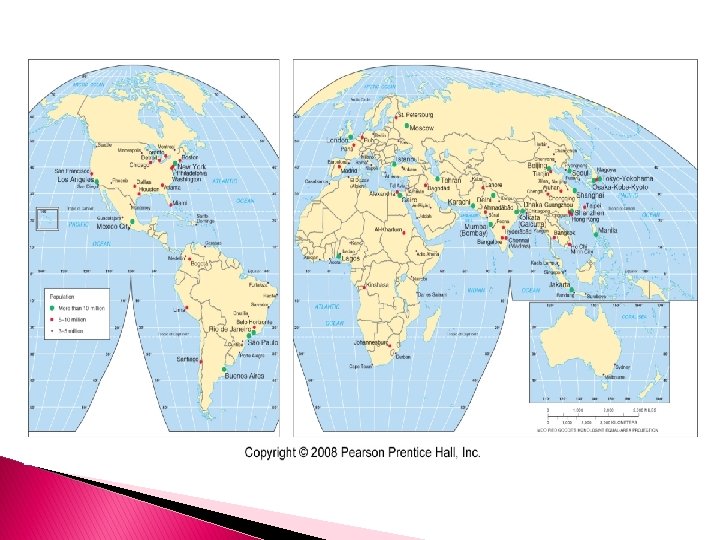

World’s 26 Largest Cities � 1. Tokyo-Yokohama, Japan 33, 200, 000 2. New York, United States 17, 800, 000 3. Sao Paulo, Brazil - 17, 700, 000 4. Seoul-Incheon, South Korea 17, 500, 000 5. Mexico City, Mexico - 17, 400, 000 6. Osaka-Kobe-Kyoto, Japan 16, 425, 000 7. Manila, Philippines - 14, 750, 000 8. Mumbai, India (formerly Bombay) - 14, 350, 000 9. Jakarta, Indonesia - 14, 250, 000 10. Lagos, Nigeria - 13, 400, 000 11. Kolkata, India (formerly Calcutta) - 12, 700, 000 12. Delhi, India - 12, 300, 000 13. Cairo, Egypt - 12, 200, 000 � 14. Los Angeles, United States 11, 789, 000 15. Buenos Aires, Argentina 11, 200, 000 16. Rio de Janeiro, Brazil 10, 800, 000 17. Moscow, Russia - 10, 500, 000 18. Shanghai, China - 10, 000 19. Karachi, Pakistan - 9, 800, 000 20. Paris, France - 9, 645, 000 21. Nagoya, Japan - 9, 000 (tie) 21. Istanbul, Turkey - 9, 000 (tie) 23. Beijing, China - 8, 614, 000 24. Chicago, United States 8, 308, 000 25. London, United Kingdom 8, 278, 000 26. Shenzhen, China - 8, 000

Ancient cultural hearths

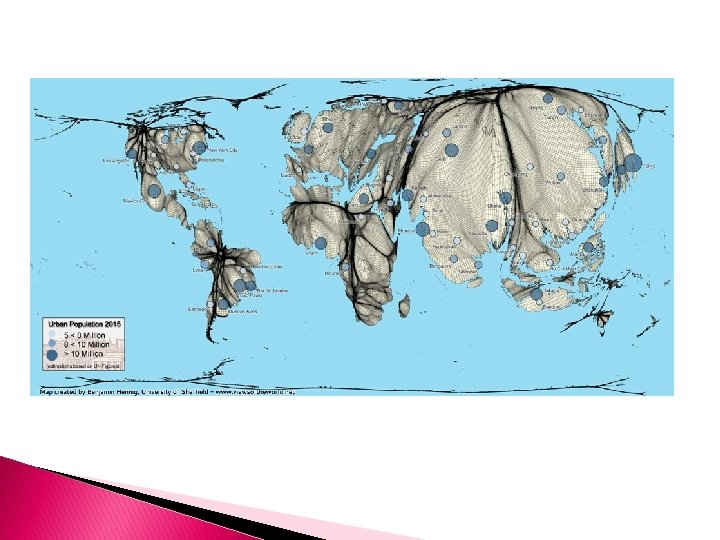
World Cities and Megacities � In the place of great manufacturing cities are modern world cities that have become centers of business, consumer and public sectors.

Megacity � LDC’s � Large, chaotic, unplanned sprawling growth � Pollution � Widespread poverty

Megacities � Coined by the United Nations in the 1970’s for cities over 10 million. � House new arrivals in overpopulated apartment buildings, tenements or slums. � Shantytowns have grown up around many. � Lack of zoning allows the very wealthy to live next to the very poor.

Urban Hierarchyfrom smallest to largest v Hamlet-cluster of farmer’s houses with a few basic services. v Village-smallest urban settlement. Several dozen services more specialized than a hamlet. v Town-has more specialized function. May have a bank, post office, hospital, schools. Towns have a hinterland-smaller villages or hamlets economically dependent on it. v City-large population, functional specialization. Well defined central business district. v Megalopolis-multiple cities that have grown together.

Urban Components � CBD- Central Business district � Central City- urban area that is not suburban � Ghetto- inner city that has become dilapidated � Node- centers of activity � Suburb- residential communities � Exurb- ring of prosperous communities beyond the suburbs

CBD-Downtown � Retail ◦ High end shops ◦ Retail services such as malls, grocery stores ◦ Business services � High cost of land ◦ Tokyo-$500 million/sq acre ◦ Intensive land use ◦ skyscrapers � Excluded activities ◦ Declining manufacturing ◦ Lack of residents

Bid Rent theory � How the price and demand for real estate changes as the distance from the Central Business District (CBD) increases. It states that different land users will compete with one another for land close to the city centre.

Urban Influence Zones � Areas outside the city that are affected by it. � How big an area, depends on the city. The urban hierarchy is at work.

Rural to Urban Migration and Urban Growth Ø ¾ of people in developed countries live in cities. Ø Urbanization in the USA ◦ 1800 -5% urbanized----1950 -20% � Migration urban to rural has increased in less developed countries in Asia, Africa and Latin America. ◦ By 2000, 32 of the 48 cities with populations over 5 million were in less developed nations. � All countries have in common: ◦ The proportion of people living in cities is rising. ◦ Cities themselves are large and growing.

Functions of Cities � Urban centers are functionally connected to other cities and to rural areas. ◦ Transportation centers-major routes converge. ◦ Special function cities-engaged in manufacturing, mining, or recreation. ◦ Central places-provide goods and services for the surrounding areas. ◦ Cities carry out activities that are necessary simply to support itself.

The economic base of cities � Export activities-produce goods and services for outside the city. They are the basic sector of the city’s economy. � Non-basic or service sector- produce goods or services for the residents of he city itself. � Base ratio-ration between workers employed in basic and non basic sector. The larger the city the larger the ratio of non-basic workers. ◦ Multiplier effect-new basic sector employment is accompanied by a larger share of non-basic workers. Decreasing the ratio of basic to non-basic workers.

Economic base

Gravity Model � The gravity model of migration is a model in urban geography derived from Newton's law of gravity, and used to predict the degree of interaction between two places. � The gravity model can be used to estimate: � Traffic flow � Migration between two areas � The number of people likely to use one central place

Gravity Model Expanded � The gravity model was expanded by William J. Reilly in 1931 into Reilly's law of retail gravitation to calculate the breaking point between two places where customers will be drawn to one or another of two competing commercial centers.

Gravity Model � Population 1 X Population 2 distance ^2 The greater the number the greater the bond between the two places.

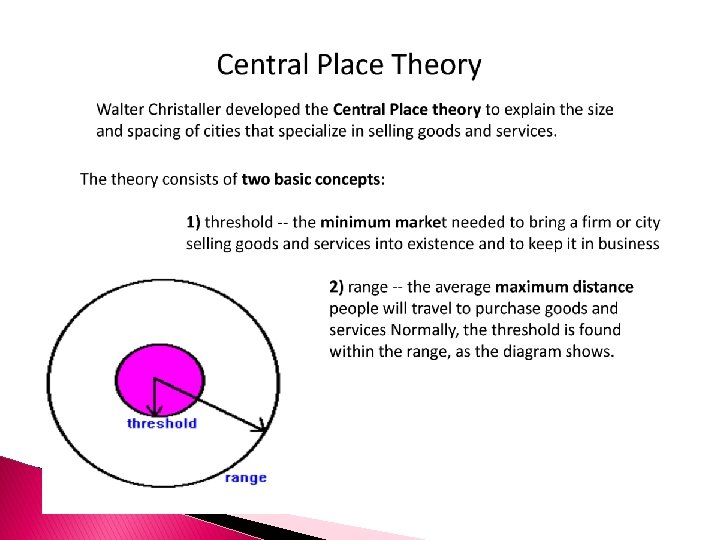
Models of Urban Systems �Two theories of settlement geography or patterns of settlement on the earth’s surface. ◦ Rank-size rule. ◦ Christaller’s Central Place Theory

Rank Size Rule � Rank size ordering describes patterns of urban sizes in complex economies where urbanization is well established. � Tells us that the nth largest city will be 1/n the size of the larges city. ◦ Example the 2 nd largest city will be ½ the size of the first largest city. ◦ In some countries the primate city so dominates that no other cities fit the rank size order.

� Within the central place system, there are five sizes of communities. A hamlet is the smallest and is a rural community which is too small to be considered a village. Cape Dorset (population 1200), located in Canada's Nunavut Territory is an example of a hamlet. The rank order of central places is: � • Hamlet � • Village � • Town � • City � • Regional Capital � Examples of regional capitals would include Paris, France or Los Angeles, California. These cities provide the highest order goods possible and have a huge hinterland.

Central place Theory

Central Place Theory
 Christaller stated that humans will")
Two assumptions were made about human behavior: � 1) Christaller stated that humans will always purchase goods from the closest place that offers the good, and � 2) whenever demand for a certain good is high, it will be offered in close proximity to the population. When demand drops, so too does the availability of the good.
Stages in the Evolution of a City 1. 2. 3. 4. Sail-Wagon")
John Borchert (1967)Stages in the Evolution of a City 1. 2. 3. 4. Sail-Wagon Epoch (1790 -1830)-trade took ships across the ocean or along shorelines, wagons overland. Technologies determined job opportunities of people that came to work in cities. Iron-Horse Epoch (1830 -1870)-railroad technology changed the nature of trade and employment. Street-Rail Epoch(1870 -1920)-the steel industry transformed urban America and job opportunities of workers. Auto-Air-Amenity Epoch (1920’s-1960’s)-internal combustion engine came to dominate life styles, employment opportunities and the economic base of cities.

Internal Cities � Geographers analyze the internal land spaces of cities and the various uses that it serves. � Cities are often arranged in similar ways, allowing geographers to develop models of urban land use. � The models are influenced by: ◦ ◦ Accessibility High cost of accessible space Transportation Societal and cultural needs.

Internal cities � Accessibility ◦ Functions of cities be fulfilled in spaces accessible to its inhabitants. Ex. High density housing within walking distance of workers during the Industrial Revolution. � High cost of accessible space ◦ The cost of land ↑ as available land↓ ◦ Mass transportation allowed the amount of useable space to grow. ◦ Population density pushes the cost of land other commodities higher.

Internal Cities � Transportation ◦ Lines of transportation determine the growth of a city. ◦ Land with highest accessibility is the most desirable and generally the most expensive. � Societal and cultural needs. ◦ Economic competition determines land use. ◦ Some highly desirable land is usually set aside for parks, schools, libraries. Look at Central Park in NYC

Models of Urban Land Use

Models of Urban Land Use � Three different models developed to explain land use within cities. � The 3 models were all developed in Chicago, with flat land only Lake Michigan to disrupt the landscape. � The three models: ◦ Concentric Zone ◦ Sector ◦ Multiple Nuclei Models

Concentric Zone Model � Created in 1923 � Sociologist EW Burgess � It views cities growing outward from a central area in a series of concentric rings.

Concentric Zones

Concentric Zones � Zone 1 -CBD, nonresident activities, property costs↑. � Zone 2 -Zone in transition, light industry, housing for poor, services in transition between CBD and residential areas in outer zones. Housing formerly occupied by the wealthy, who have moved farther out. Industry in Zone 2 are too large to fit into Zone 1, owners seeking cheaper land. � Zone 3 -working class homes, modest older homes on smaller lots. Housing is less expensive than outer rings.

Concentric Zones � Zone 4 -homes are larger and more expensive. Middle class single family homes or high rent apartments. These persons choose location and afford high cost of transportation to the CBD. � Zone 5 -commuter zone, farthest from CBD. Beyond continuous built up area. People live in small villages where they spend leisure and sleep hours and commute to the CBD.

Concentric Zone � Burgesses model is dynamic. � Invasion and succession explains the changes to the model. ◦ Poorer inhabitants drive wealthy farther out from the center of the city.

Sector Model Homer Hoyt 1939 Land Economist

Sector Model � Cities develop in a series of sectors. � Sectors develop by environmental factors or by chance. � As cities grow, activities expand outward like a wedge. � Once an area is established for industry, other industry will cluster around it. � Wealthy areas attract wealthy. Middle class live next to wealthy.

Sector Model

Multiple Nuclei Model C. D. Harris and E. L. Ullman Developed in 1945

Multiple Nuclei Model � Harris and Ullman � Explains that large cities develop by spreading from several nodes of growth, not just one. � Individual nodes have special functions � This model explains that incompatible land use activities do not cluster in the same location. � Nodes influence the type of development that occurs around them. � This model explains then clusters come into contact, incompatible land uses will develop along juncture lines.

Multiple Nuclei Model

Summary � All 3 models help explain not only land use, but the different social characteristics of people living in areas of a city. � These models may be used along with census information. � Census tracts-division of urban land areas in the USA. ◦ Approximately 5, 000 people ◦ Correspond to neighborhood boundaries.

Peripheral Model � North American Cities follow this model. � Created by Chauncy Harris-created the multiple nuclei model. � Strong desire for suburban living ◦ Families with children ◦ Amenities ◦ More space, play and protection than city

Peripheral Model

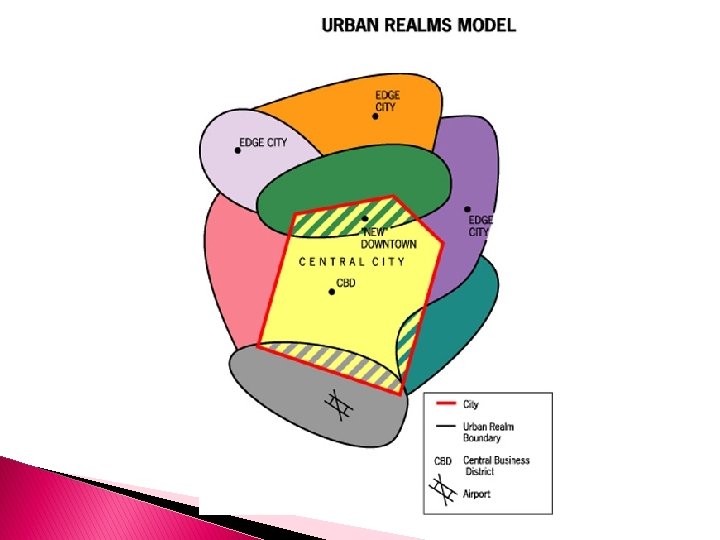
Urban Realms Model James E Vance

Urban Realms Model � Cities are made up of small “realms” which are selfsufficient urban areas with independent focal points. � This model does a good job at explaining suburban growth and how certain functions that are normally found in the CBD can be moved to the suburbs (such as shopping malls, hospitals, schools, etc. ) � These functions diminish the importance of the CBD and instead create distant realms that accomplish approximately the same thing.

Urban Sprawl � Progressive spread of development over the landscape. � Greenbelts-rings of open space can fight urban development. London is an example.

Development

Zoning Ordinances � Encourage spatial segregation. � Prevents mixed land uses within the same district. � This is a form of suburban segregation. ◦ Vertical segregation is replaced by territorial segregation. ◦ Legally requirements such as lot size, prohibition of apartments, prevent many low income families from living in the suburbs.

Planning for growth � Urban redevelopment ◦ Revitalization of downtown areas �Gentrification-middle class people drawn to renovated areas. ◦ Expensive condos replacing low income housing. ◦ Poor even further displaced. �New public housing with less population density. � Smart growth ◦ Produce a pattern of controlled development. ◦ Protect rural lands for agriculture, wildlife and recreation ◦ Urban growth areas designated by the local governments.

Gentrification

Planning Problems � Redlining- It describes the practice of making a red line on a map to delineate the are where banks would not invest; later the term was applied to discrimination against a particular group of people (usually by race or sex) no matter the geography. � Racial Steering- real estate agents guide prospective buyers towards or away from predominantly white or affluent areas. � Blockbusting- white families would sell their houses when a black family moved into the neighborhood fearing a loss of property values

Ghettoization � Forced segregation limits residential choices, ethnic or racial minorities may be confined to older, low-cost housing areas typically close to the city center. � Patterns of ghettoization have differed by region

Squatter settlement it is considered as a residential area in an urban locality inhabited by the very poor who have no access to tenured land of their own, and hence "squat" on vacant land, either private or public.

Squatter Settlement Slums, Slums 2

Inner City Social Problems � Underclass-inner city residents who are trapped in an unending cycle of economic and social problems. ◦ ◦ ◦ Lack of job skills Homeless Poverty Crime Racial Segregation Annexation- legally adding land to the city

Concerns for Urbanization � Sprawl-outlying areas farther out � Loss of soil- farmland lost. USA 1 million acres/year � Land use- less land more pavement � Pollution- air, water and soil � Waste- garbage, sewage � Consumer habits- use more energy, food

Transportation and Infrastructure Cities and Urban Land Used

Infrastructure � Refers to all the facilities that support basic economic activities to such a degree that a city cannot function without them. � Transportation impacts the demographic layout and function including: ◦ Motor vehicles �About ¼ of city land allocated to roads and parking lots. ◦ Public transportation �Busses, rail, subway

Public Transportation

Comparative Urbanization How do worldwide cities compare to American cities?

Comparative Urbanization � European ◦ ◦ ◦ Cities Wealthy live close to town Small yards if any, parks are popular Wealthy have weekend homes. European suburbs are centers for crime, violence, drug dealing. Suburb residents are often immigrants from Africa or Asia who face discrimination or prejudice in larger society.

Comparative Urbanization � Latin American Cities ◦ Faster growth today ◦ CBD main focus of business, employment and entertainment. ◦ Socioeconomic levels and housing decrease in quality as distance from the center city increases. ◦ Disamenity sector is a relatively stable slum area that radiates from the central market to the outermost zone of periphery squatter settlements that consist of high density shantytowns.

Layout of Latin American City

Comparative Urbanization � SE Asian Cities ◦ Asia’s urban growth is explosive ◦ Sectors and zones that radiate from a port zone. Many still focus on exporting goods. � African Cities ◦ Northern Africa-Islamic influence, mosque in the center, marketplace or bazaar. CBD, strong ethnic neighborhoods ◦ Southern Africa-Western due to colonization by Europe. Squatter settlements on the outskirts

Comparative Urbanization � Canadian City ◦ More centralized, less suburbanized. Wealthy live in CBD, less deterioration of CBD’s Eastern European City- less affluent than W. Europe due to Communist Urban Planning. Micro-districts- fewer roads, maximized living space. Islamic City- mosques, open air markets, courtyards surrounded by walls
- Slides: 94