APHG UNIT VI Industry Developmen t KEY ISSUE


 A decent standard of living")
 A long and healthy life")
 Access to knowledge")
 to 1. 0")
 Very High Developed (HDI")


")


 six")


 and the Yucatan peninsula")
- Slides: 48
APHG UNIT VI Industry & Developmen t
KEY ISSUE 1 Why Does Development Vary Among Countries?
DEVELOPMENT A process of improvement in the material and living conditions of people through diffusion of knowledge and technology.
Development is a continuum, and for the most part it is linear. Most countries start at a similarly undeveloped point (low income, low life expectancy), and move along the ‘process’ toward higher development.
Points of crisis- like war or extreme political instability- can cause a country to ‘revert’ backwards developmentally, but this is usually a temporary condition. War-related devastation in Syria
For example, parts of Syria and Iraq have been ‘de-developed’ under ISIS- but once freed, life in these areas slowly returns to pre-war standards.
Thus, to look at a country’s level of development is to see only a ‘snapshot, ’ for development is dynamic and constantly changing.
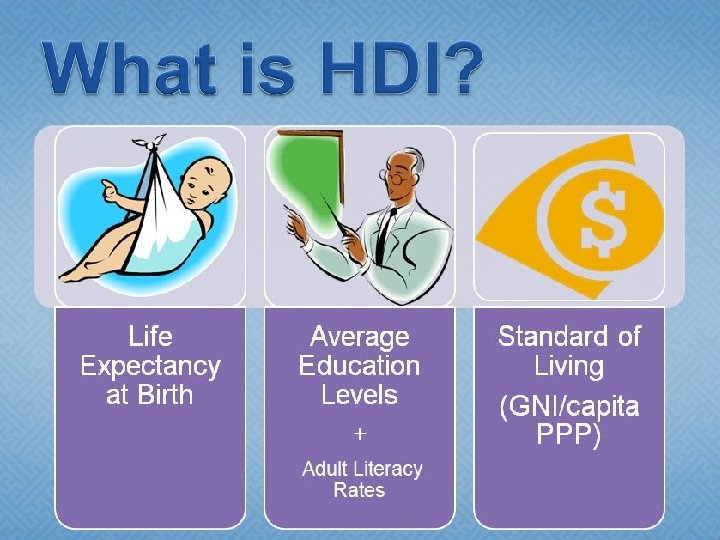
To measure the level of development in different countries, the UN as developed a ranking called the HUMAN DEVELOPMENT INDEX (HDI). The HDI ranks countries according to three key
1. ) A decent standard of living
2. ) A long and healthy life
3. ) Access to knowledge
The HDI ranks countries on a scale from 0 (very undeveloped) to 1. 0 (very developed). Countries over. 8 are called More Developed Countries (MDCs), while those under. 8 are called Less Developed Countries (LDCs).
There are four HDI categories countries fall into: 1. ) Very High Developed (HDI of. 8 or higher) 2. ) High Developing (HDI between. 7. 79) 3. ) Medium Developing (HDI between. 52 -. 69) 4. ) Low Developing (HDI. 51 or below)
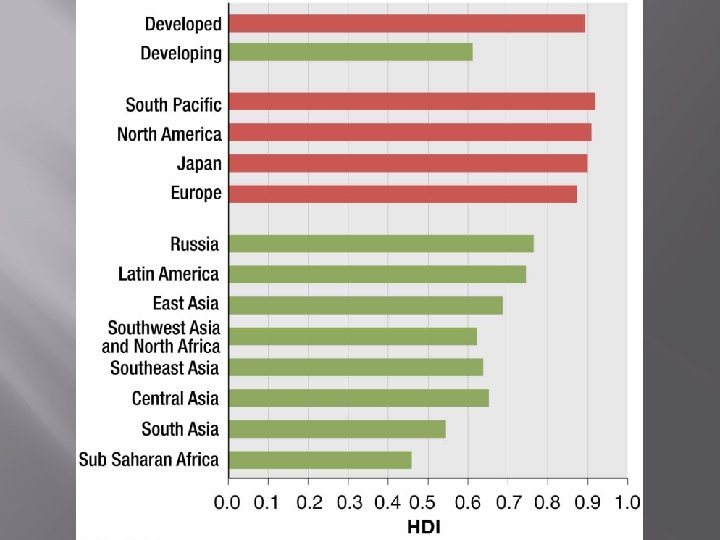
HDI Rankings by Country
BRANDT LINE This line, drawn by Willy Brandt in the 1980 s, divides the ‘rich’ global North from the ‘poor’ global South
EXAMINING COMPONENTS OF THE HUMAN DEVELOPMENT INDEX (HDI)
A DECENT STANDARD OF LIVING People in the developed/developing world GENERATE and SPEND wealth in different ways.
A DECENT STANDARD OF LIVING • • Measured using specific metrics: GROSS NATIONAL INCOME (GNI) – value of goods services produced by a country per year, including in/outflow of money GROSS DOMESTIC PRODUCT (GDP) – Same as GNI without money flow in/out PURCHASING POWER PARITY (PPP) – Adjusts GNI/GDP to reflect buying power ‘PER CAPITA’ – Adjusts GNI/GDP to a person basis (averaged)
GNI Per Capita Example USA GNI: $17 Trillion USA Pop’n: 320 million 17 trillion / 320 million $53, 000
A DECENT STANDARD OF LIVING GLOBAL GNI PER CAPITA
A DECENT STANDARD OF LIVING The HDI also accounts for the ECONOMIC SECTORS prevalent within a country: • PRIMARY – Extraction of materials from the Earth • SECONDARY – Refining of raw materials into finished products • TERTIARY – Provision of goods/services in exchange for money
A DECENT STANDARD OF LIVING PRIMARY SECTOR SECONDARY SECTOR TERTIARY SECTOR
A DECENT STANDARD OF LIVING PRODUCTIVITY greatly impacts the wealth of a nation; it is how much EACH WORKER is able to produce. In developed countries, productivity per worker is far higher, leading to higher profits and incomes.
A DECENT STANDARD OF LIVING Notable disparities exist in the ownership of CONSUMER GOODS between the developed/developing world.
A DECENT STANDARD OF LIVING CONSUMER GOODS CARS: World Average 170 per 1, 000 people. Developed world: 630 Developing world: 80 TELEPHONES: World Average 800 per 1, 000 people. Developed world: 1, 100 Developing world: 700 COMPUTERS: World Average 300 per 1, 000 people. Developed world: 700 Developing world: 200
A DECENT STANDARD OF LIVING HDI can be adjusted to reflect inequality within a country, called INEQUALITYADJUSTED HDI.
A LONG AND HEALTHY LIFE A major contributor to a country’s HDI ranking is LIFE EXPECTANCY AT BIRTH, which measures how old people will live to be on average.
A LONG AND HEALTHY LIFE World average life expectancy is 70, but major disparities exist between countries and regions. Many developed countries see lifespans in the high 70 s/over 80, while many developing countries fall far short of the world average.
A LONG AND HEALTHY LIFE Developing countries have a wide range of life expectancy, particularly prominent at the regional level: • Latin America: 75 years • South Asia: 65 years • Sub-Saharan Africa: 55 years or less Depends largely on food availability & social
A LONG AND HEALTHY LIFE
A LONG AND HEALTHY LIFE COUNTRIES WITH LONGEST LIFESPANS COUNTRIES WITH SHORTEST LIFESPANS
A LONG AND HEALTHY LIFE The number of young people is (on average) six times higher than the number of elderly in developing countries. the two metrics are nearly equal in many developed countries.
A LONG AND HEALTHY LIFE More than 99. 5% of babies in the developed world survive their first year, compared to about 94% in developing countries. In other words, child mortality is 12 x higher in the developing world
ACCESS TO KNOWLEDGE The UN believes that access to knowledge is essential to the possibility of leading a life of value.
ACCESS TO KNOWLEDGE The YEARS OF SCHOOLING metric measures the educational attainment of those 25 and older in a country. • World Average: 7 years • Developed countries: 11 years • Developing countries: 6 years
ACCESS TO KNOWLEDGE YEARS OF SCHOOLING
ACCESS TO KNOWLEDGE Access to education has increased in recent decades. EXPECTED YEARS OF SCHOOLING is the years in school a typical 5 -year-old will experience. Developed Countries: 16 years Developing Countries: 11 years
ACCESS TO KNOWLEDGE These numbers imply most in the developed world will attend college, while most in the developing world will not graduate high school.
ACCESS TO KNOWLEDGE Also important: Pupil/Teacher Ratio – Average 14 in developed world, 26 in developing world. Literacy Rate – Greater than 99% in almost all developed countries; high in some developing countries, very low in others.
Variations in Development within Countries and Regions
Many developing regions contain wide disparities in development between countries. This is largely due to the unequal distribution of wealthgenerating resources and
SOUTHWEST ASIA is a prime example. Highly-developed, oil-rich nations like Saudi Arabia or the UAE stand in stark contrast to comparatively undeveloped countries like Jordan or Yemen, which lack oil resources.
Level of development can also vary widely within a country. Often, a divide exists between urban ‘haves’ and rural ‘have-nots’ in developing countries.
CHINA’s wealth is concentrated along the Eastern coast, where manufacturing cities and ports lie.
Wealth is BRAZIL is highly concentrate d along the southeaster n Coast, where its major cities lie.
Wealth in MEXICO is concentrated along the US border (manufacturing) and the Yucatan peninsula (tourism)