An Empirical Test of the Regression Discontinuity Design


 did initial analysis of the RE. • Team 2")
 RDD Effect =")
: Quadratic Model")


- Slides: 12
An Empirical Test of the Regression Discontinuity Design William R. Shadish and Rodolfo Galindo University of California, Merced and Vivian Wong, Peter Steiner, and Thomas Cook Northwestern University
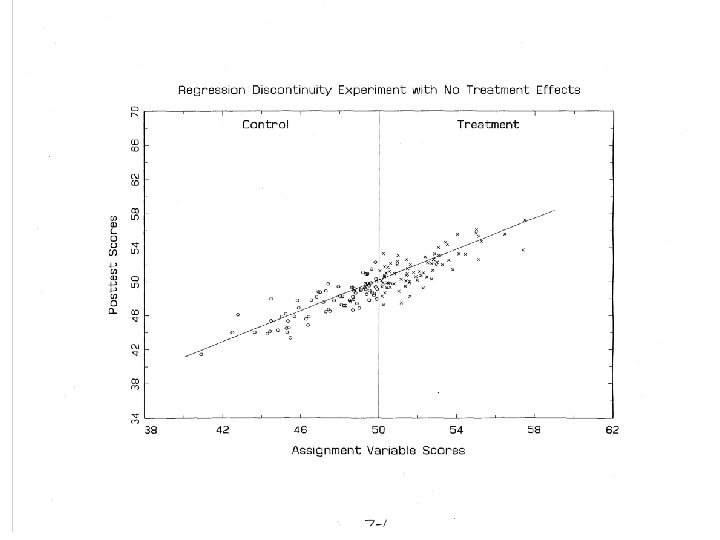
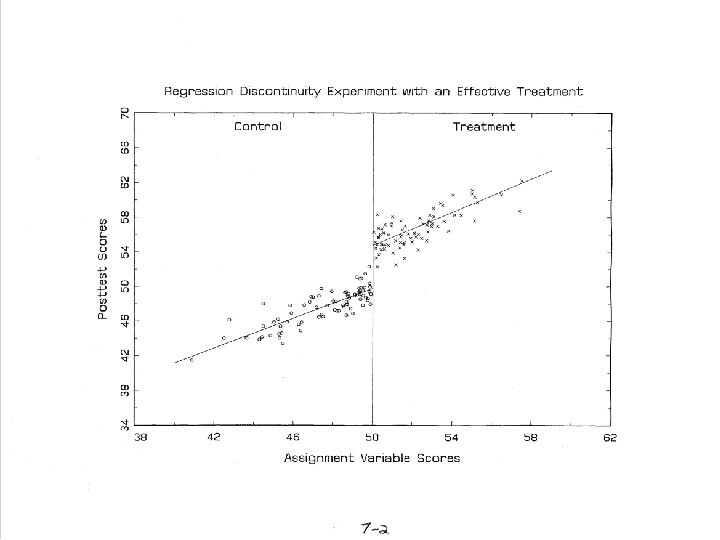
Regression Discontinuity Design • Units are assigned to conditions based on a cutoff score on a measured covariate, • The effect is measured as the discontinuity between treatment and control regression lines at the cutoff (it is not the group mean difference).
Does It Work? • When properly implemented analyzed, RD yields an unbiased estimate of treatment effect (see Rubin, 1977). – But proper analysis is not easy; it requires correct modeling of functional form. • If so, RDD should yield the same effect estimate as a randomized experiment. – Three prior studies (Aiken et al. ; Buddlemeyer & Skoufias; Black, Galdo & Smith) found reasonable agreement between RE and RDD but • Two did not test the RE/RDD difference for statistical significance • The one that did found a substantial minority of significant differences depending on how the analysis was done. • To explore this further, we tested this by randomly assigning participants to be in a randomized experiment or a regression discontinuity design:
N = 588/5691 Undergraduate Psychology Students Pretest and then Random Assignment to: 1 N Randomized Experiment 2 Regression Discontinuity Design 2 N = 197/189 N = 391/380 Mathematics Vocabulary Training N = 110/107 N = 87/82 N = 259/257 N = 132/123 = a/b is number assigned (a) and number after attrition (b). Total attrition = 3. 2%. 2 Allows two hypothesis tests: (1) effects of vocabulary training on vocabulary outcome, (2) effects of mathematics training on mathematics outcome
Analysis • Team 1 (Shadish/Galindo) did initial analysis of the RE. • Team 2 (Wong/Steiner/Cook) analyzed the RDD. – Must correctly model functional form of relationship between AV and outcome, so used: • Parametric (with nonlinear and interaction terms) • Nonparametric (local polynomial regression) • Semiparametric (Generalized Additive Model) • Masked to each others results initially. • All analyses used the same set of pretest covariates (not included in equations that follow)
Mathematics Results: No Difference RE-ATE Effect = 2. 53 (. 60) RDD Effect = 1. 94 (se =. 59): z = 0. 70, p =. 48
Vocabulary Results: No Difference RDD Effect = 5. 91 (se =. 77): Quadratic Model z = 1. 59, p =. 11 RE-ATE Effect = 4. 46 (. 49)
Problem • These analyses make sense from a policy perspective—RE’s are nearly always analyzed for the average treatment effect (ATE). • From a scientific point of view, however, ATE is a not what RDD is estimating. RDD estimates LATE at cutoff, taking nonlinearities and interactions into account. • So, does RDD = RE when estimating LATE for RE?
Constrained Analyses • Since participants were randomly assigned to RDD and RE, they should have the same functional form within sampling error. • So we compared RDD-LATE to RE-LATE constraining both to have the same functional form. – Linear – Quadratic – Cubic • Across six different models (three functional forms each for vocabulary and mathematics), RE and RDD gave effects that were not significantly different in every case.
Discussion • RE = RDD across all of these tests – Consistent with previous studies (Aiken et al. ; Buddlemeyer & Skoufias; Black, Galdo & Smith). • We continue to explore this data set (e. g. , we have a measure of treatment receipt we could use to improve the analysis).