Introduction of Regression Discontinuity Design RDD This Talk
")

")
 p A tie-breaking experiment p")


")


 “Waiting for Life to Arrive:")
- Slides: 58
Introduction of Regression Discontinuity Design (RDD)
This Talk Will: p p p p Introduce the history and logic of RDD, Consider conditions for its internal validity, Considers its sample size requirements, Consider its dependence on functional form, Illustrate some specification tests for it, Describe an application. Consider limits to its external validity, Consider how to deal with noncompliance,
RDD History p p p In the beginning there was Thislethwaite and Campbell (1960) This was followed by a flurry of applications to Title I (Trochim, 1984) Only a few economists were involved initially (Goldberger, 1972) Then RDD went into hibernation It recently experienced a renaissance among economists (e. g. Hahn, Todd and van der Klaauw, 2001; Jacob and Lefgren, 2002) Tom Cook has written about this story
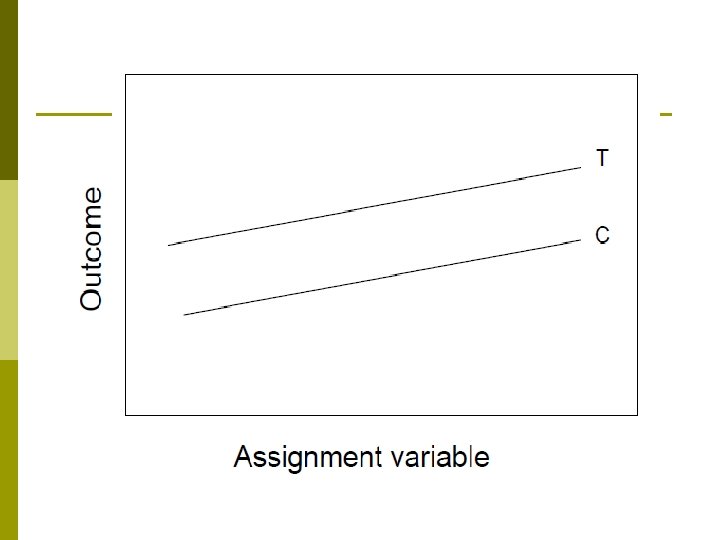
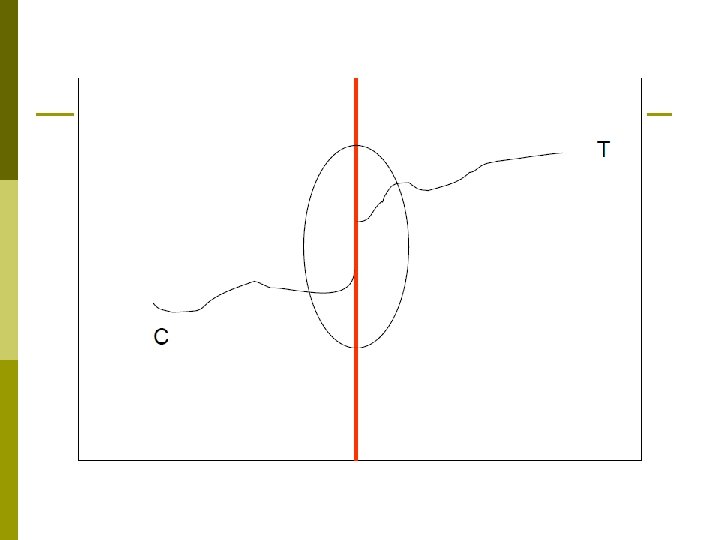
RDD Logic p Selection on an observable (a rating) p A tie-breaking experiment p Modeling close to the cut-point p Modeling the full distribution of ratings
Many different rules work like this. Examples: n n n Whether you pass a test Whether you are eligible for a program Who wins an election Which school district you reside in Whether some punishment strategy is enacted Birth date for entering kindergarten This last one should look pretty familiar-Angrist and Krueger’s quarter of birth was essentially a regression discontinuity idea
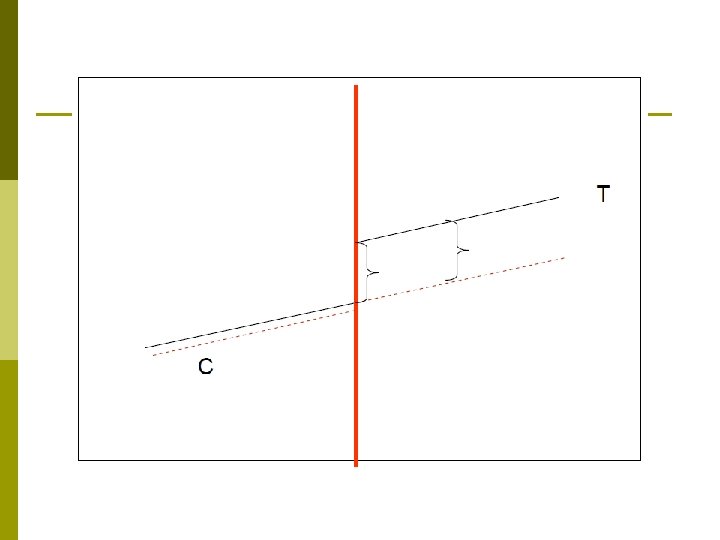
The key insight is that right around the cutoff we can think of people slightly above as identical to people slightly below Formally we can write it the model as: if is continuous then the model is identified (actually all you really need is that it is continuous at x = x*)
To see it is identified not that Thus That it
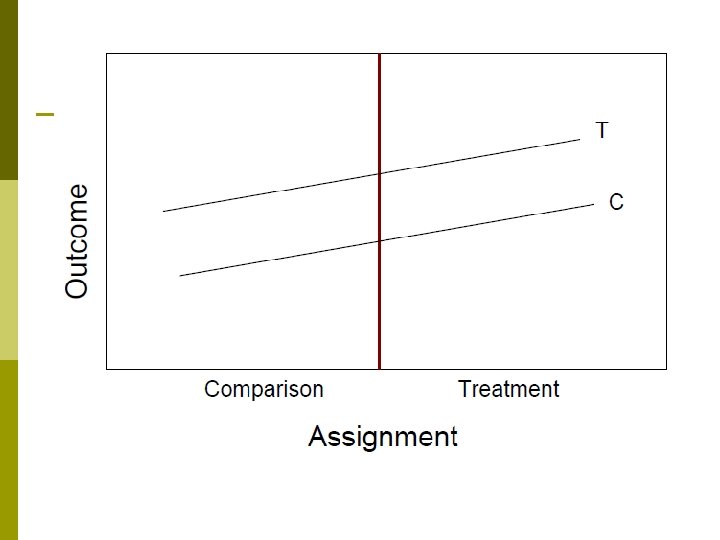
There is nothing special about the fact that Ti was binary as long as there is a jump in the value of Ti at x* p This is what is referred to as a “Sharp Regression Discontinuity” p There is also something called a “Fuzzy Regression Discontinuity” p n This occurs when rules are not strictly enforced
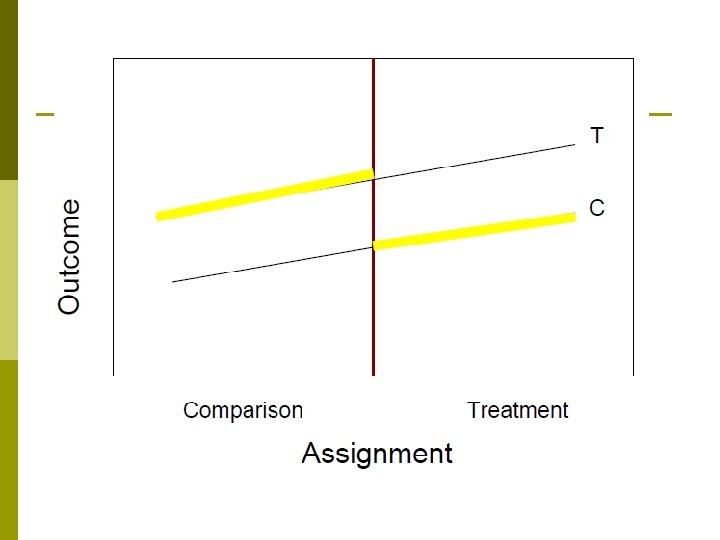
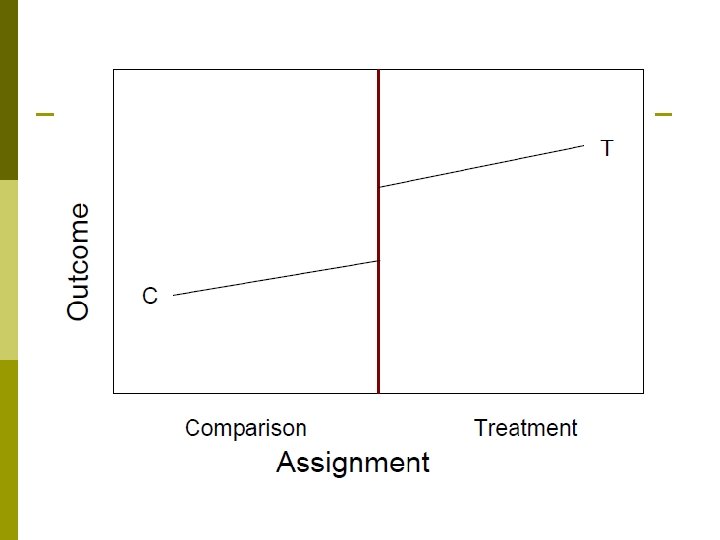
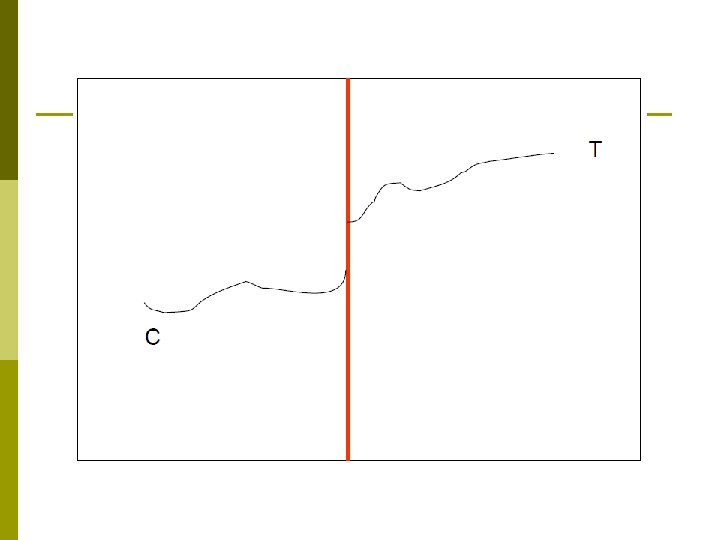
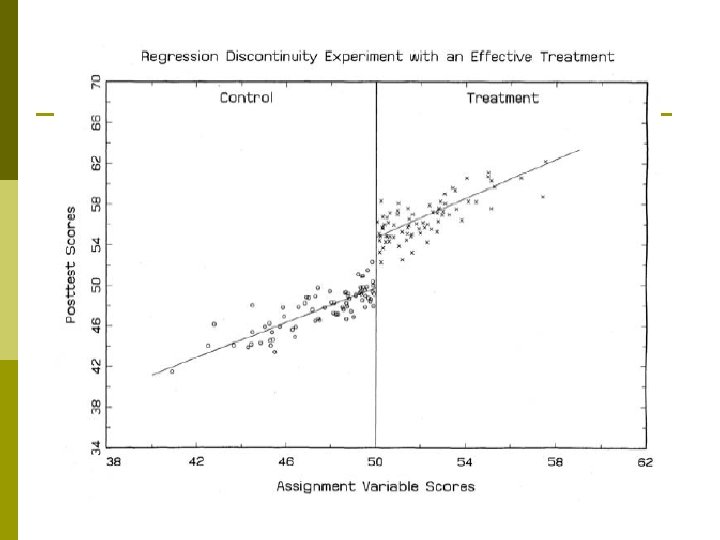
The size of the discontinuity at the cutoff is the size of the effect.
Conditions for Internal Validity p p The outcome-by-rating regression is a continuous function (absent treatment). The cut-point is determined independently of knowledge about ratings. Ratings are determined independently of knowledge about the cut-point. The functional form of the outcome-by-rating regression is specified properly.
RDD Statistical Model where: Yi = outcome for subject i, Ti = one for subjects in the treatment group and zero otherwise, Ri = rating for subject i, ei = random error term for subject i, which is independently and identically distributed
Sample Size Implications p Because of the substantial multi-collinearity that exists between its rating variable and treatment indicator, an RDD requires 3 to 4 times as many sample members as a corresponding randomized experiment
Specification Tests p p p Using the RDD to compare baseline characteristics of the treatment and comparison groups Re-estimating impacts and sequentially deleting subjects with the highest and lowest ratings Re-estimating impacts and adding: a treatment status/rating interaction n a quadratic rating term n interacting the quadratic with treatment status n p Using non-parametric estimation
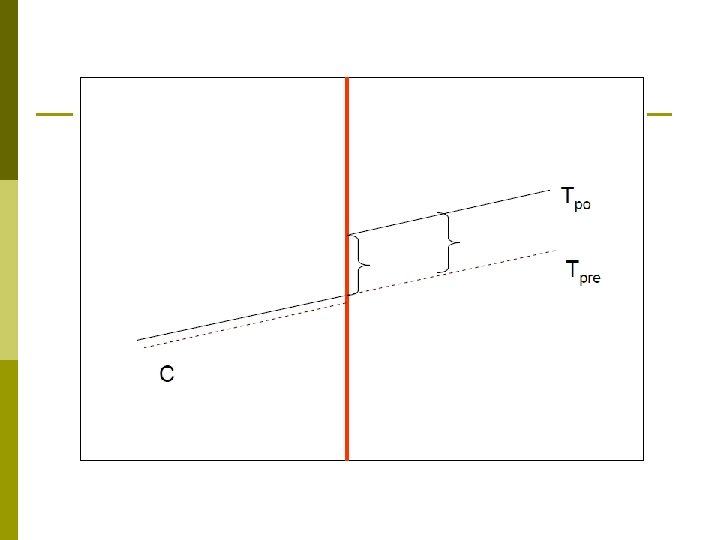
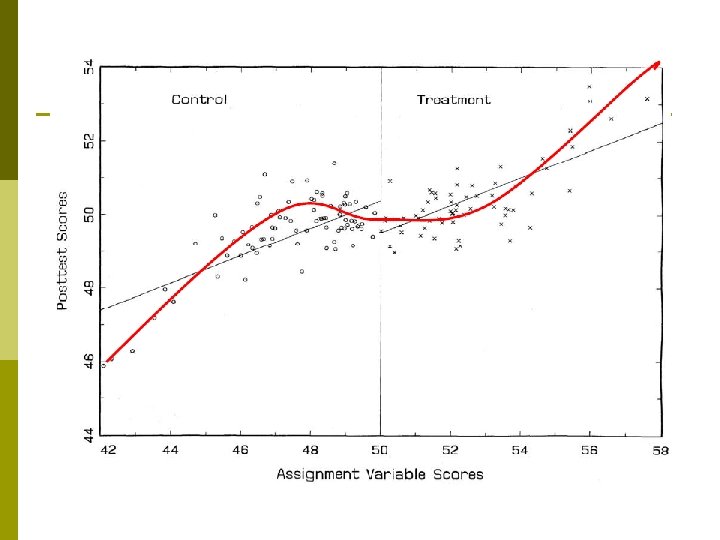
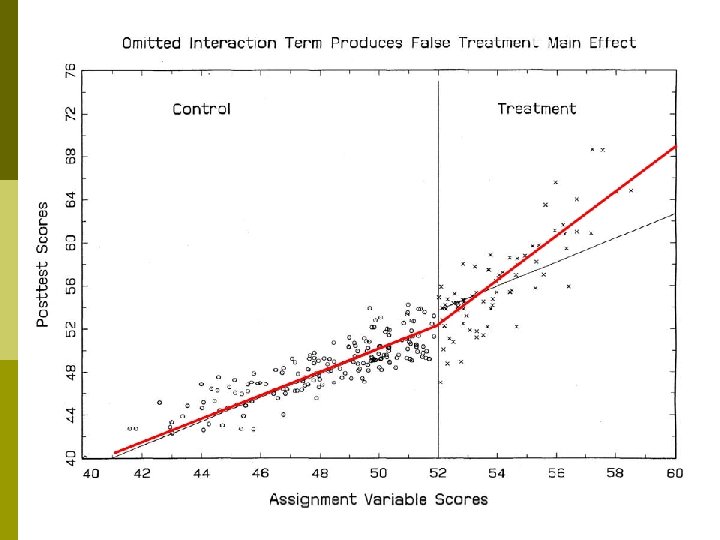
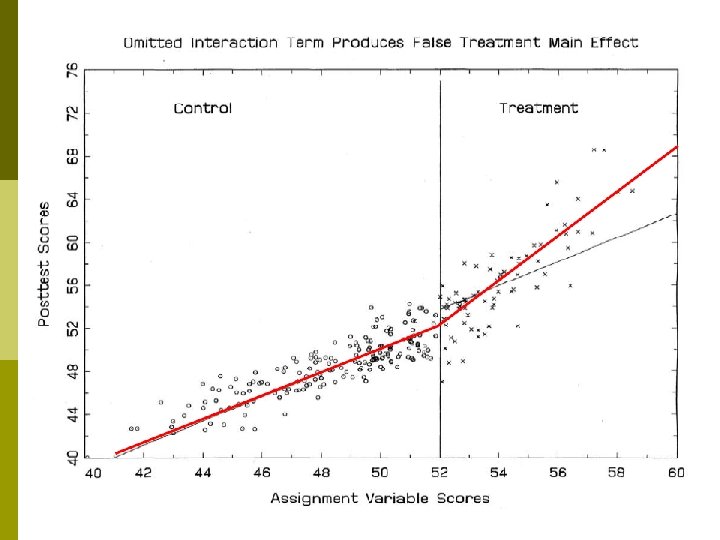
Here we see a discontinuity between the regression lines at the cutoff, which would lead us to conclude that the treatment worked. But this conclusion would be wrong because we modeled these data with a linear model when the underlying relationship was nonlinear
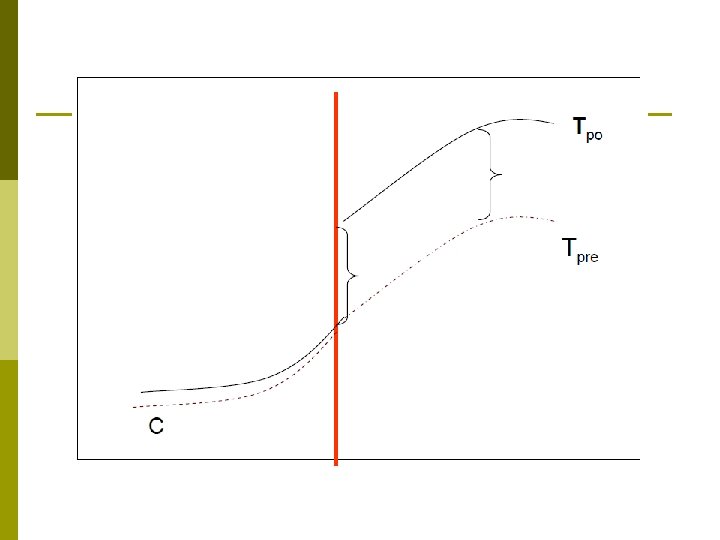
Here we see a discontinuity that suggests a treatment effect. However, these data are again modeled incorrectly, with a linear model that contains no interaction terms, producing an artifactualdiscontinuity at the cutoff…
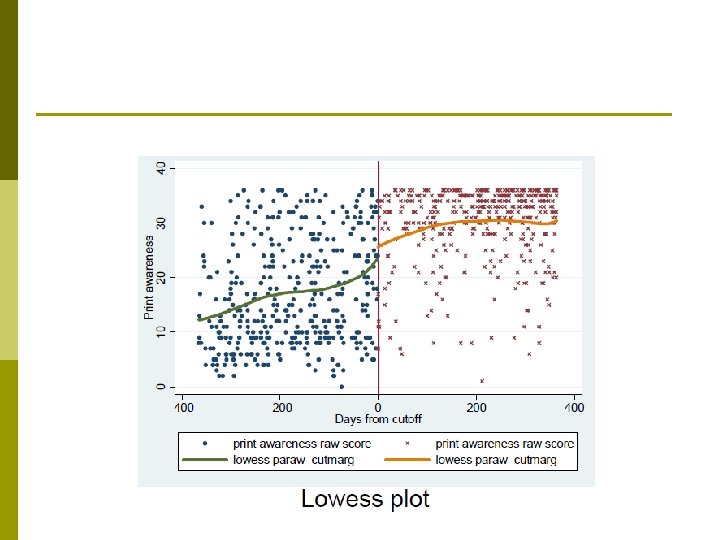
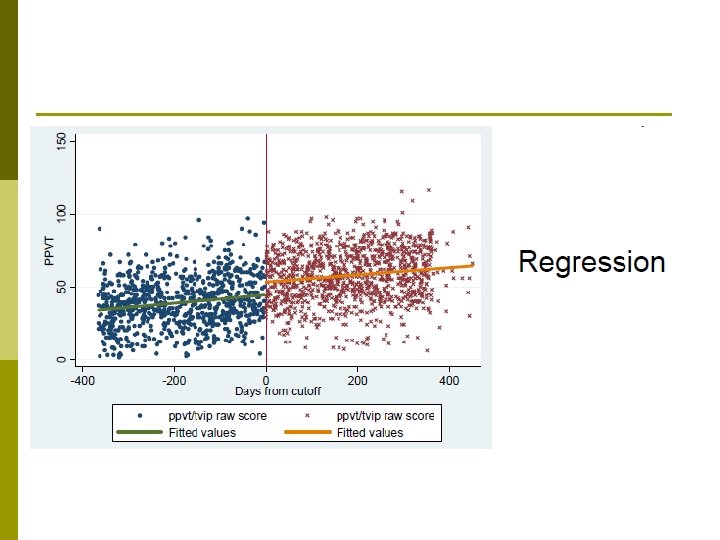
Example: State Pre-K p p p Pre-K available by birth date cutoff in 38 states, here scaled as 0 (zero) 5 chosen for study and summed here How does pre-K affect PPVT (vocabulary) and print awareness (pre-reading)
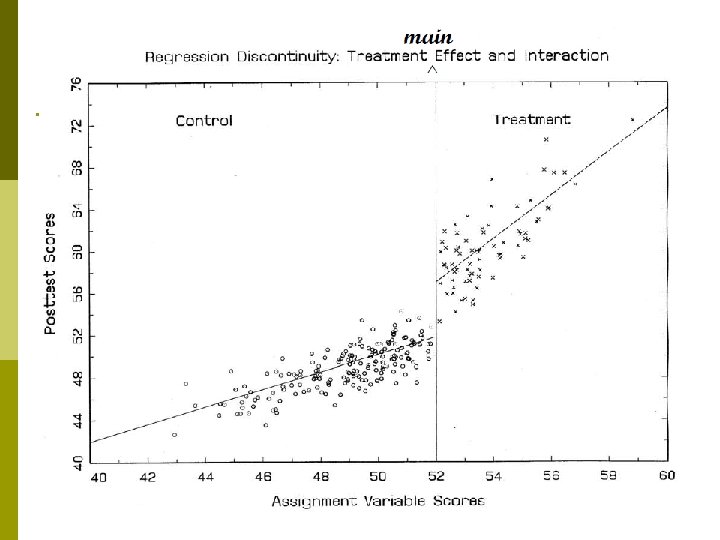
p Correct specification of the regression line of assignment on outcome variable
Best case scenario –regression line is linear and parallel (NJ Math)
Sometimes, form is less clear
p So, what to do?
Graphical approaches
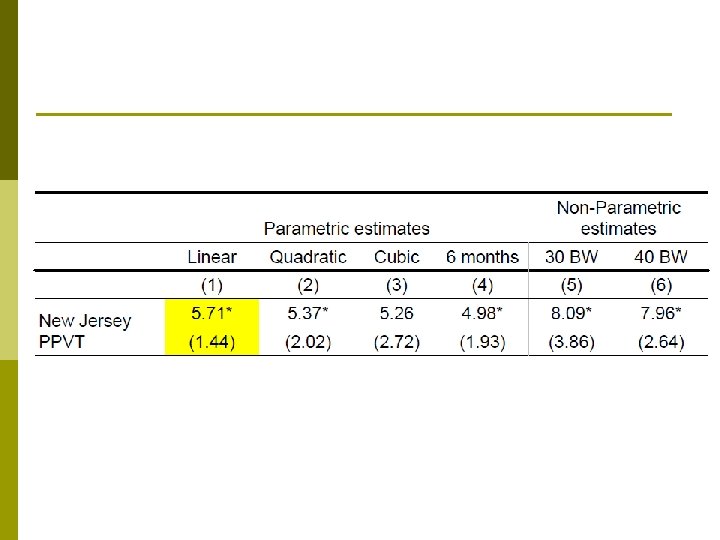
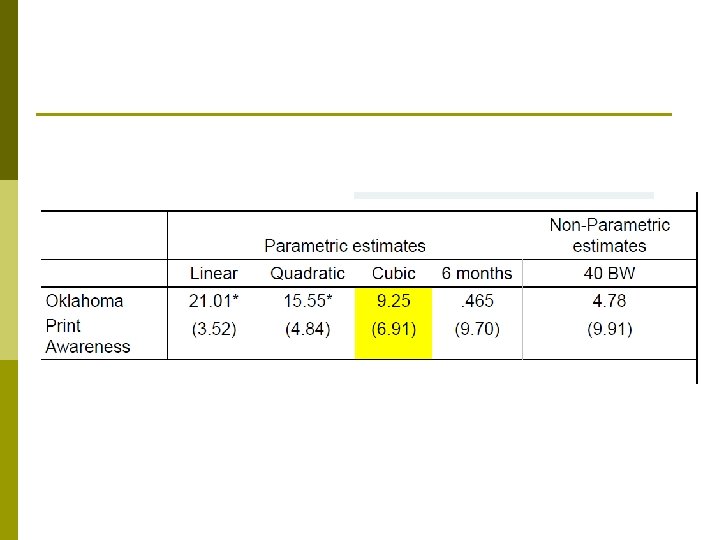
Parametric approaches p Alternate specifications and samples n n Include interactions and higher order terms Linear, quadratic, & cubic models Look for statistical significance for higher order terms When functional form is ambiguous, overfit the model (Sween 1971; Trochim 1980) p Truncate sample to observations closer to cutoff p Bias versus efficiency tradeoff
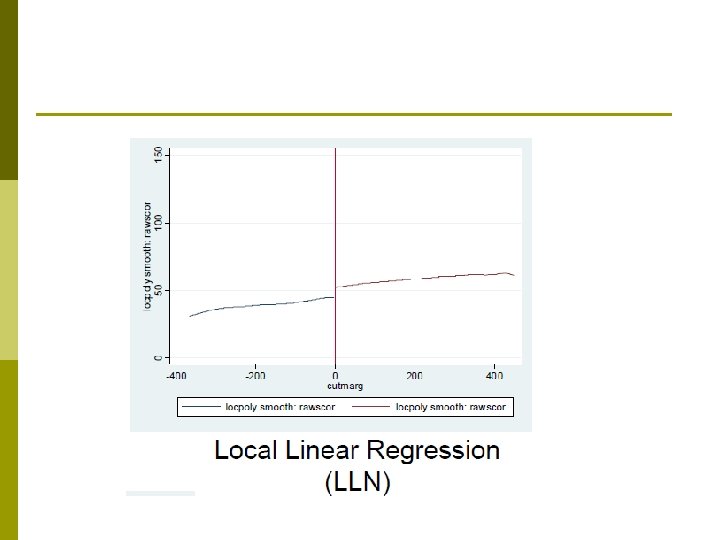
Non-parametric approaches p Eliminates functional form assumptions n n n p p Performs a series of regressions within an interval, weighing observations closer to the boundary Use local linear regression because it performs better at the boundaries What depends on selecting correct bandwidth? Key tradeoff in NP estimates: bias vs precision–How do you select appropriate bandwidth? –Ocular/sensitivity tests Cross-validation methods “Leave-one-out” method
p p State-of-art is imperfect So we test for robustness and present multiple estimates
Example I
Example II
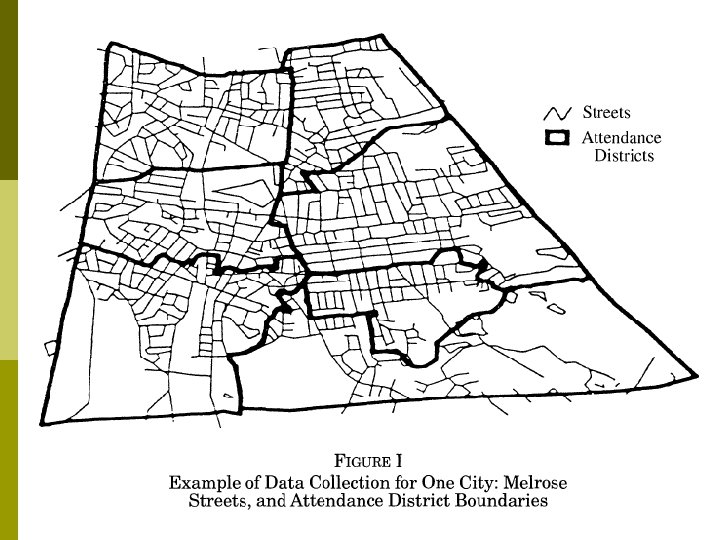
Do Better Schools Matter? Parental Valuation of Elementary Education Sandra Black, QJE, 1999 In the Tiebout model parents can “buy” better schools for their children by living in a neighborhood with better public schools How do we measure the willingness to pay? Just looking in a cross section is difficult: Richer parents probably live in nicer houses in areas that are better for many reasons
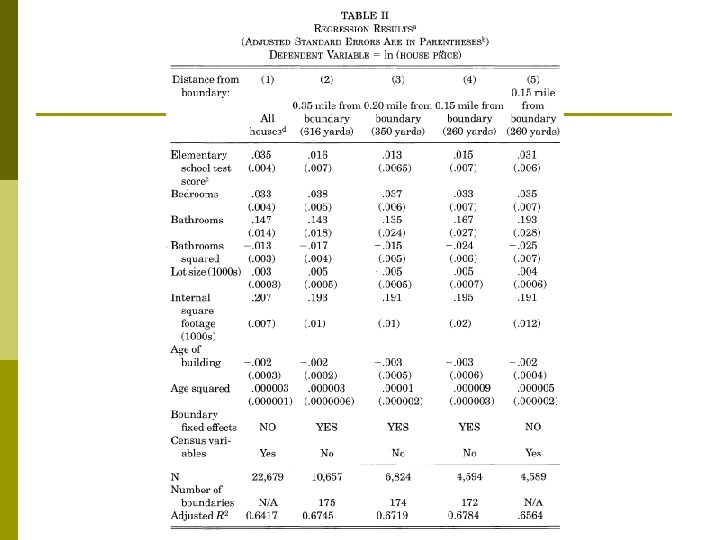
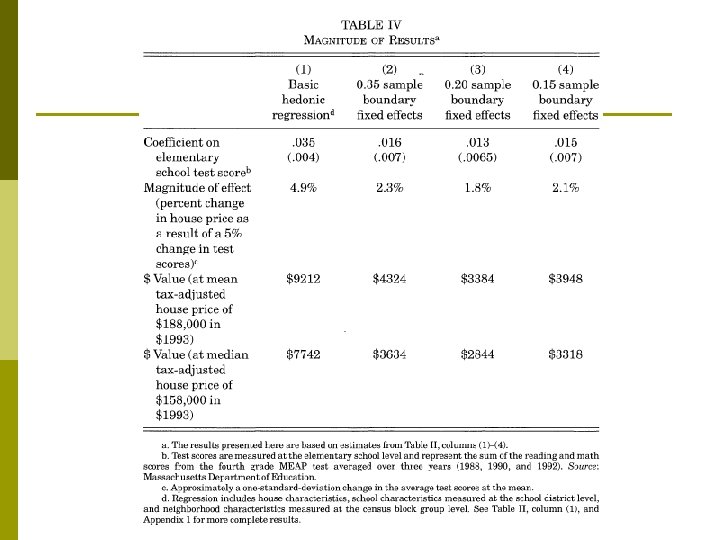
Black uses the school border as a regression discontinuity p We could take two families who live on opposite side of the same street, but are zoned to go to different schools p The difference in their house price gives the willingness to pay for school quality. p
Tie-breaker experiment?
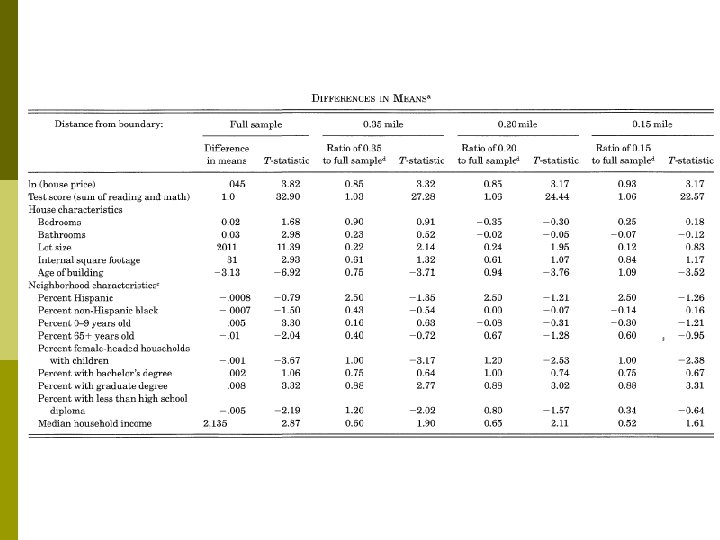
Show sample density at the cutoff
Summary of To-Do List p p p p Graphical analyses Alternative specification and sample choices in parametric models Non-parametric estimates at the cutoff Present multiple estimates to check for robustness Move to tie-breaker experiment around the cutoff Sample densely at the cutoff Use pretest measures
Recommendations p Pray for parallel and linear relationships
External Validity p p p Estimating impacts at the cut-point Extrapolating impacts beyond the cut-point with a simple linear model Estimating varying impacts beyond the cut-point with more complex functional forms
References p p p Cook, T. D. (in press) “Waiting for Life to Arrive: A History of the Regression -discontinuity Design in Psychology, Statistics and Economics” Journal of Econometrics. Goldberger, A. S. (1972) “Selection Bias in Evaluating Treatment Effects: Some Formal Illustrations” (Discussion Paper 129 -72, Madison WI: University of Wisconsin, Institute for Research on Poverty, June). Hahn, H. , P. Todd and W. van der Klaauw (2001) “Identification and Estimation of Treatment Effects with a Regression-Discontinuity Design” Econometrica, 69(3): 201 – 209. Jacob, B. and L. Lefgren (2004) “Remedial Education and Student Achievement: A Regression-Discontinuity Analysis” Review of Economics and Statistics, LXXXVI. 1: 226 -244. Thistlethwaite, D. L. and D. T. Campbell (1960) “Regression Discontinuity Analysis: An Alternative to the Ex Post Facto Experiment” Journal of Educational Psychology, 51(6): 309 – 317. Trochim, W. M. K. (1984) Research Designs for Program Evaluation: The Regression-Discontinuity Approach (Newbury Park, CA: Sage Publications).