Aim How to graphically represent the energy change


 Heat of reaction is the amount of heat given off")

 Reactants Products + Heat Energy")

 Reactants + Heat Energy Products")


- Slides: 21
Aim: How to graphically represent the energy change in a system? Do Now: 1. Explain what an effective collision is. 2. How does a catalyst speed up a reaction?
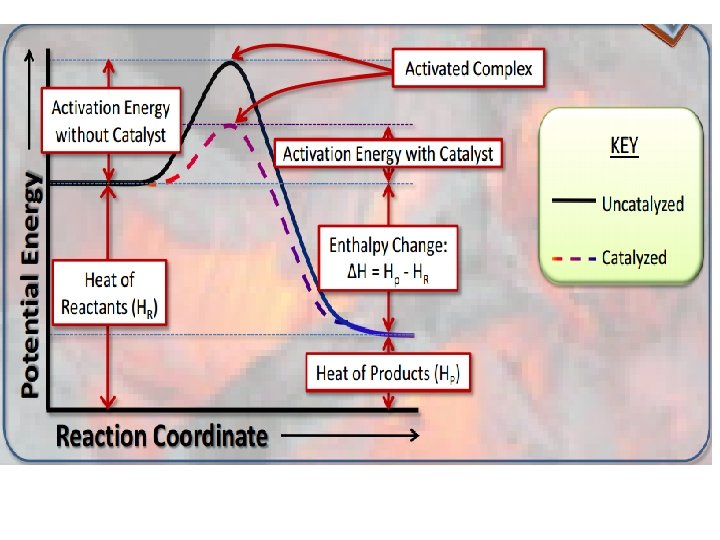
Activation Energy and Activated Complex • ALL REACTIONS need to absorb energy to overcome the activation energy. • When the particles have absorbed enough energy, they form an activated complex (intermediate state between reactants and products).
Activated Complex Reactants 2 H 2 + O 2 Products Activated Complex 2 H 2 O Activation energy is the energy absorbed by the reactants to form the activated complex.
Potential Energy • All substances have stored energy including the reactants, activated complex, and products.
Heat of Reaction (Enthalpy) Heat of reaction is the amount of heat given off or absorbed in a chemical reaction ΔH = PE (products) - PE(reactants) Heat of reaction PE content of products PE content of reactants
Heat of Reaction for Exothermic Process • If the products have less potential energy or heat content than the reactants, heat is given off and its is an exothermic reaction. ΔH = negative
Potential Energy Diagram (Exothermic, Energy is Produced ) Reactants Products + Heat Energy
Heat of Reaction for Endothermic Process If the products have more potential energy or heat content than the reactants, heat is absorbed and its is an endothermic reaction. ΔH = positive
Potential Energy Diagram (Endothermic, Energy is Used) Reactants + Heat Energy Products
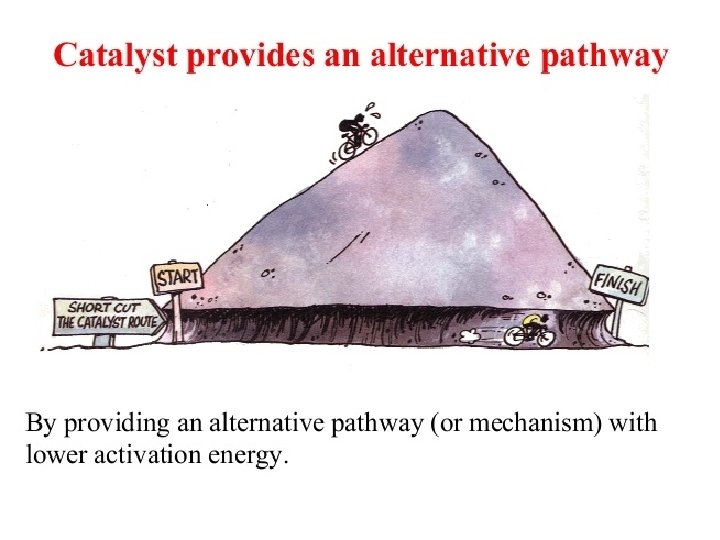
Addition of Catalyst • A catalyst lowers the amount of energy needed so that a reaction can happen more easily by providing an alternate pathway.
*Catalyst does not change ΔH; there is no difference in ΔH. *
Reading in the forward and reverse direction • A PE diagram can be read in the forward direction ( ) or the reverse direction ( ). In the forward direction, the reactants are on the left, and the products are on the right. In the reverse direction, the reactants are on the right, and the products are on the left.
1. The forward reaction above is endothermic or exothermic? 2. Which lettered arrow represents the energy of the reactants for the forward reaction? A 3. Which lettered arrow represents the energy of the reactants for the reverse reaction? G
4. Which lettered arrow represents the energy of the products for the forward reaction? G 5. Which lettered arrow represents the energy of the products of the reverse reaction? A 6. Which lettered arrow represents the ΔH for the forward catalyzed F reaction?
7. Which lettered arrow represents ΔH for the forward uncatalyzed reaction? F 8. Which lettered arrow represents the ΔH for the reverse catalyzed reaction? F 9. Which lettered arrow represents the ΔH for the reverse uncatalyzed reaction? F
10. Which lettered arrow represents activation energy for the forward catalyzed reaction? B 11. Which lettered arrow represents activation energy for the forward uncatalyzed reaction? E 12. Which lettered arrow represents activation energy for the reverse catalyzed reaction? I
13. Which lettered arrow represents activation energy for the reverse uncatalyzed reaction? D 14. Which lettered arrow represents energy of the activated complex for the catalyzed reaction? J 15. Which lettered reaction represents energy of the activated complex for the uncatalyzed reaction? C
16. Which lettered arrow represents the difference between the activation energies of the catalyzed and the uncatalyzed reactions? H 17. Which lettered arrow represents the difference between the activated complex for the catalyzed and the uncaltyzed reactions? H 18. The reverse reaction is (a) endothermic or (b) exothermic.
Do Now: Fill in the blank spaces. Word Box: Catalyzed Uncatalyzed