Chapter 12 Limits 12 1 Estimating Limits Graphically


 Estimate using a graph. Support your conjecture using a table of")
 Estimate using a graph. Support your conjecture using a table of")
 Estimate using a graph. Support your conjecture using a table of")
 Estimate using a graph. Support your conjecture using a table of")
 d)")


 Estimate each one-sided and two-sided limits, if it exists.")
 Estimate each one-sided and two-sided limits, if it exists. 0 0")
 Estimate , if it exists.")
 Estimate , if it exists.")
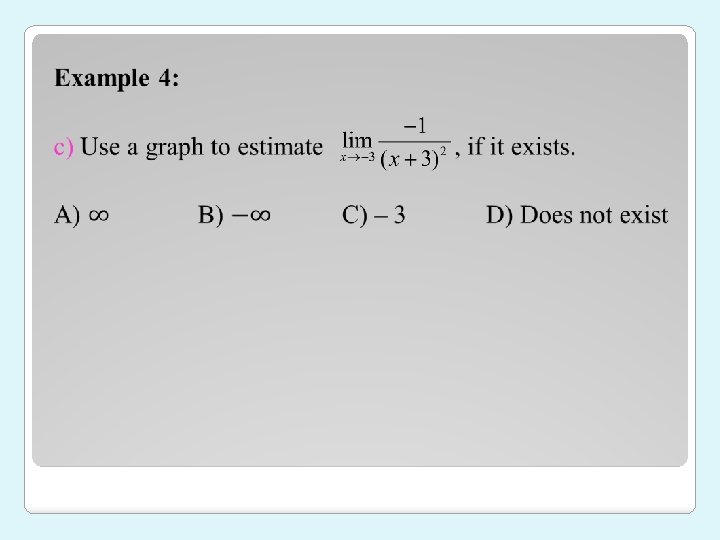

 Estimate A. does not exist B. 1 C. 0 D. –")


 Estimate , if it exists.")
 Estimate , if it exists.")
 Estimate , if it exists.")

 The population growth of a certain city is given by the")
 The population growth of deer on Fawn Island is given by")
- Slides: 38
Chapter 12: Limits 12. 1: Estimating Limits Graphically Objectives: - Estimate limits of functions at a point - Estimate limits of functions at infinity
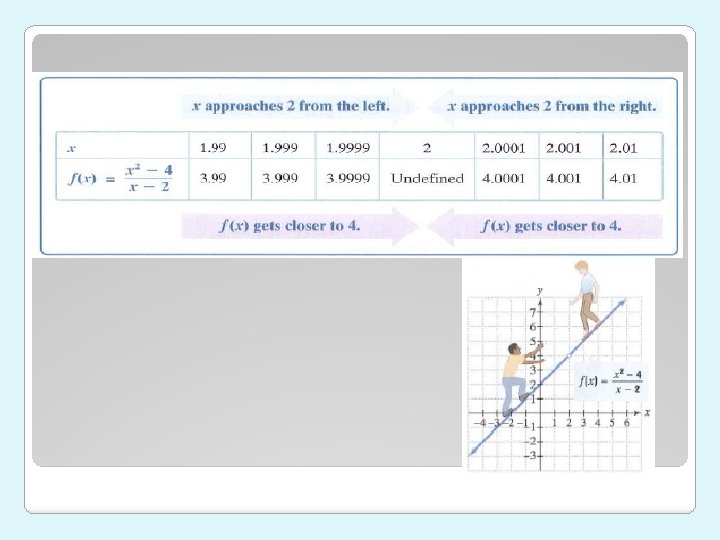
Suppose that you and a friend are walking along the graph of the function The figure below illustrates that you are walking uphill and your friend is walking downhill. What happens when x = 2?
Because 2 is not in the domain of the function, there is a hole in the graph at x = 2. Warning signs along the graph might be appropriate: Caution f(2) is undefined!! If you or your friend reach 2, you will fall through the hole and splatter onto the x-axis. WARNING! SPLAT! Too Dramatic? ?
Obviously, there is a problem at x = 2. But what happens along the graph of as you and your friend walk very, very close to x = 2? What function value, f(x), will each of you approach?
Can look at table of values: Thus, we must include values of x that are less than 2 and values of x that are greater than 2.
From the table, it appears that as x gets closer to 2, the values of get closer to 4. "The limit of as x approaches 2 equals 4. "
Limit Notation and Its Description Suppose that f is a function defined on some open interval containing the number a. The function f may or may not be defined at a. The limit notation is read "the limit of f(x) as x approaches a equals the number L. " This means that as x gets closer to a, but remains unequal to a, the corresponding values of f(x) get closer to L.
Example 1: A) Estimate using a graph. Support your conjecture using a table of values. x -6. 999 -7. 001 -7. 01 y
Example 1: B) Estimate using a graph. Support your conjecture using a table of values. x 0. 999 1. 001 1. 01 y
Example 2: A) Estimate using a graph. Support your conjecture using a table of values. x 3. 999 4. 001 4. 01 y
Example 2: B) Estimate using a graph. Support your conjecture using a table of values. x -2. 999 -3. 001 -3. 01 y
Example 2: Use the graph below to find each of the following: c) d)
Limits exist even when the value of the function does not. In other words f(c) may or may not equal L. A limit is not about what happens at the number that x is approaching. A limit is about what the y-value is approaching.
https: //www. youtube. com/watch? v=6 IB 6 y. Jl. WLDg
Example 3: Use the graph of the piecewise function below to find each of the following, or state that the limit or function value does not exist: a) b) c)
Example 3: Use the graph of the piecewise function below to find each of the following, or state that the limit or function value does not exist: d) e) f)
Example 3: g) Estimate each one-sided and two-sided limits, if it exists.
Example 3: h) Estimate each one-sided and two-sided limits, if it exists. 0 0
Limits can approach and -. Example 4: a) Estimate , if it exists.
Example 4: B) Estimate , if it exists.
Limits can also fail to exist if it oscillates (bounces back and forth between two values. ) Example 5: A) Estimate , if it exists.
Example 5: b) Estimate A. does not exist B. 1 C. 0 D. – 1 , if it exists.
SUMMARY
Estimating Limits at Infinity * Think end behavior!
Rules about Functions with Asymptotes Vertical Asymptote at x = c: Horizontal Asymptote at y = c:
Example 6: Use the graph of the rational function below to find each of the following, or state that the limit or function value does not exist: a) b) c) d) e)
Example 6: f) Estimate , if it exists.
Example 6: g) Estimate , if it exists.
Example 6: h) Estimate , if it exists.
Example 7: The growth of a certain bacteria can be modeled by the logistic growth function , where t represents time in hours. Estimate and interpret your result. , if it exists,
Example 7: b) The population growth of a certain city is given by the function P(t) = 0. 7(1. 1)t, where tis time in years. Estimate , if it exists, and interpret your result.
Example 7: c) The population growth of deer on Fawn Island is given by P (t) = 200(0. 81)t, where t is time given in years. Estimate , if it exists, and interpret your results.