
Solving Linear Programming Problems Graphically Finite 3 2

Solving Linear Programming Problems Graphically Finite 3 -2
• Linear programming will save you! – Suppose that you will be left in a deserted island – You want to live as many days as you can to increase chance of rescue – Fortunately (!), you can take a bag with you to the island – What would you put into the bag? Example 1: Surviving in an island
3 • The bag can carry at most 50 lbs • There are limited set of items you can carry – Bread: You can survive for 2 days with 1 lb of bread – Steak: You can survive for 5 days with 1 lb of steak (Memphis style grilled!) – Chicken: You can survive for 3 days with 1 lb of chicken (southern style deep fried!) – Chocolate: You can survive for 6 days with 1 lb of chocolate • How much of each item to take with you? Example 1: Surviving in an island
4 • STEP 0: Know the problem and gather your data – Your problem is to increase your chance of rescue by maximizing the number of days you survive – You can have 1 bag which can carry 50 lbs at most – You can only put bread, steak, chicken and chocolate into you bag – Each item enables you survive for a specific number of days for each pound you take Bread: 2 days/lb Steak: 5 days/lb Chicken: 3 days/lb Chocolate: 6 days/lb Example 1: Formulation Steps
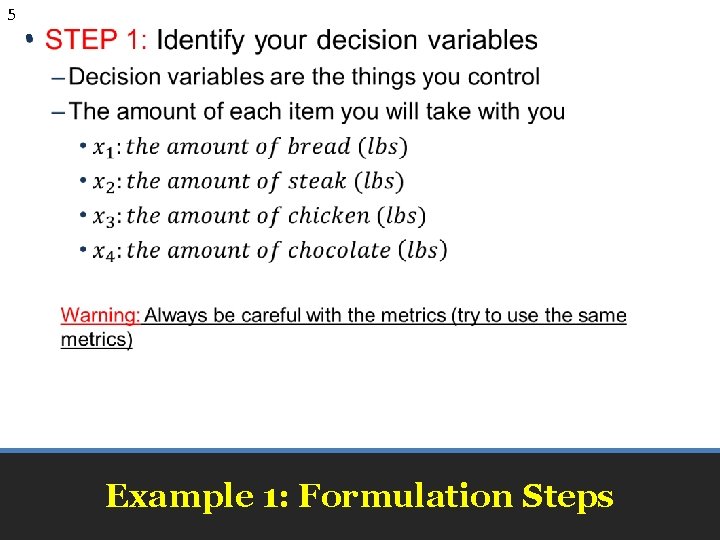
5 • Example 1: Formulation Steps
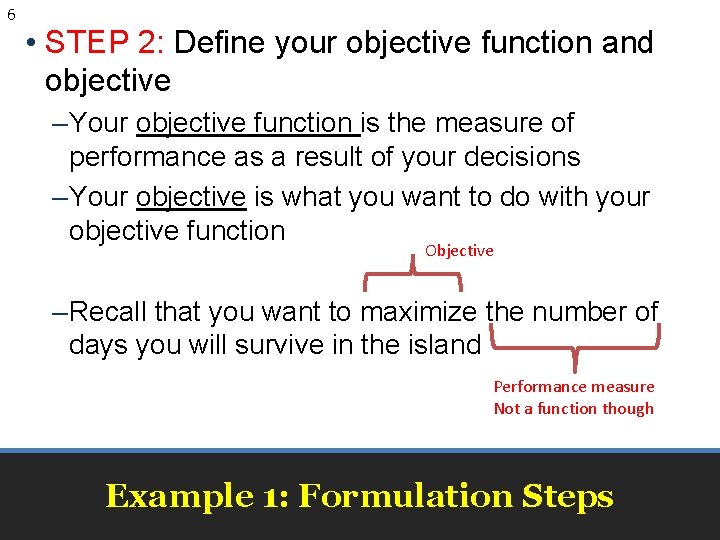
6 • STEP 2: Define your objective function and objective – Your objective function is the measure of performance as a result of your decisions – Your objective is what you want to do with your objective function Objective – Recall that you want to maximize the number of days you will survive in the island Performance measure Not a function though Example 1: Formulation Steps
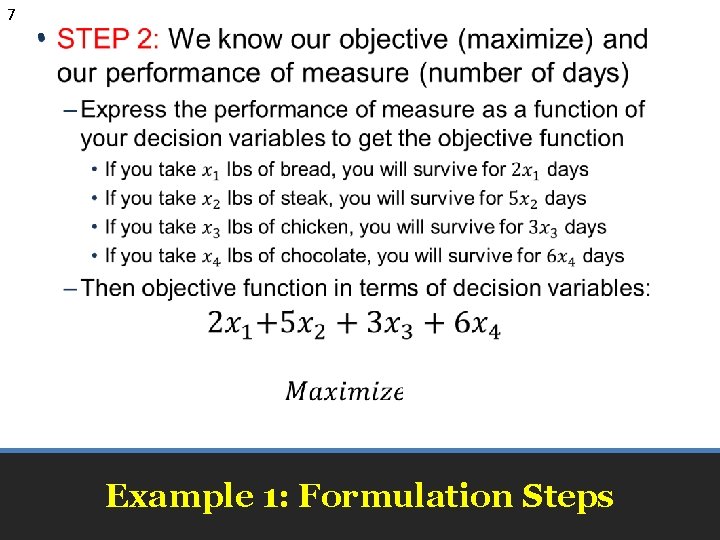
7 • Example 1: Formulation Steps
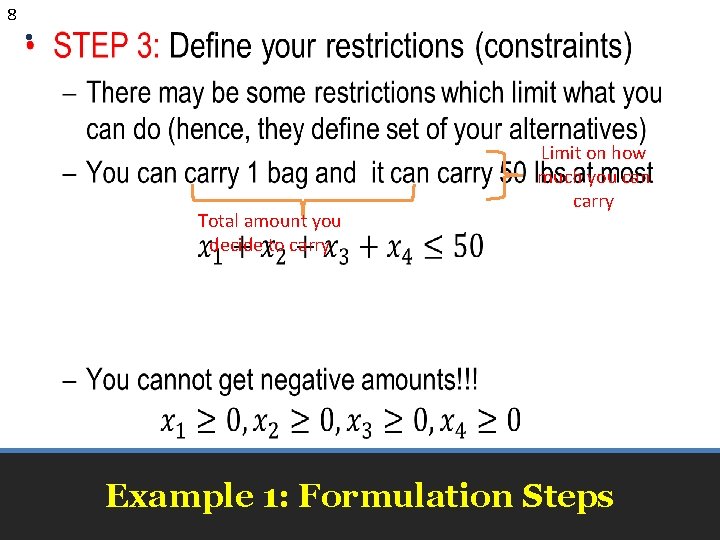
8 • Total amount you decide to carry Limit on how much you can carry Example 1: Formulation Steps
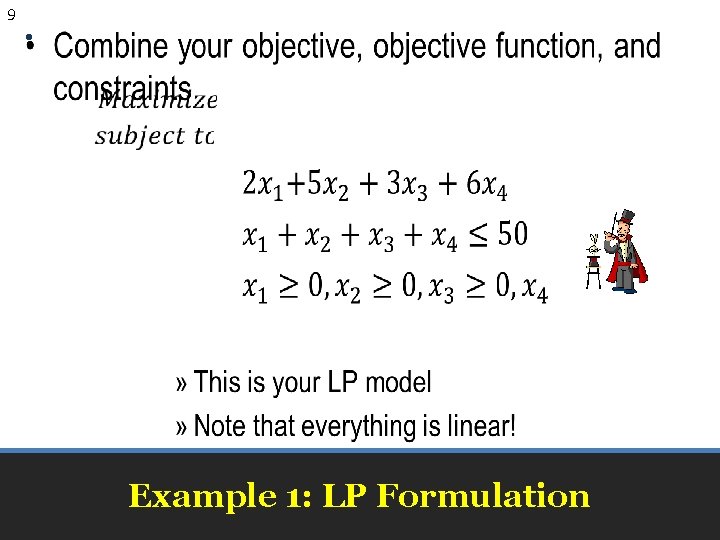
9 • Example 1: LP Formulation
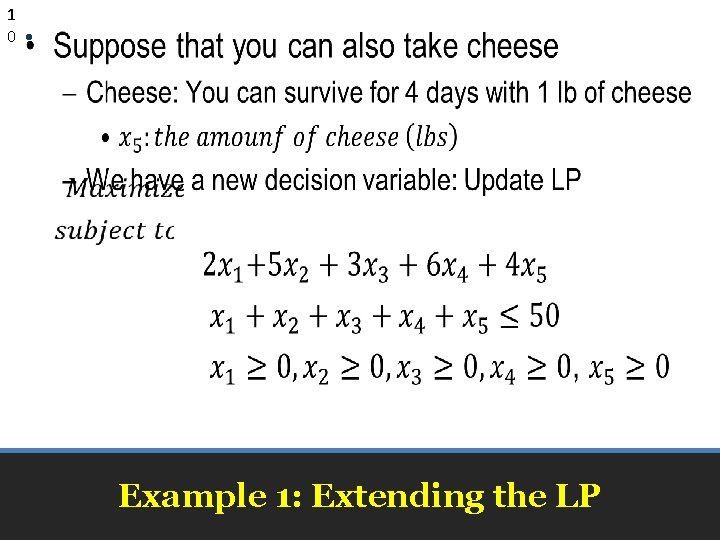
1 0 • Example 1: Extending the LP
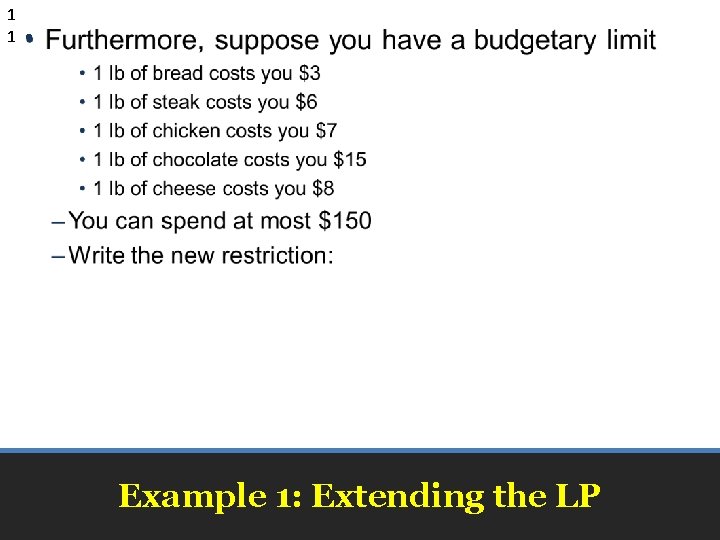
1 1 • Limit on how much you can spend Total money you decide to spend Example 1: Extending the LP
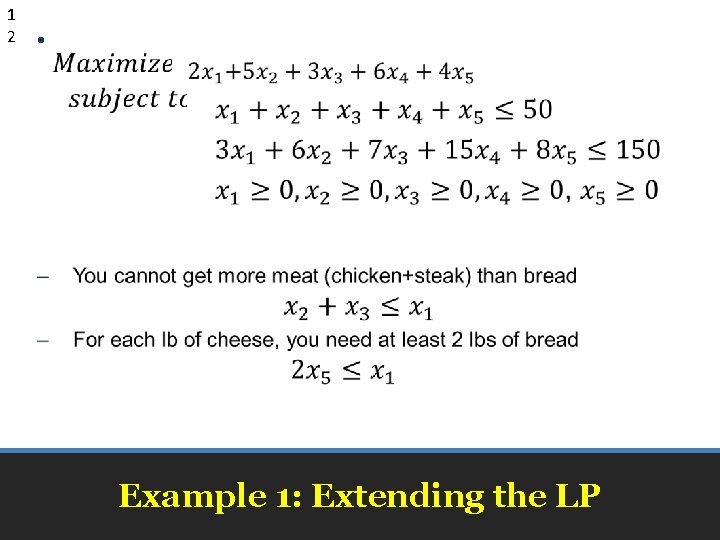
1 2 • Example 1: Extending the LP
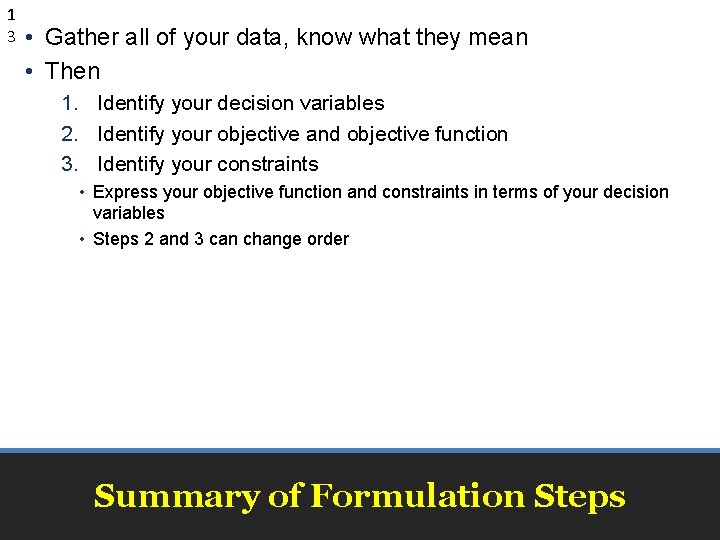
1 3 • Gather all of your data, know what they mean • Then 1. Identify your decision variables 2. Identify your objective and objective function 3. Identify your constraints • Express your objective function and constraints in terms of your decision variables • Steps 2 and 3 can change order Summary of Formulation Steps

1 4 • Write the objective function and all constraints • Graph the feasible region • Identify all corner points • Find the value of the objective function at all corner points Summary of the Graphical Method
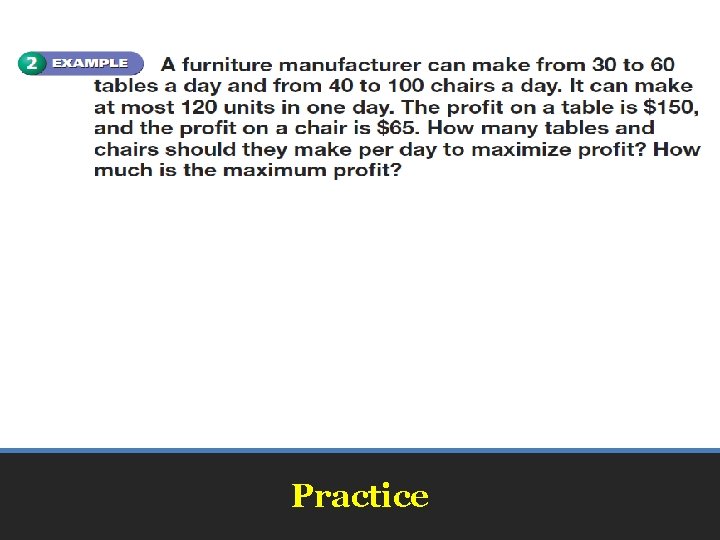
Practice
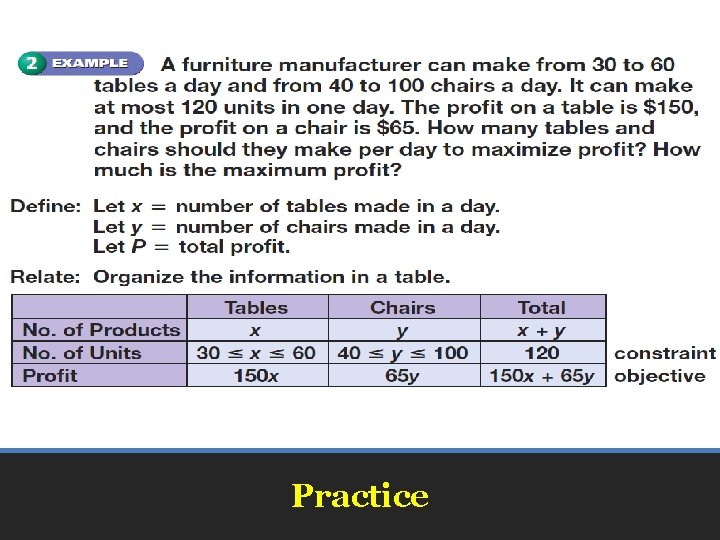
Practice
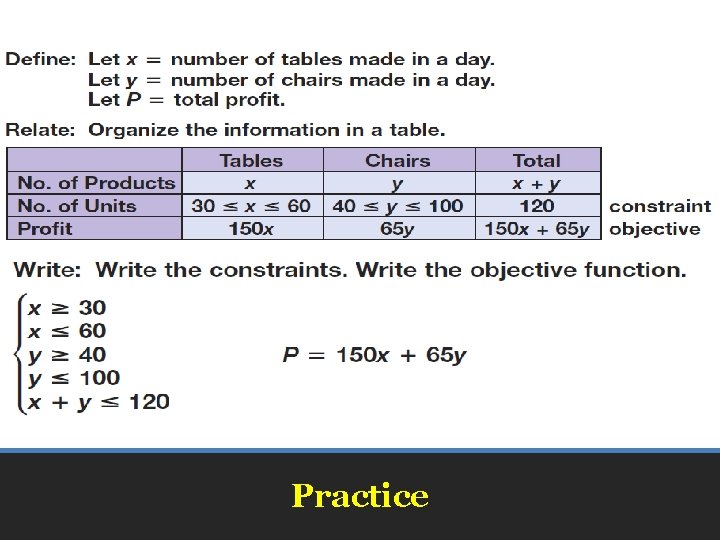
Practice
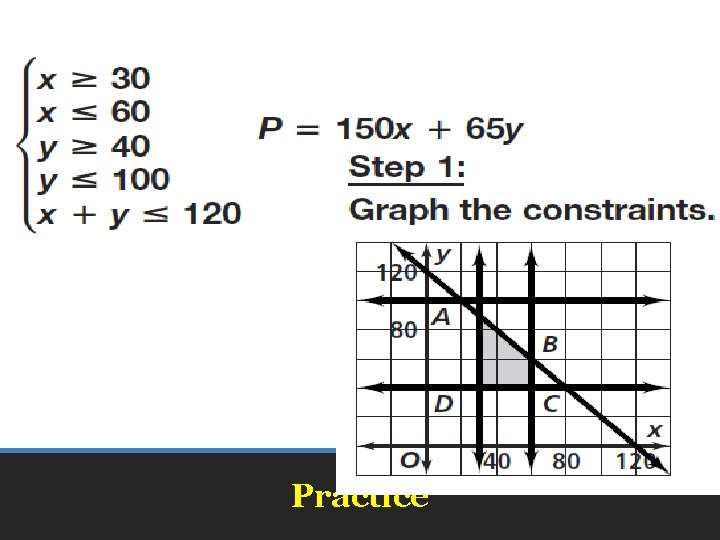
Practice

Practice
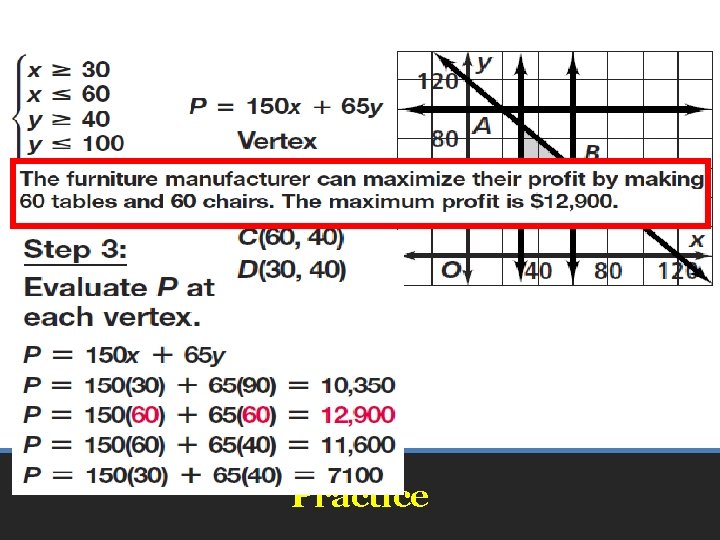
Practice

• Pages 124 – 126 • 1, 5, 9, 13, 15 Use Graph Paper Homework
- Slides: 21