Accelerated Underwriting Navigating a New Journey Craig Hanford




- Slides: 35
Accelerated Underwriting – Navigating a New Journey Craig Hanford, FSA, MAAA Chicago Actuarial Association Meeting – March 26 th, 2019
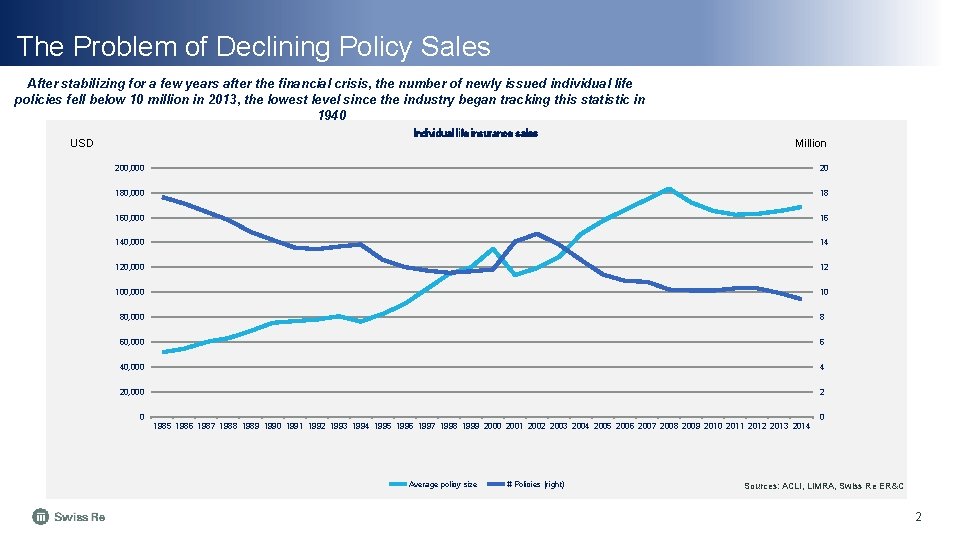
The Problem of Declining Policy Sales After stabilizing for a few years after the financial crisis, the number of newly issued individual life policies fell below 10 million in 2013, the lowest level since the industry began tracking this statistic in 1940 Individual life insurance sales USD Million 200, 000 20 180, 000 18 160, 000 16 140, 000 14 120, 000 12 100, 000 10 80, 000 8 60, 000 6 40, 000 4 20, 000 2 0 0 1985 1986 1987 1988 1989 1990 1991 1992 1993 1994 1995 1996 1997 1998 1999 2000 2001 2002 2003 2004 2005 2006 2007 2008 2009 2010 2011 2012 2013 2014 Average policy size # Policies (right) Sources: ACLI, LIMRA, Swiss Re ER&C 2
Why Accelerated Underwriting? 3
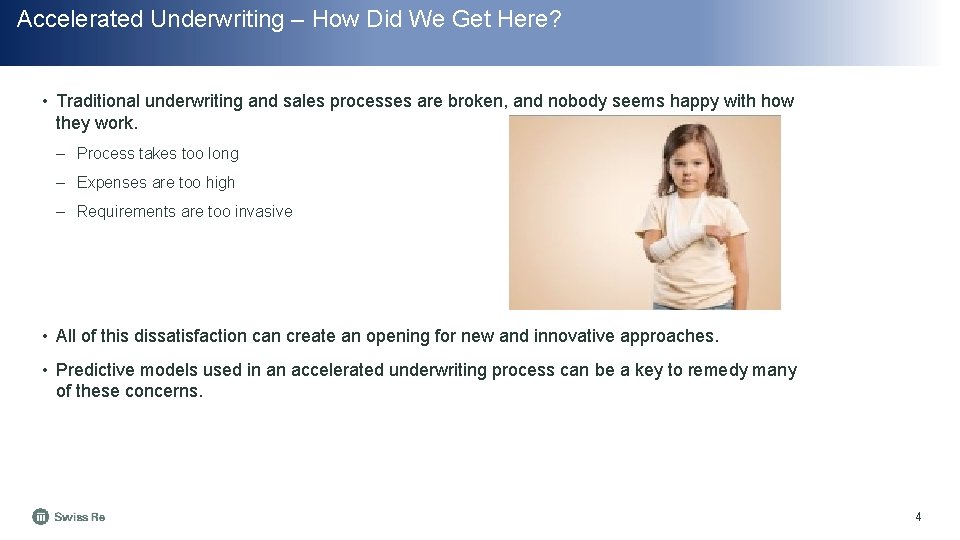
Accelerated Underwriting – How Did We Get Here? • Traditional underwriting and sales processes are broken, and nobody seems happy with how they work. – Process takes too long – Expenses are too high – Requirements are too invasive • All of this dissatisfaction can create an opening for new and innovative approaches. • Predictive models used in an accelerated underwriting process can be a key to remedy many of these concerns. 4
Types of Predictive Models 5
Different Types of Predictive Models • Propensity to buy (marketing prediction) • Propensity to persist (lapse prediction) • Propensity to survive (mortality prediction) • Other specialized models • Most of these models utilize publicly available information and other details provided by the individual to draw correlations to desired outcomes. 6
Predictive Models for Risk Classification • Most prominent use of predictive modeling for life insurance to date • Potential types of predictive models – Credit – Health/Prescription – Social media – Facial Analytics – Genetics – Others • Goal is to be able to find a model(s) to assess risks effectively – Can we price appropriately? – Have we significantly improved the insurance buying process? 7
General Considerations of Evaluating a Predictive Model • Retrospective study is critical – Use your own data, as results can vary widely by company – Ideal to include both issued policies and applicant data – Examine how the model results vary by preferred, standard, rated, declined, not taken • Risk classification using a model ≠ Risk classification using traditional UW – Other tools (detailed application, reflexive questions, prescription profile) can reduce differences – Neither approach is perfect; understand how the model will classify risks and price accordingly • Vendor-provided mortality results: A/E mortality by risk score – Understand how actual deaths are determined – Usually based on a death master file, where underreporting of deaths is common – May want to share a file of known deaths to see how many are found in the death master file • Cost-Benefit Analysis 8
Cost-Benefit Analysis 9
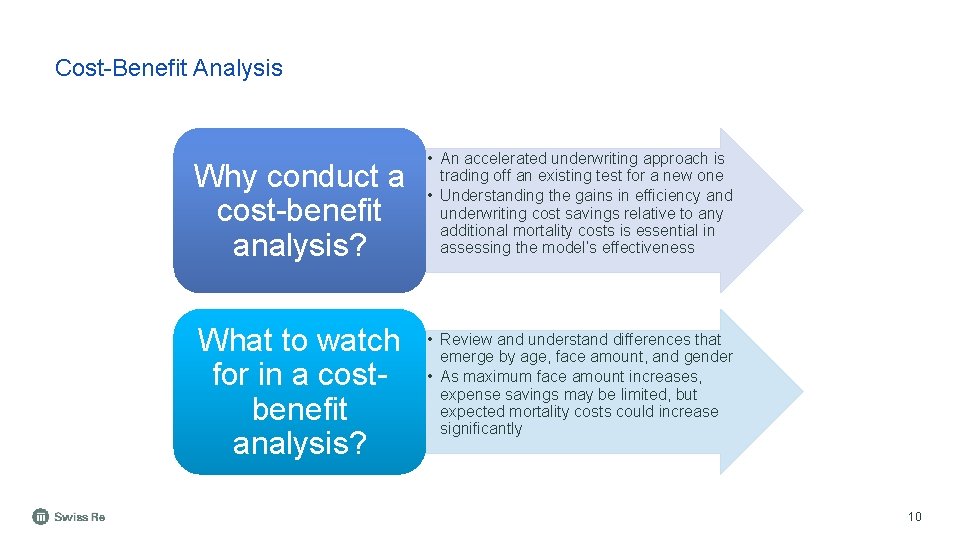
Cost-Benefit Analysis Why conduct a cost-benefit analysis? • An accelerated underwriting approach is trading off an existing test for a new one • Understanding the gains in efficiency and underwriting cost savings relative to any additional mortality costs is essential in assessing the model’s effectiveness What to watch for in a costbenefit analysis? • Review and understand differences that emerge by age, face amount, and gender • As maximum face amount increases, expense savings may be limited, but expected mortality costs could increase significantly 10
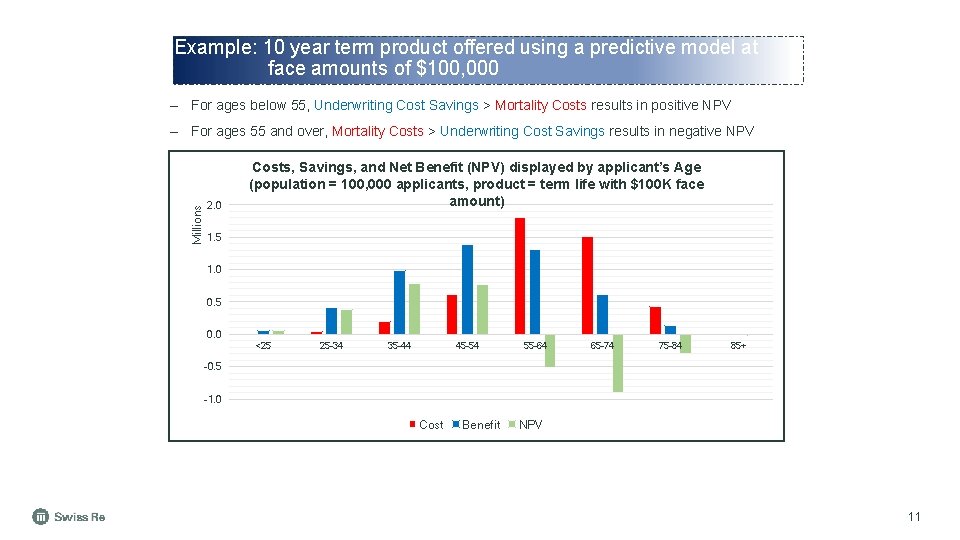
Example: 10 year term product offered using a predictive model at face amounts of $100, 000 – For ages below 55, Underwriting Cost Savings > Mortality Costs results in positive NPV Millions – For ages 55 and over, Mortality Costs > Underwriting Cost Savings results in negative NPV 2. 0 Costs, Savings, and Net Benefit (NPV) displayed by applicant’s Age (population = 100, 000 applicants, product = term life with $100 K face amount) 1. 5 1. 0 0. 5 0. 0 <25 25 -34 35 -44 45 -54 55 -64 65 -74 75 -84 85+ -0. 5 -1. 0 Cost Benefit NPV 11
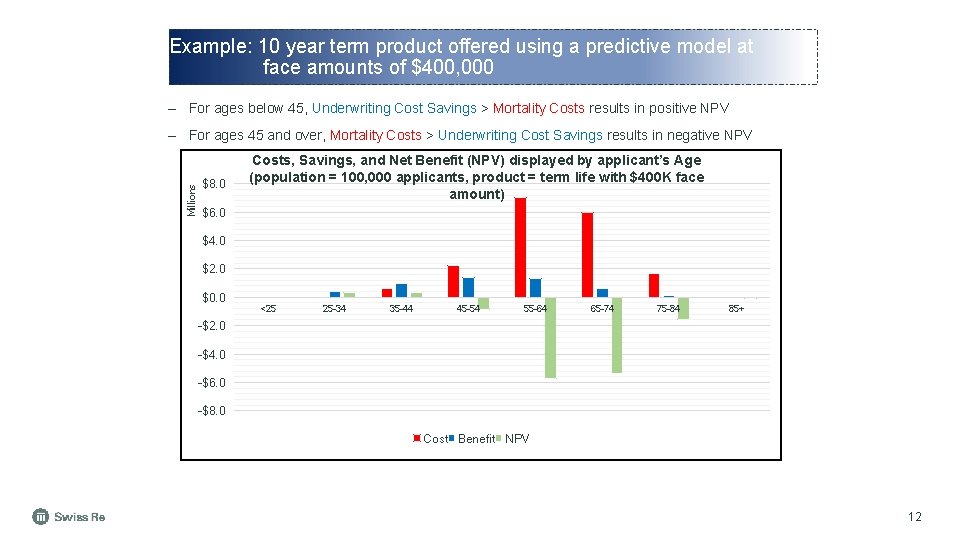
Example: 10 year term product offered using a predictive model at face amounts of $400, 000 – For ages below 45, Underwriting Cost Savings > Mortality Costs results in positive NPV Millions – For ages 45 and over, Mortality Costs > Underwriting Cost Savings results in negative NPV $8. 0 Costs, Savings, and Net Benefit (NPV) displayed by applicant’s Age (population = 100, 000 applicants, product = term life with $400 K face amount) $6. 0 $4. 0 $2. 0 $0. 0 <25 25 -34 35 -44 45 -54 55 -64 65 -74 75 -84 85+ -$2. 0 -$4. 0 -$6. 0 -$8. 0 Cost Benefit NPV 12
Accelerated Underwriting Model Structures 13
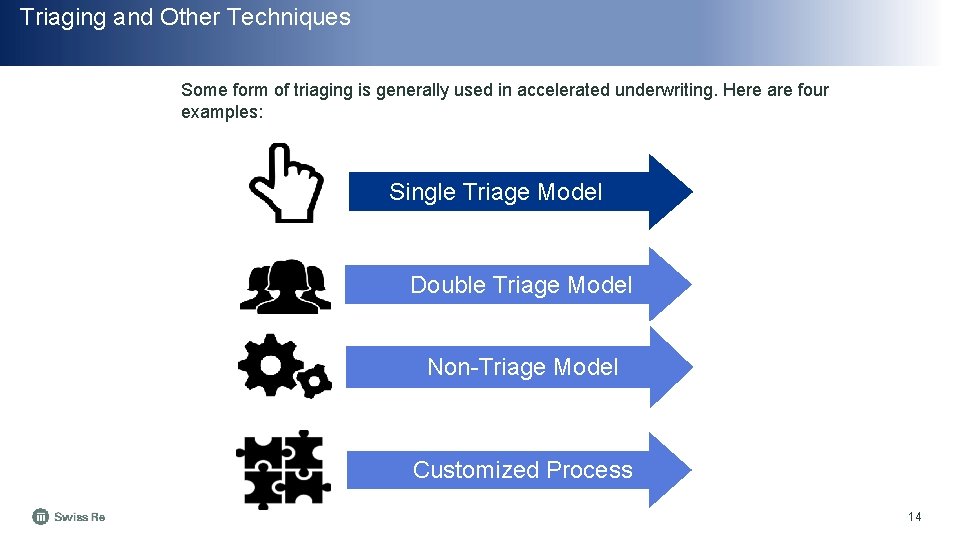
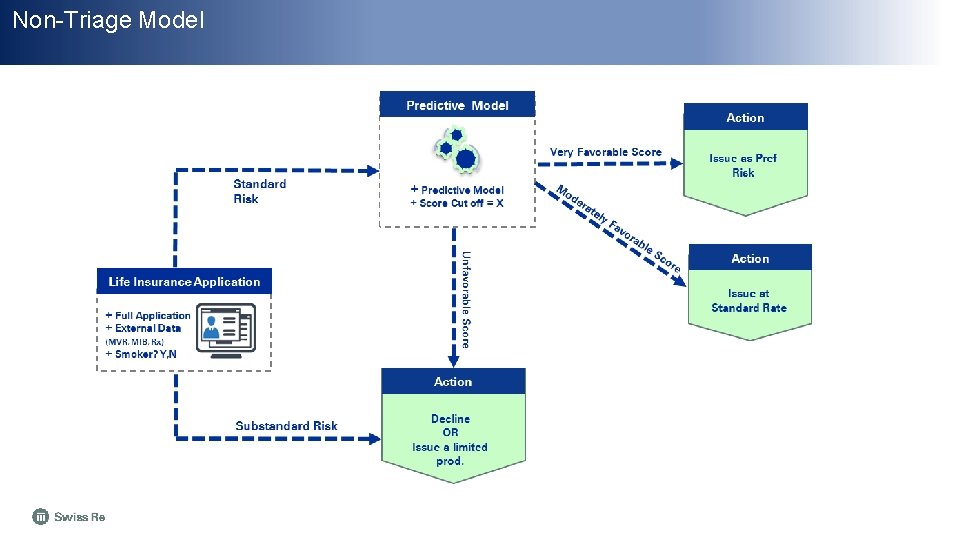
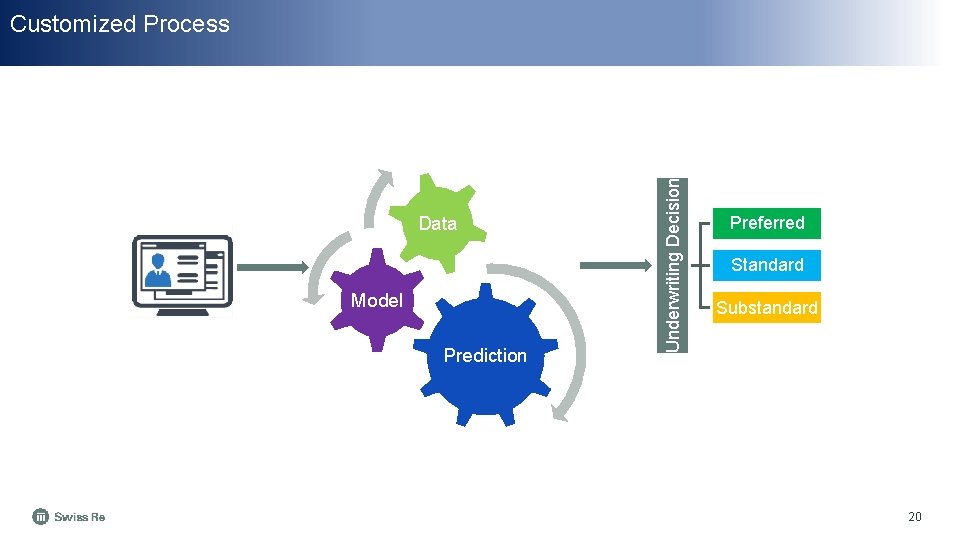
Triaging and Other Techniques Some form of triaging is generally used in accelerated underwriting. Here are four examples: Single Triage Model Double Triage Model Non-Triage Model Customized Process 14
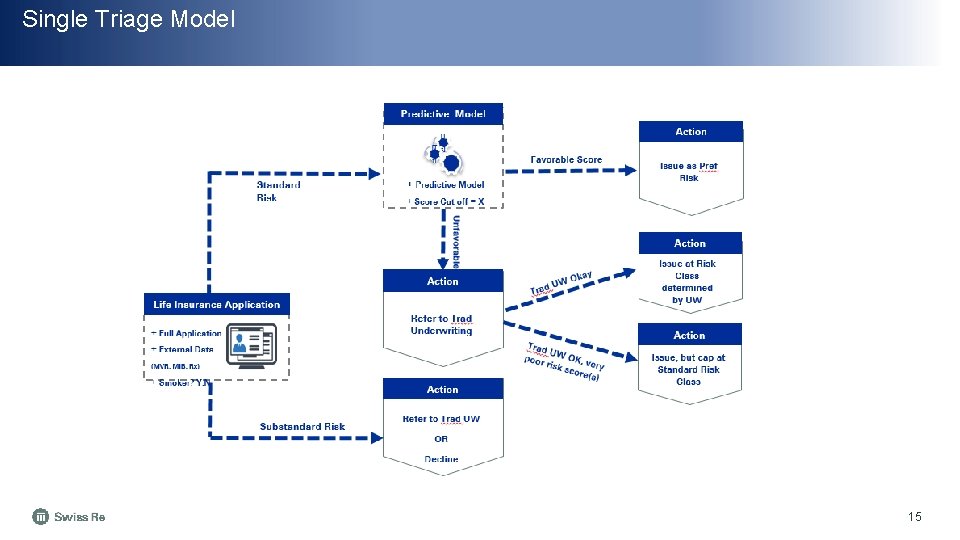
Single Triage Model 15
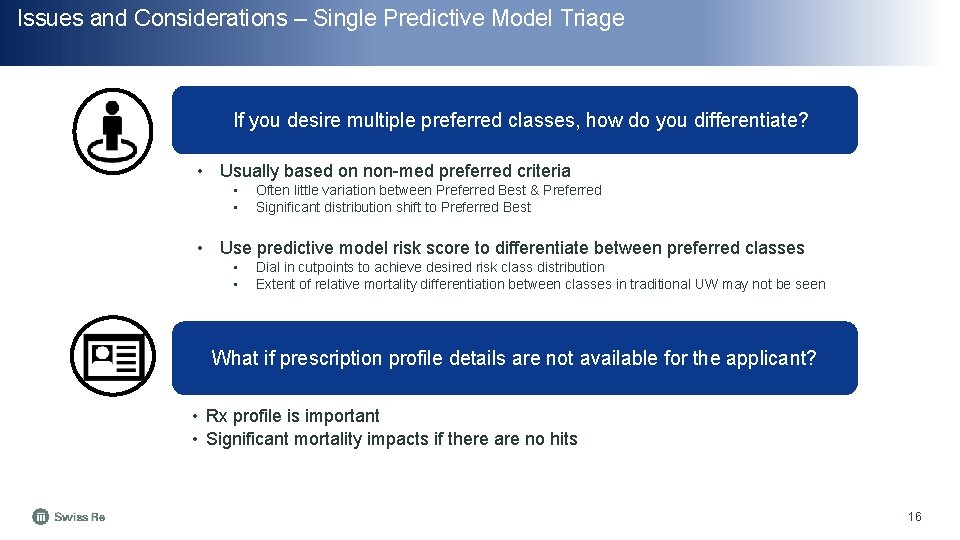
Issues and Considerations – Single Predictive Model Triage If you desire multiple preferred classes, how do you differentiate? • Usually based on non-med preferred criteria • • Often little variation between Preferred Best & Preferred Significant distribution shift to Preferred Best • Use predictive model risk score to differentiate between preferred classes • • Dial in cutpoints to achieve desired risk class distribution Extent of relative mortality differentiation between classes in traditional UW may not be seen What if prescription profile details are not available for the applicant? • Rx profile is important • Significant mortality impacts if there are no hits 16
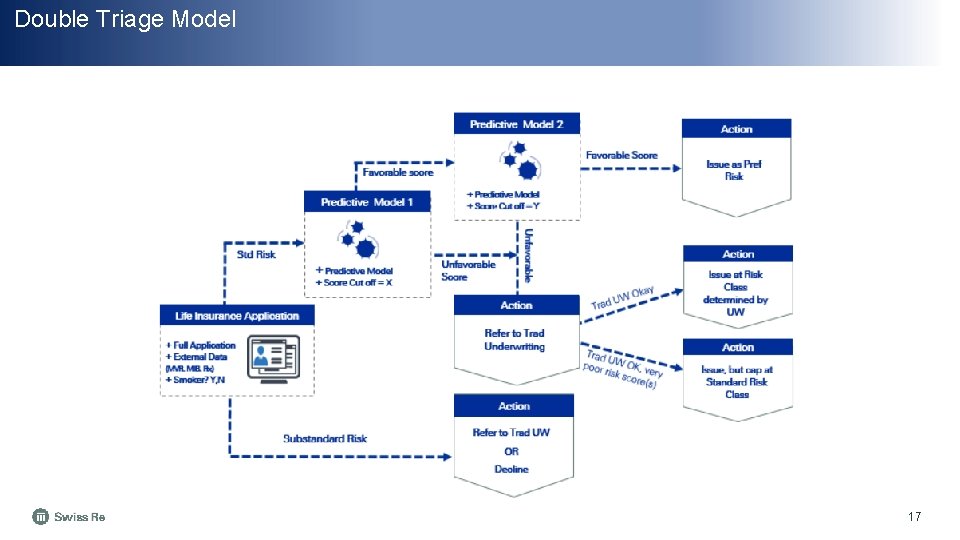
Double Triage Model 17
Non-Triage Model
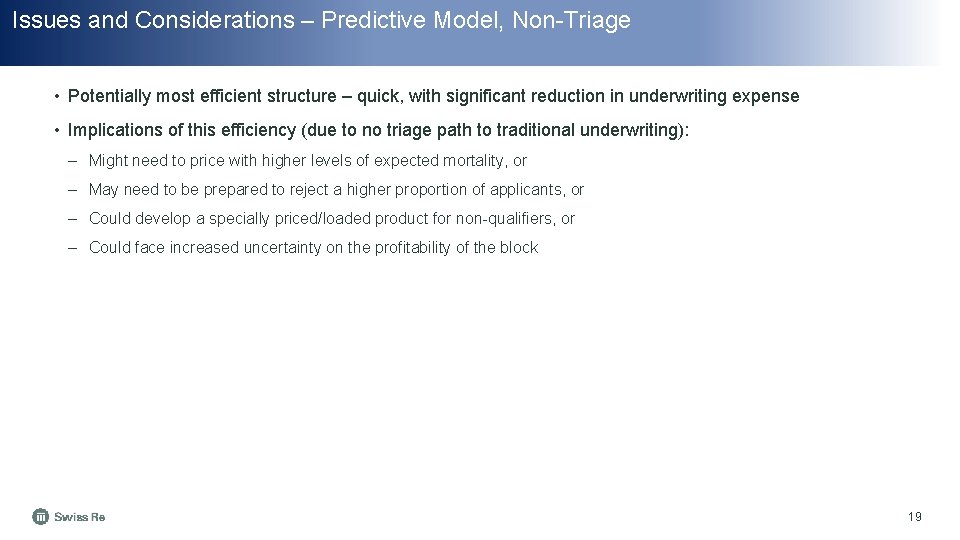
Issues and Considerations – Predictive Model, Non-Triage • Potentially most efficient structure – quick, with significant reduction in underwriting expense • Implications of this efficiency (due to no triage path to traditional underwriting): – Might need to price with higher levels of expected mortality, or – May need to be prepared to reject a higher proportion of applicants, or – Could develop a specially priced/loaded product for non-qualifiers, or – Could face increased uncertainty on the profitability of the block 19
Data Model Prediction Underwriting Decision Customized Process Preferred Standard Substandard 20
Monitoring Efforts 21
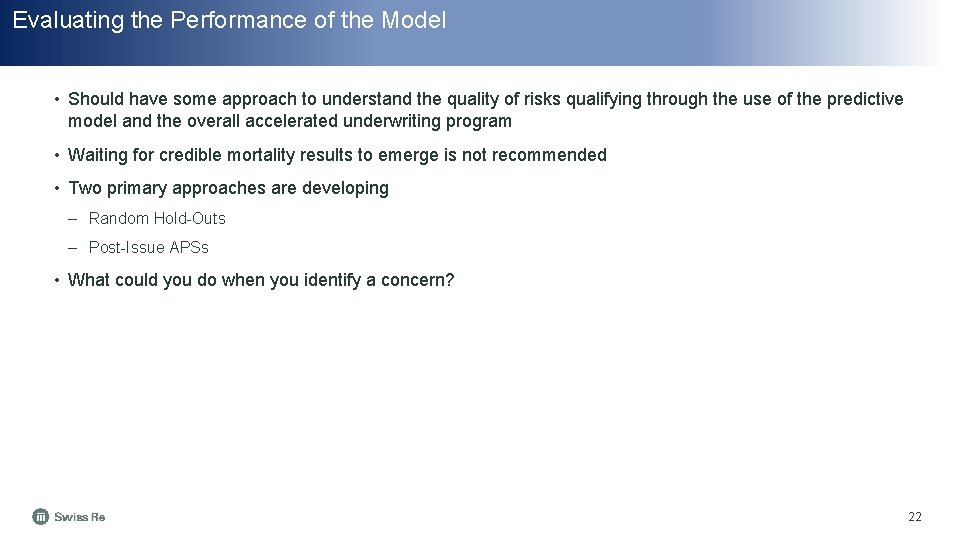
Evaluating the Performance of the Model • Should have some approach to understand the quality of risks qualifying through the use of the predictive model and the overall accelerated underwriting program • Waiting for credible mortality results to emerge is not recommended • Two primary approaches are developing – Random Hold-Outs – Post-Issue APSs • What could you do when you identify a concern? 22
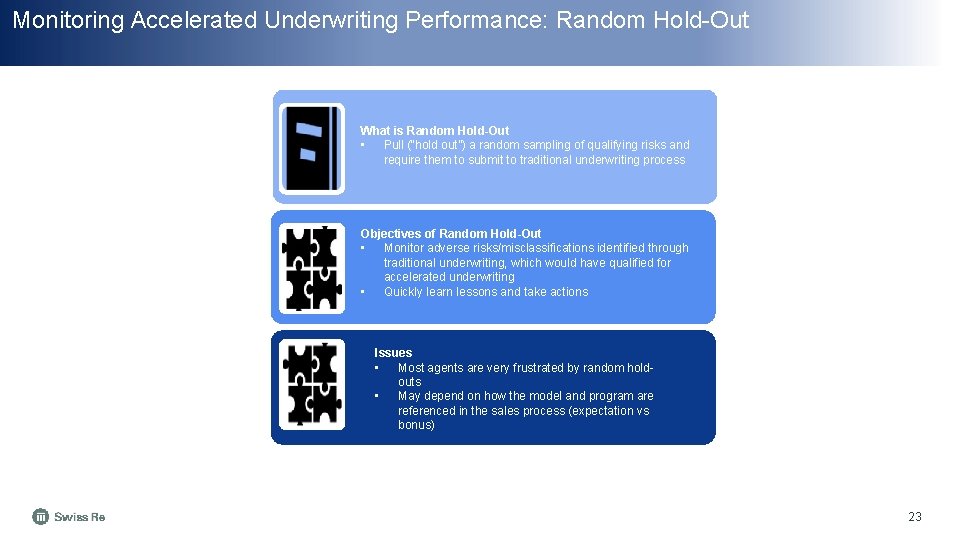
Monitoring Accelerated Underwriting Performance: Random Hold-Out What is Random Hold-Out • Pull (“hold out”) a random sampling of qualifying risks and require them to submit to traditional underwriting process Objectives of Random Hold-Out • Monitor adverse risks/misclassifications identified through traditional underwriting, which would have qualified for accelerated underwriting • Quickly learn lessons and take actions Issues • Most agents are very frustrated by random holdouts • May depend on how the model and program are referenced in the sales process (expectation vs bonus) 23
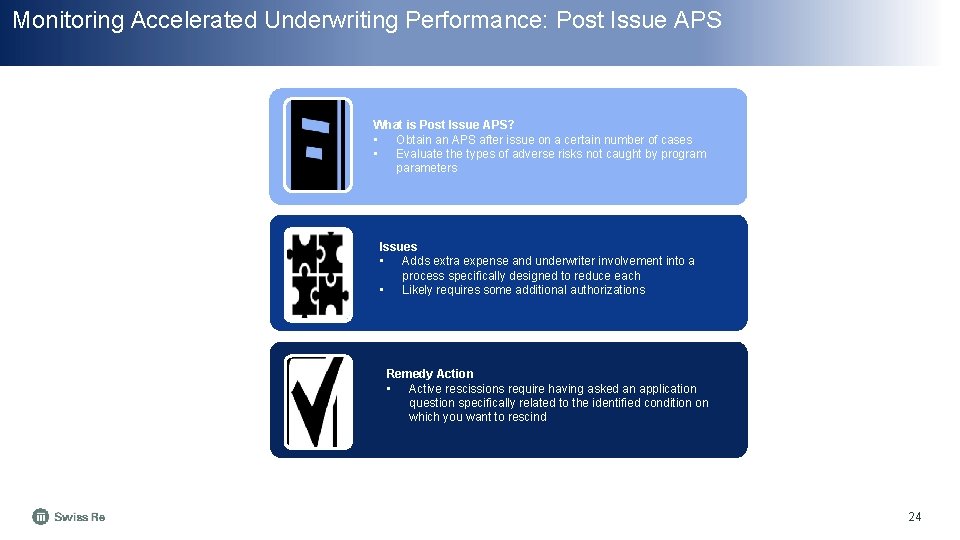
Monitoring Accelerated Underwriting Performance: Post Issue APS What is Post Issue APS? • Obtain an APS after issue on a certain number of cases • Evaluate the types of adverse risks not caught by program parameters Issues • Adds extra expense and underwriter involvement into a process specifically designed to reduce each • Likely requires some additional authorizations Remedy Action • Active rescissions require having asked an application question specifically related to the identified condition on which you want to rescind 24
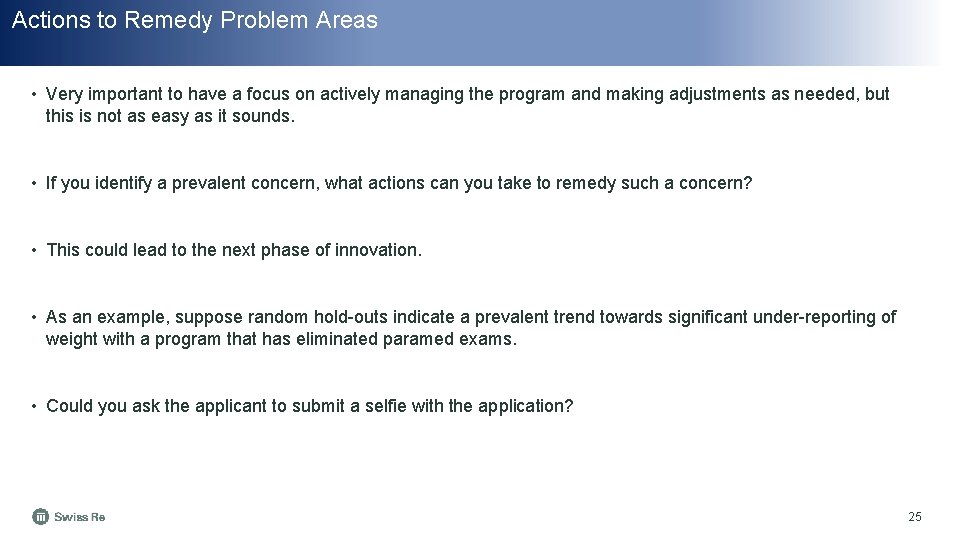
Actions to Remedy Problem Areas • Very important to have a focus on actively managing the program and making adjustments as needed, but this is not as easy as it sounds. • If you identify a prevalent concern, what actions can you take to remedy such a concern? • This could lead to the next phase of innovation. • As an example, suppose random hold-outs indicate a prevalent trend towards significant under-reporting of weight with a program that has eliminated paramed exams. • Could you ask the applicant to submit a selfie with the application? 25
Swiss Re Accelerated Underwriting Survey 26
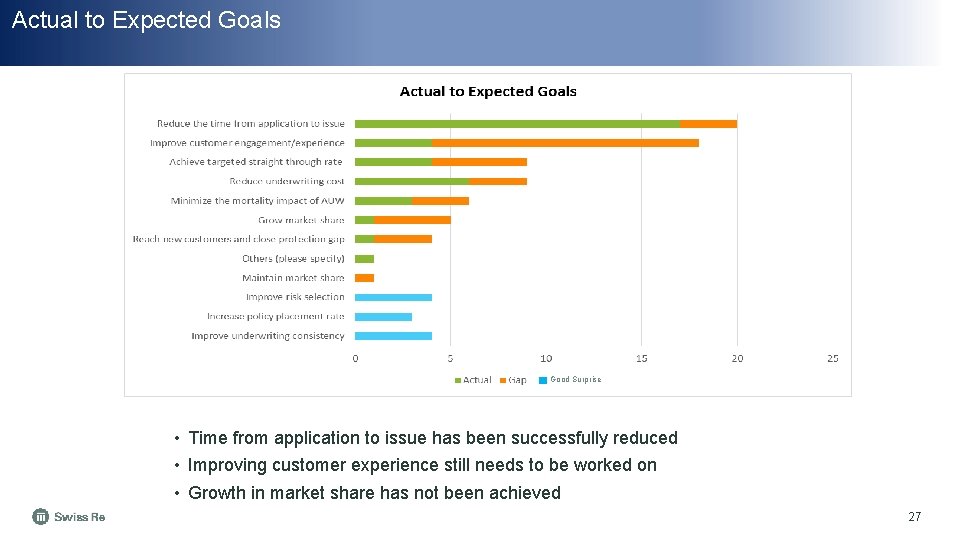
Actual to Expected Goals Good Surprise • Time from application to issue has been successfully reduced • Improving customer experience still needs to be worked on • Growth in market share has not been achieved 27
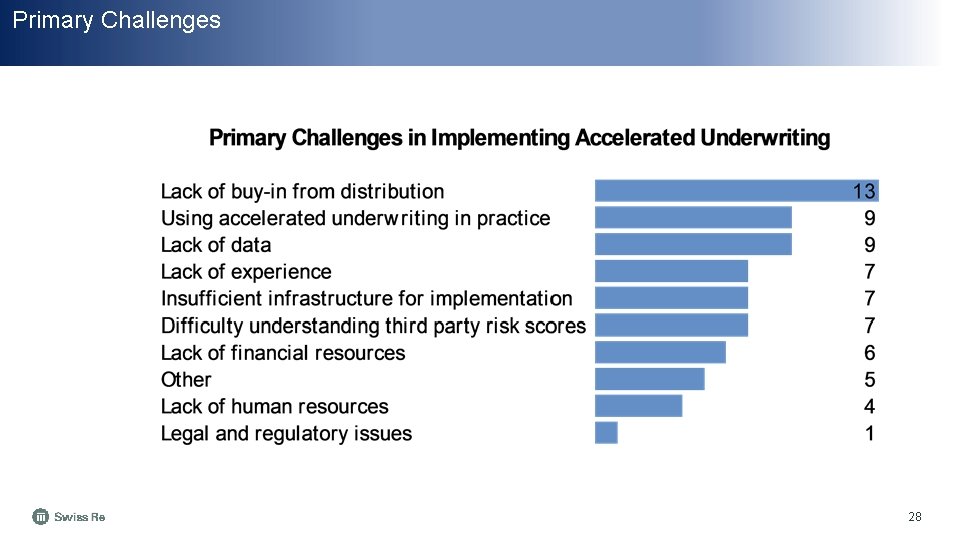
Primary Challenges 28
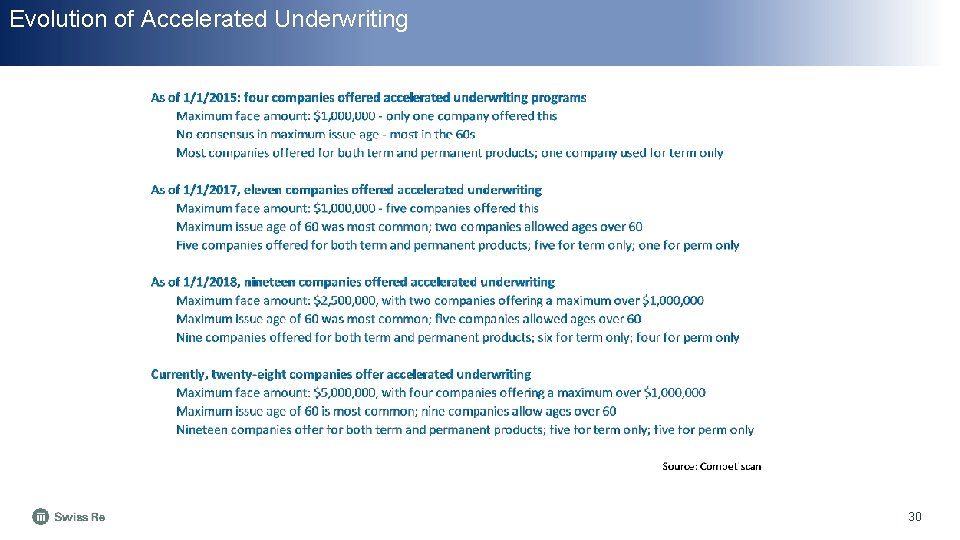
Evolution of Accelerated Underwriting 29
Evolution of Accelerated Underwriting 30
Impact on Actuaries 31
Accelerated Underwriting – Impact on Actuaries • You should be aware of this trend in the industry, and its impact on our future. • The increased utilization of predictive models will affect pricing, modeling, reserving, experience studies. • Plus, tremendous opportunities for creativity and new ways of thinking. • This all creates an interesting evolution of the actuary’s responsibilities and opportunities. Those who are aware and active are better positioned to respond effectively. 32
Questions? 33
34
Legal notice © 2019 Swiss Re. All rights reserved. You are not permitted to create any modifications or derivative works of this presentation or to use it for commercial or other public purposes without the prior written permission of Swiss Re. The information and opinions contained in the presentation are provided as at the date of the presentation and are subject to change without notice. Although the information used was taken from reliable sources, Swiss Re does not accept any responsibility for the accuracy or comprehensiveness of the details given. All liability for the accuracy and completeness thereof or for any damage or loss resulting from the use of the information contained in this presentation is expressly excluded. Under no circumstances shall Swiss Re or its Group companies be liable for any financial or consequential loss relating to this presentation. 35