7 5 Exponential functions Day 1 Asymptote A



- Slides: 20
7. 5 – Exponential functions Day 1
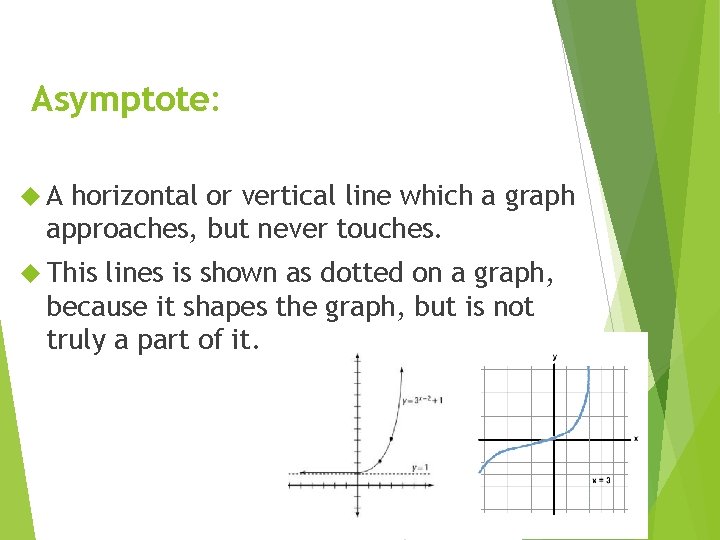
Asymptote: A horizontal or vertical line which a graph approaches, but never touches. This lines is shown as dotted on a graph, because it shapes the graph, but is not truly a part of it.
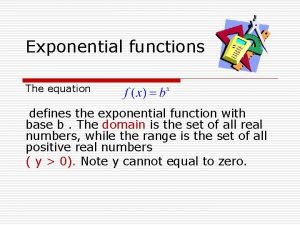
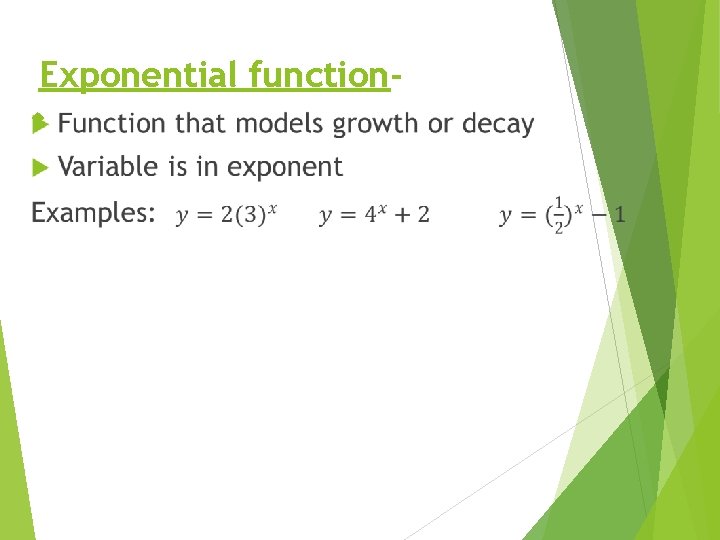
Exponential function
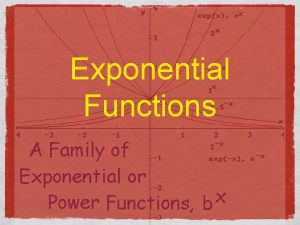
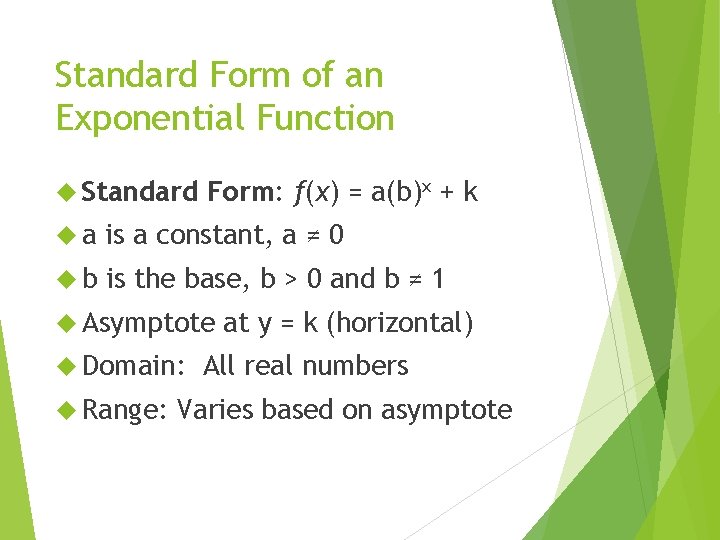
Standard Form of an Exponential Function Standard Form: f(x) = a(b)x + k a is a constant, a ≠ 0 b is the base, b > 0 and b ≠ 1 Asymptote Domain: Range: at y = k (horizontal) All real numbers Varies based on asymptote
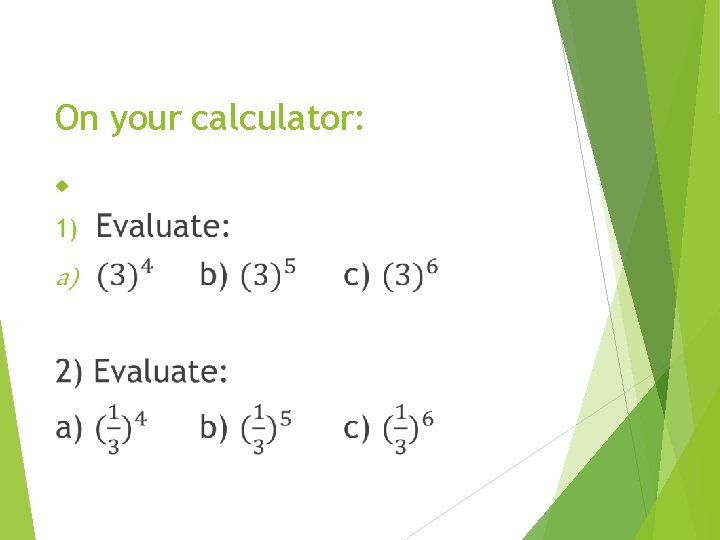
On your calculator:
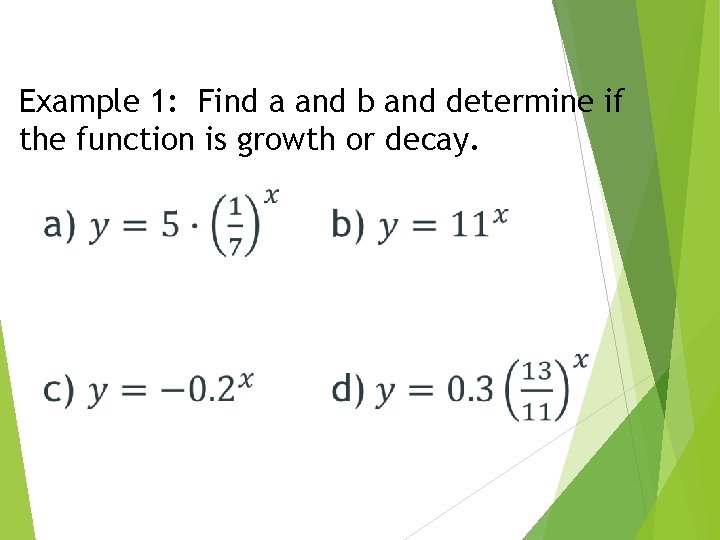
Example 1: Find a and b and determine if the function is growth or decay.
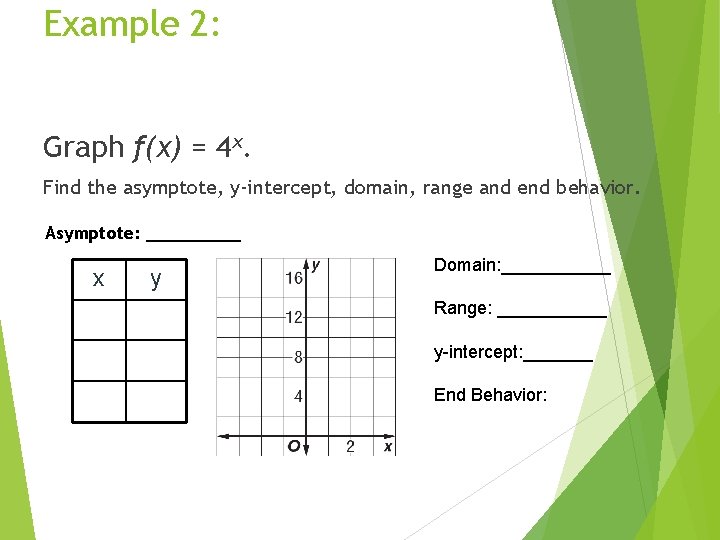
Example 2: Graph f(x) = 4 x. Find the asymptote, y-intercept, domain, range and end behavior. Asymptote: _____ x y Domain: ______ Range: ______ y-intercept: _______ End Behavior:
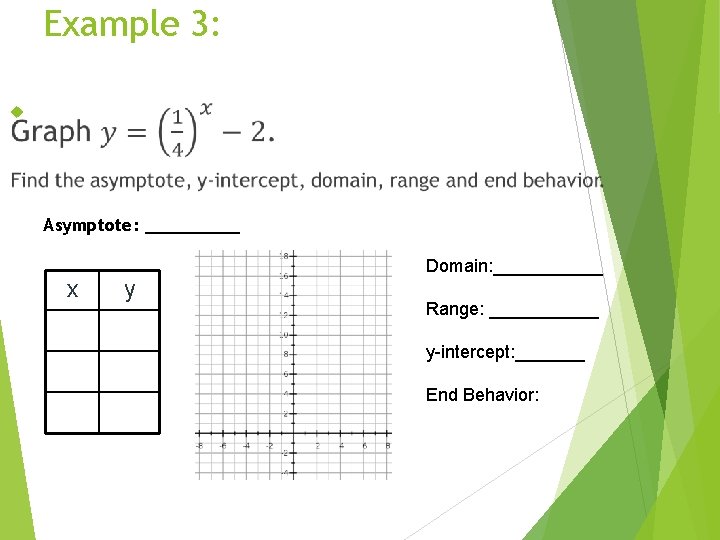
Example 3: Asymptote: _____ x y Domain: ______ Range: ______ y-intercept: _______ End Behavior:
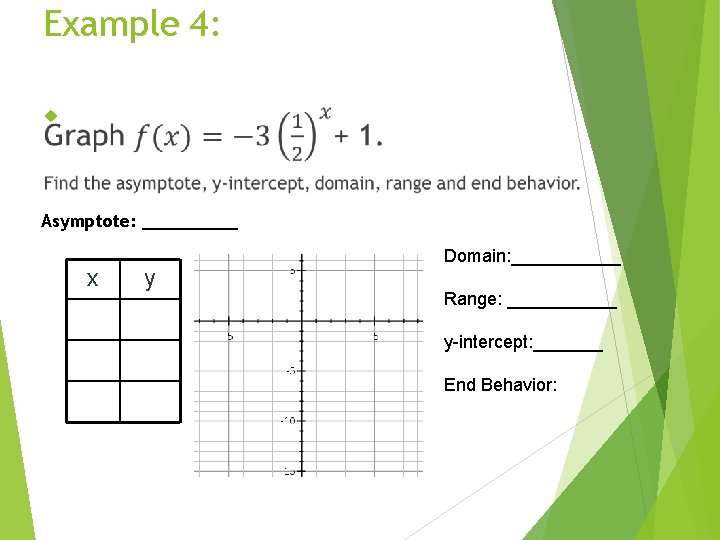
Example 4: Asymptote: _____ x y Domain: ______ Range: ______ y-intercept: _______ End Behavior:
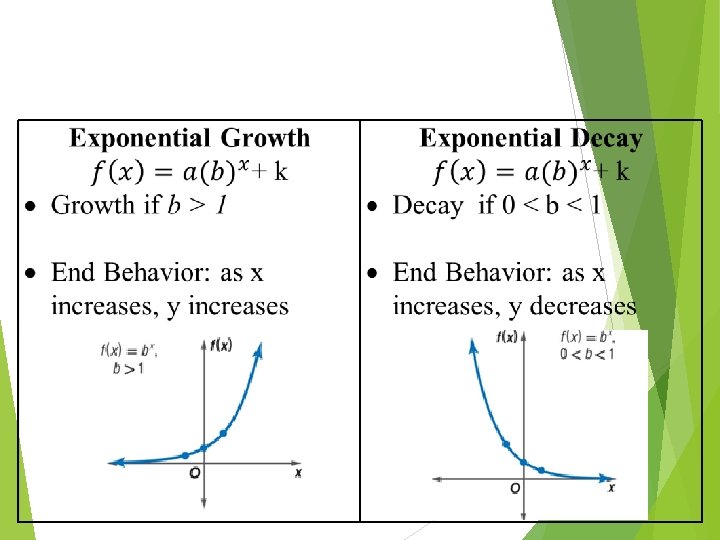
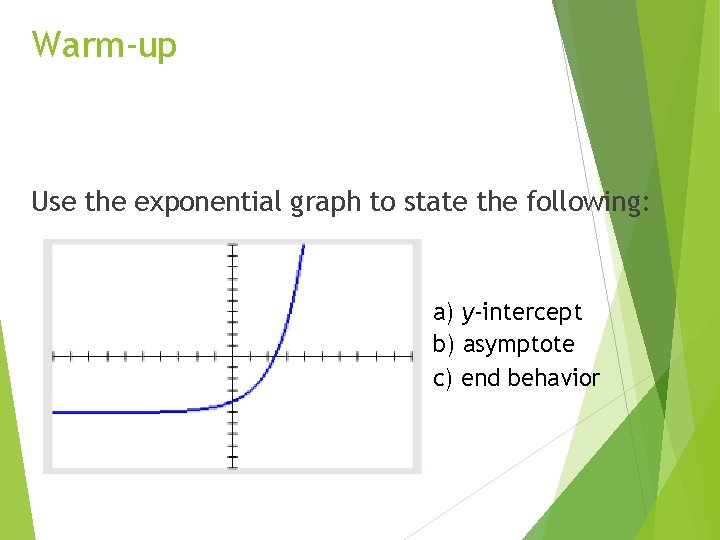
Warm-up Use the exponential graph to state the following: a) y-intercept b) asymptote c) end behavior
7. 5 – Exponential functions Day 2
Algebra 1 Remaining Homework Due tomorrow: p. 434 #4 – 12 evens Due Wednesday: Unit 4 Review Packet (white) Due Friday: Midterm Review Packet (yellow) #30 – 50 Due Monday: Midterm Review Packet (yellow) #1 - 29
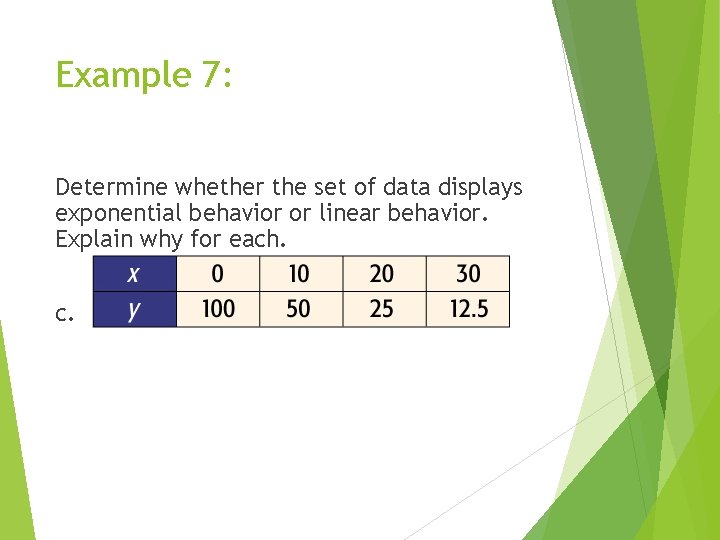
Linear vs. Exponential Linear: constant rate of change *Pattern is adding or subtracting same value for all x values and all y values *take 2 nd y value and subtract 1 st y value, check to see if pattern continues Exponential: not a constant rate of change *Pattern is multiplying or dividing the same value for all x values and y values *take 2 nd y value and divide by 1 st y value, check to see if pattern continues
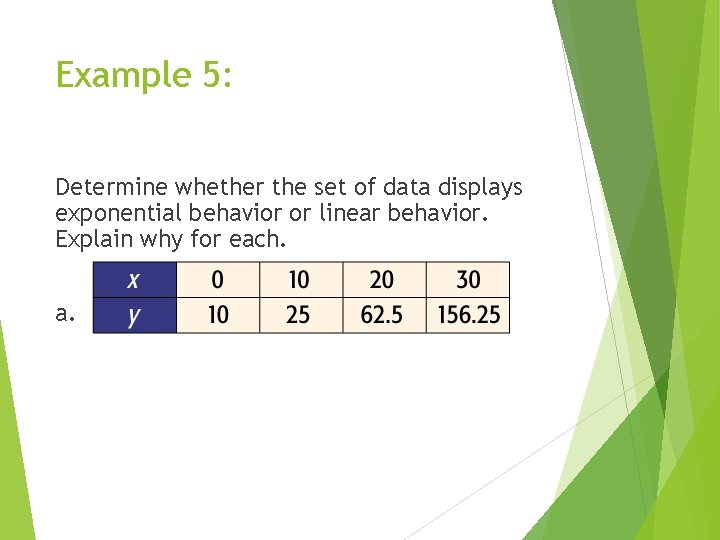
Example 5: Determine whether the set of data displays exponential behavior or linear behavior. Explain why for each. a.
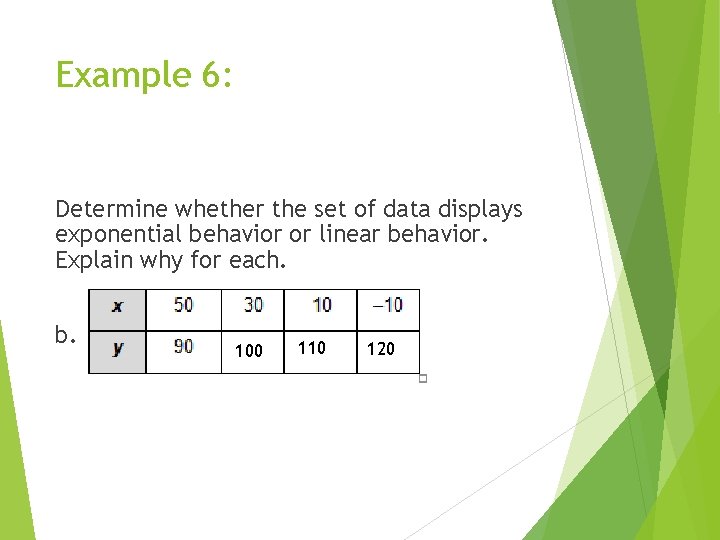
Example 6: Determine whether the set of data displays exponential behavior or linear behavior. Explain why for each. b. 100 110 120
Example 7: Determine whether the set of data displays exponential behavior or linear behavior. Explain why for each. c.
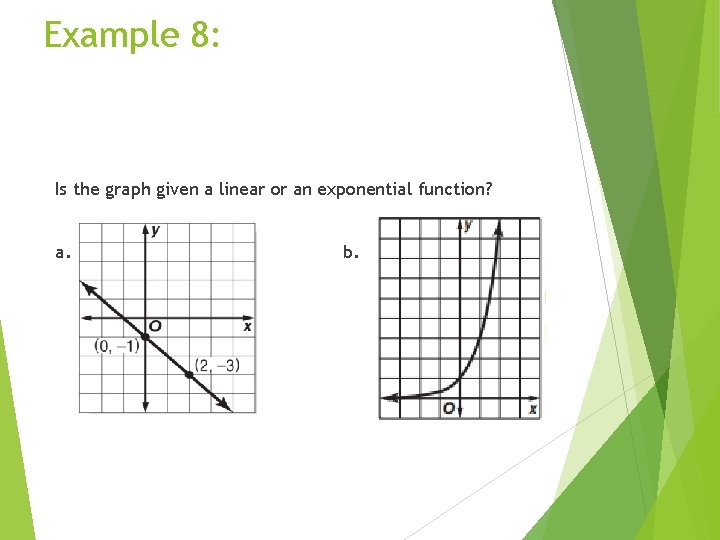
Example 8: Is the graph given a linear or an exponential function? a. b.
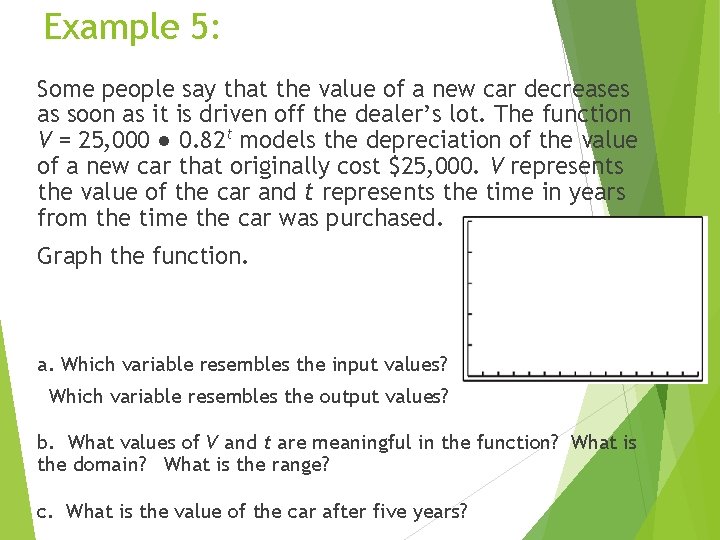
Example 5: Some people say that the value of a new car decreases as soon as it is driven off the dealer’s lot. The function V = 25, 000 ● 0. 82 t models the depreciation of the value of a new car that originally cost $25, 000. V represents the value of the car and t represents the time in years from the time the car was purchased. Graph the function. a. Which variable resembles the input values? Which variable resembles the output values? b. What values of V and t are meaningful in the function? What is the domain? What is the range? c. What is the value of the car after five years?
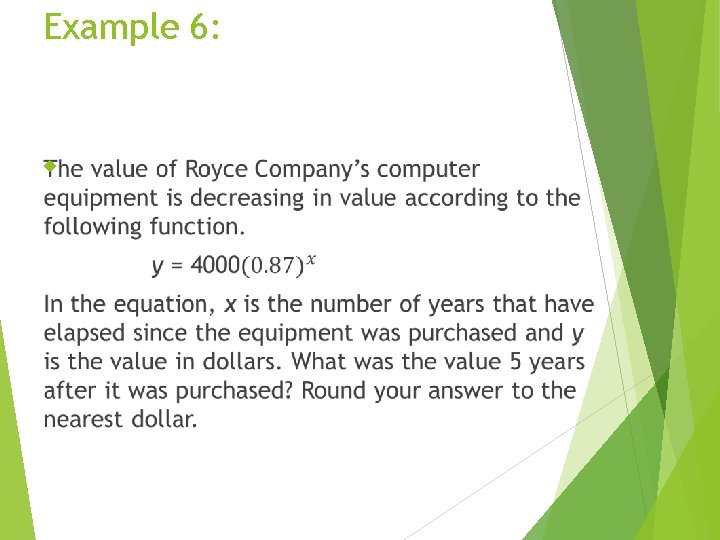
Example 6: