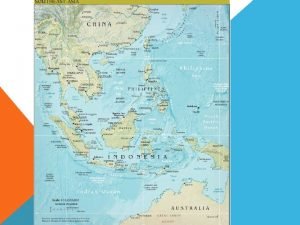
Volcanic Eruptions in South East Asia The Cause


- Slides: 18

Volcanic Eruptions in South East Asia The Cause of All ENSO Events Descriptive Paper on the Earth and Space Science Open Archive - Publications - Keith Potts © Keith Potts EGU April 2021

One South East Asian Eruption 2014 NASA Image Sangeang Volcano: Eruption May 2014 to Nov 2015 Plume ~ 200 Km wide © Keith Potts Slide 2 EGU April 2021

Areas Of Interest SEAP Area Central SEAP (CSEAP) Area SEAP: South East Asian Plume SEAP Area: The most volcanically active area ~18% of eruptions in 3% of the surface CSEAP: Central SEAP Area where the anthropogenic SEAP is most intense Red Triangles: Volcanoes (Global Volcanism Program (GVP)) Yellow Marker: Sangeang Volcano Continuously erupting volcanoes: 5 against 16 globally (Simkin and Siebert, 2000) © Keith Potts Slide 3 EGU April 2021

NOAA Diagram Walker Circulation Shows the “normal” Walker Circulation with rising air over south east Asia and falling air in the central and eastern Pacific Ocean (the Nino Areas) © Keith Potts Slide 4 EGU April 2021

After NOAA - Walker Circulation & VSEAP Shows how the VSEAP perturbs the Walker Circulation © Keith Potts Slide 5 EGU April 2021

SEAP Area Decadal totals of Volcanic Eruptions and Tephra Shows that volcanic activity in S. E. Asia varies significantly over the decades with activity in recent decades well above the 20 th century averages © Keith Potts Slide 6 EGU April 2021

SEAP Area VEIT and Nino 3. 4 SST Note 1883 excluded due to the Krakatau eruption. VEIT – Tephra estimated using VEI from the Global Volcanism Program at the Smithsonian Institution and the table in (Newhall and Self 1982). Nino 3. 4 SST from NOAA Shows a rise of ~0. 2ºC from the low VEIT to the high. Also shows that 29 in 147 years show higher Nino 3. 4 SST or an average return period of 5 years which mirrors the known ENSO period of 2 to 7 years. Shows the average annual Nino 3. 4 SST and the SEAP Area VEI-T from 1870 to 2018 at VEIT levels <0. 025 Km 3 and > 0. 025 Km 3. © Keith Potts Slide 7 EGU April 2021

Last Millennium Ensemble (LME) CSEAP Area AOD and Nino 3. 4 SST Volcanic Simulation - Run 5 Only Shows that in all seasons the CSEAP Area AOD and Nino 3. 4 SST correlate at extremely high levels with R 2 values ranging from 0. 57 (MAM) to 0. 74 (JJA) indicating that aerosols control over 50% of the Nino 3. 4 SST variation in the LME data in all seasons. Note: in the LME data volcanic eruptions are prescribed and the causal direction must therefore be from the volcanic aerosols to the Nino 3. 4 SST © Keith Potts Slide 8 EGU April 2021

Segmented LME CSEAP AOD, the Nino Indices and the SOI Data from the 850, GHG, Land, Orbital, Solar and Volcanic Simulations The LME data has been segmented and averaged on the basis of AOD Note the R 2 values!! © Keith Potts Slide 9 EGU April 2021

NASA MERRA-2 Reanalysis 1980 -2020 Annual AOD CSEAP Area and NINO 3. 4 SST Note: NASA MERRA-2 assimilates aerosols and is therefore a good representation of real data. An R 2 value of 0. 55 shows aerosols control 55% of the variation in the MERRA-2 Nino 3. 4 SST © Keith Potts Slide 10 EGU April 2021

Seasonality of ENSO and Rainfall in the CSEAP Area Correlation -0. 43 © Keith Potts Slide 11 EGU April 2021

Other Effects Associated with ENSO © Keith Potts EGU April 2021

LME - Global Temperature Data from the 850, GHG, Land, Orbital, Solar and Volcanic Simulations The LME data has been segmented and averaged on the basis of AOD Note the R 2 value!! © Keith Potts Slide 13 EGU April 2021

LME - Drought in South Eastern Australia – Rainfall and Pressure Data from the 850, GHG, Land, Orbital, Solar and Volcanic Simulations Drought in south eastern Australia which is commonly linked to ENSO is better explained by volcanic and anthropogenic aerosols over south east Asia © Keith Potts Slide 14 EGU April 2021

LME - Indian Ocean Dipole Data from the 850, GHG, Land, Orbital, Solar and Volcanic Simulations The IOD is commonly linked to ENSO but is better explained by volcanic and anthropogenic aerosols over south east Asia © Keith Potts Slide 15 EGU April 2021

Acknowledgements I thank: • NASA for: • The image of Sangeang; • The MERRA-2 reanalysis data; • Google Earth for the image of the Areas of Interest; • NOAA for the Walker Circulation diagram and the Nino 3. 4 SST data; • The Global Volcanism Program at the Smithsonian for the volcano data; • The CESM 1(CAM 5) Last Millennium Ensemble Community Project and supercomputing resources provided by NSF/CISL/Yellowstone; © Keith Potts Slide 16 EGU April 2021

References GELARO, R. , MCCARTY, W. , SUÁREZ, M. J. , TODLING, R. , MOLOD, A. , TAKACS, L. , RANDLES, C. A. , DARMENOV, A. , BOSILOVICH, M. G. , REICHLE, R. , WARGAN, K. , COY, L. , CULLATHER, R. , DRAPER, C. , AKELLA, S. , BUCHARD, V. , CONATY, A. , SILVA, A. M. D. , GU, W. , KIM, G. -K. , KOSTER, R. , LUCCHESI, R. , MERKOVA, D. , NIELSEN, J. E. , PARTYKA, G. , PAWSON, S. , PUTMAN, W. , RIENECKER, M. , SCHUBERT, S. D. , SIENKIEWICZ, M. & ZHAO, B. 2017. The Modern-Era Retrospective Analysis for Research and Applications, Version 2 (MERRA-2). Journal of Climate, 30, 5419 -5454. IPCC 2007. IPCC Assessment Report 4 Glossary. IPCC 2013. Climate Change 2013: The Physical Science Basis. Contribution of Working Group I to the Fifth Assessment Report of the Intergovernmental Panel on Climate Change. In: STOCKER, T. F. , D. QIN, G. -K. PLATTNER, M. TIGNOR, S. K. ALLEN, J. BOSCHUNG, A. NAUELS, Y. XIA, V. BEX AND P. M. MIDGLEY (EDS. ) (ed. ) IPCC. Cambridge, United Kingdom and New York, NY, USA. NEWHALL, C. G. & SELF, S. 1982. The volcanic explosivity index (VEI) an estimate of explosive magnitude for historical volcanism. Journal of Geophysical Research: Oceans, 87, 1231 -1238. OTTO-BLIESNER, B. L. , BRADY, E. C. , FASULLO, J. , JAHN, A. , LANDRUM, L. , STEVENSON, S. , ROSENBLOOM, N. , MAI, A. & STRAND, G. 2016. Climate Variability and Change since 850 CE: An Ensemble Approach with the Community Earth System Model. Bulletin of the American Meteorological Society, 97, 735 -754. SIMKIN, T. & SIEBERT, L. 2000. Earth’s volcanoes and eruptions: an overview p. 249 -261. . In: H, S. (ed. ) Encyclopedia of Volcanoes, . San Diego: Academic Press. VENZKE, E. 2013. Volcanoes of the World. v. 4. 9. 1 (17 Sep 2020) http: //dx. doi. org/10. 5479/si. GVP. VOTW 4 -2013. In: PROGRAM, S. I. G. V. (ed. ). © Keith Potts Slide 17 EGU April 2021

EGU Meeting 2021 How Volcanic Eruptions in South East Asia cause ENSO Events Researchers have tried to connect volcanic eruptions with ENSO for generations and failed because their focus was on large eruptions and stratospheric aerosols. South east Asia is unique being: The most volcanically active region; with 5 continuously erupting volcanoes; The largest area of convection in the world; and The region which drives thermally direct Walker Circulation Hence tropospheric aerosols from volcanic eruptions in this region are uniquely positioned to perturb the Walker Circulation and the Display Material 4 and 5 shows how this is achieved. 6 Shows the GVP decadal eruptions and ejected tephra in the SEAP Area. 7 Shows the NOAA Nino 3. 4 SST and GVP tephra allocated to low and high tephra years. 9 & 10 Show the LME data for the three Nino indices against the segmented AOD of the CSEAP Area with R squared values of 1. 00 for all three and MERRA-2 data!! 11 Shows the seasonality of Nino 3. 4 SST and rainfall in the CSEAP Area 13 - 15 Show other events associated with ENSO are better explained by the (V)SEAP 16 & 17 Show acknowledgements and citations. Hence only volcanoes in South East Asia caused historic ENSO events. In recent decades the volcanic plume has been intensified by anthropogenic aerosols especially from September to November. Note: The LME aerosol range is far too low compared with MERRA-2. Why? ? Slide 1 includes a link to papers on the Earth and Space Science Open Archive; © Keith Potts Slide 18 EGU April 2021
 Lesson 8 middle east and south asia
 Horizontal movement of air is called
 East asia
 Asia geography
 Chapter 27 tradition and change in east asia
 Chapter 27 section 1 landforms and resources
 Chapter 13 the resurgence of empire in east asia
 Chapter 27 tradition and change in east asia
 Southern and eastern asia physical features map
 Physical geography of east asia
 Chapter 15 the resurgence of empire in east asia
 Physical geography of east asia
 Human geography of the middle east
 East asia & sushi
 Chapter 26 tradition and change in east asia
 Chang'an
 Mon khmer
 Chapter 15 the resurgence of empire in east asia
 The commander of the german east asia squadron was
