U S INDC Christo Artusio Director Office of
- Slides: 11
U. S. INDC Christo Artusio Director, Office of Global Change U. S. Department of State
OVERVIEW • On March 31, 2015, the U. S. communicated its INDC - as well as information to facilitate the clarity, transparency & understanding of the INDC, to the UNFCCC. • The U. S. INDC reflects an extensive, rigorous interagency planning process to identify and assess opportunities to deliver emission reductions by 2025. • A number of existing laws, regulations, and other domestically mandatory measures are relevant to the implementation of the target. Source: www. whitehouse. gov 2
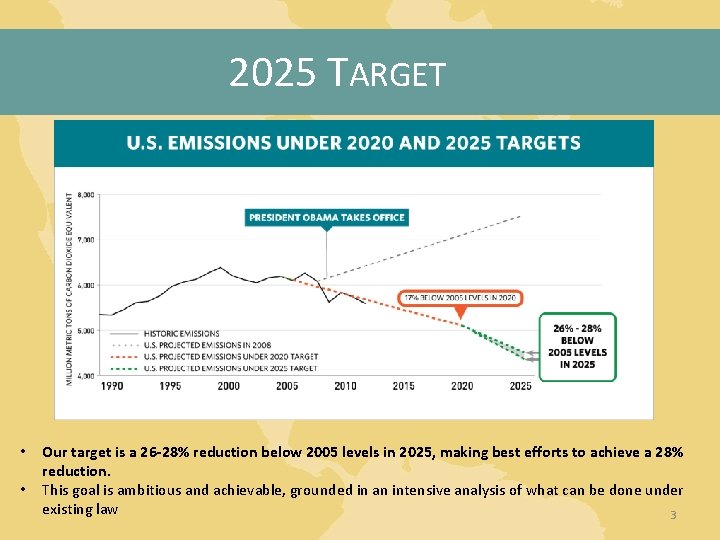
2025 TARGET • • Our target is a 26 -28% reduction below 2005 levels in 2025, making best efforts to achieve a 28% reduction. This goal is ambitious and achievable, grounded in an intensive analysis of what can be done under existing law 3
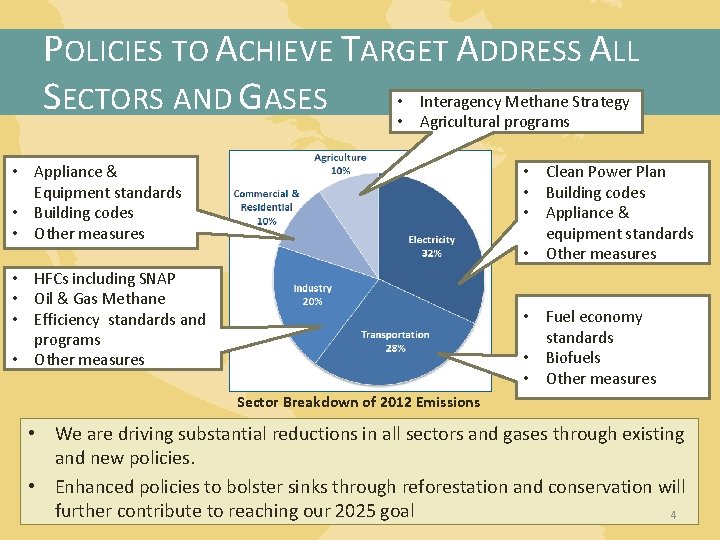
POLICIES TO ACHIEVE TARGET ADDRESS ALL • Interagency Methane Strategy SECTORS AND GASES • Agricultural programs • Appliance & Equipment standards • Building codes • Other measures • Clean Power Plan • Building codes • Appliance & equipment standards • Other measures • HFCs including SNAP • Oil & Gas Methane • Efficiency standards and programs • Other measures • Fuel economy standards • Biofuels • Other measures Sector Breakdown of 2012 Emissions • We are driving substantial reductions in all sectors and gases through existing and new policies. • Enhanced policies to bolster sinks through reforestation and conservation will further contribute to reaching our 2025 goal 4
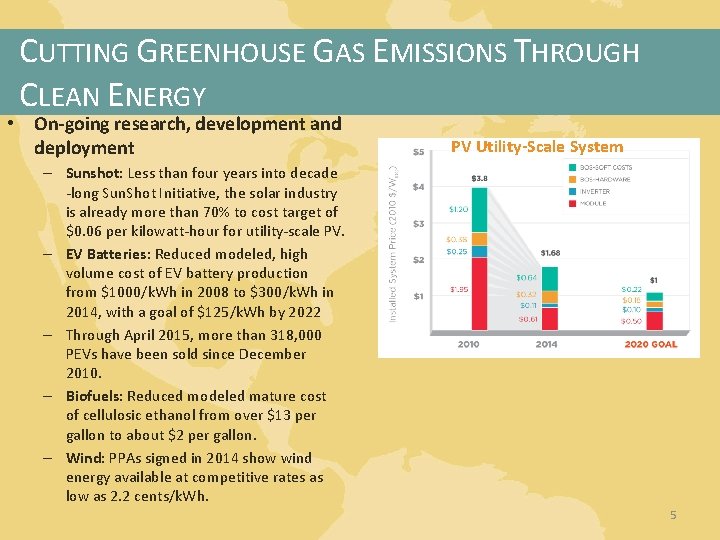
CUTTING GREENHOUSE GAS EMISSIONS THROUGH CLEAN ENERGY • On-going research, development and deployment PV Utility-Scale System – Sunshot: Less than four years into decade -long Sun. Shot Initiative, the solar industry is already more than 70% to cost target of $0. 06 per kilowatt-hour for utility-scale PV. – EV Batteries: Reduced modeled, high volume cost of EV battery production from $1000/k. Wh in 2008 to $300/k. Wh in 2014, with a goal of $125/k. Wh by 2022 – Through April 2015, more than 318, 000 PEVs have been sold since December 2010. – Biofuels: Reduced modeled mature cost of cellulosic ethanol from over $13 per gallon to about $2 per gallon. – Wind: PPAs signed in 2014 show wind energy available at competitive rates as low as 2. 2 cents/k. Wh. 5
CUTTING GREENHOUSE GAS EMISSIONS THROUGH CLEAN ENERGY • Develop carbon pollution standards for new and existing power plants – – Delivered proposed Standards for new power plants in Sep 2013 Delivered proposed Standards for existing power plants in June 2014 Final rules by summer 2015 Proposal would reduce power-sector CO 2 emissions to 30% below 2005 levels by 2030 • Double electricity generation from solar and wind in the U. S. again by 2020 – – – Builds on previous doubling from 2009 to 2012 New target of 20 percent by 2020 renewables procurement for the Federal government Half of new installed capacity in 2014 was renewable energy U. . S has 20 GW of installed capacity for solar and 66 GW of wind In 2015, the U. S. now has 22 times more deployed solar energy than in 2008 U. S. leads world in wind power generation 6
ENERGY EFFICIENCY POLICIES ALSO DRIVING DOWN EMISSIONS • Major fuel economy standards for cars and light trucks – New standards will double the efficiency of cars and trucks by 2025, reducing over 6, 000 Mt of CO 2 over life of program – First-ever national fuel economy and greenhouse gas emission standards for commercial trucks, vans, and buses for model years 2014 -2018 – New post-2018 fuel economy standards planned for heavy-duty vehicles • Comprehensive buildings sector efficiency measures – The US Department of Energy (DOE) has completed 29 appliance standards since 2009 and is on track to the goal of 3, 000 MMT of cumulative abatement through 2030. – Through Better Buildings Challenge over 3. 5 billion square feet of commercial and industrial buildings on track to achieve 20 percent efficiency gains by 2020; $4. 5 billion invested already. 7
CUTTING GREENHOUSE GAS EMISSIONS BEYOND THE ENERGY SECTOR • Domestic actions to reduce short-lived climate pollutants – On September 16, 2014, White House announced new executive actions and private sector commitments to reduce cumulative global consumption of HFCs by the equivalent of 700 million metric tons of CO 2 e through 2025, or 1. 5% of the world’s 2010 GHG emissions – The Environmental Protection Agency finalized a rule in April 2015 under the Significant New Alternatives Policy program to expand the list of climate-friendly alternatives to HFCs. – It also proposed a rule in 2014 to prohibit the use of certain HFCs for specific applications, which would reduce 31 to 42 million metric tons of CO 2 e in 2020. 8
CUTTING GREENHOUSE GAS EMISSIONS BEYOND THE ENERGY SECTOR • New approaches to protect and restore forests, grasslands and wetlands to bolster our carbon sinks – In April, USDA announced suite of ten programs to reduce greenhouse gas emissions, increase carbon sequestration and expand renewable energy production in the agricultural and forestry sectors. – Through these efforts, the U. S. expects to reduce net emissions and enhance carbon sequestration by over 120 million metric tons of CO 2 equivalent (MMTCO 2 e) per year – about 2 percent of economy-wide net greenhouse emissions – by 2025. – These building blocks include increasing soil health, improving nitrogen stewardship, reducing livestock emissions, promoting rural renewable generation and efficiency, and encouraging forest growth and retention. – USDA will promote broader deployment of no-till agriculture, optimized nitrogen application, anaerobic digesters, and lagoon covers to reduce carbon dioxide, nitrous oxide, and methane emissions. 9
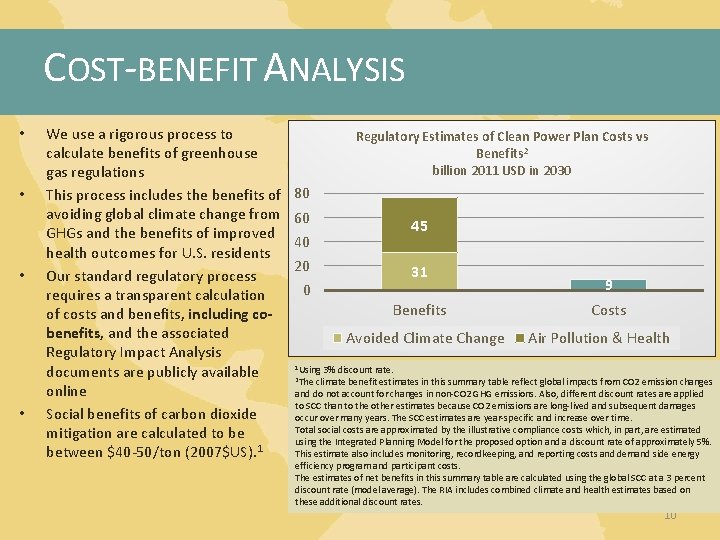
COST-BENEFIT ANALYSIS • • We use a rigorous process to calculate benefits of greenhouse gas regulations This process includes the benefits of avoiding global climate change from GHGs and the benefits of improved health outcomes for U. S. residents Our standard regulatory process requires a transparent calculation of costs and benefits, including cobenefits, and the associated Regulatory Impact Analysis documents are publicly available online Social benefits of carbon dioxide mitigation are calculated to be between $40 -50/ton (2007$US). 1 Regulatory Estimates of Clean Power Plan Costs vs Benefits 2 billion 2011 USD in 2030 80 60 40 20 0 45 31 Benefits Avoided Climate Change 9 Costs Air Pollution & Health 1 Using 3% discount rate. climate benefit estimates in this summary table reflect global impacts from CO 2 emission changes and do not account for changes in non-CO 2 GHG emissions. Also, different discount rates are applied to SCC than to the other estimates because CO 2 emissions are long-lived and subsequent damages occur over many years. The SCC estimates are year-specific and increase over time. Total social costs are approximated by the illustrative compliance costs which, in part, are estimated using the Integrated Planning Model for the proposed option and a discount rate of approximately 5%. This estimate also includes monitoring, recordkeeping, and reporting costs and demand side energy efficiency program and participant costs. The estimates of net benefits in this summary table are calculated using the global SCC at a 3 percent discount rate (model average). The RIA includes combined climate and health estimates based on these additional discount rates. 2 The 10
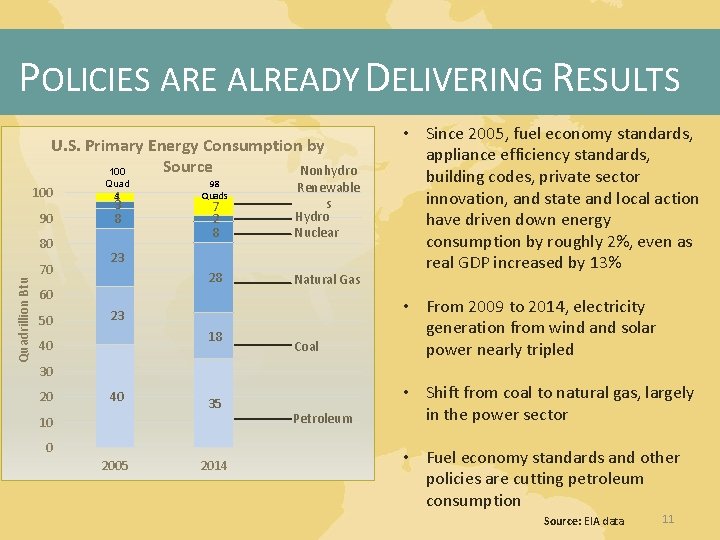
POLICIES ARE ALREADY DELIVERING RESULTS U. S. Primary Energy Consumption by Source Nonhydro 100 90 Quadrillion Btu 80 70 Quad 4 s 3 8 7 2 8 Renewable s Hydro Nuclear 28 Natural Gas 23 60 50 98 Quads Coal • From 2009 to 2014, electricity generation from wind and solar power nearly tripled Petroleum • Shift from coal to natural gas, largely in the power sector 23 18 40 • Since 2005, fuel economy standards, appliance efficiency standards, building codes, private sector innovation, and state and local action have driven down energy consumption by roughly 2%, even as real GDP increased by 13% 30 20 40 35 10 0 2005 2014 • Fuel economy standards and other policies are cutting petroleum consumption Source: EIA data 11