Transmission Access Charges TAC Katie Ramsey Staff Attorney



- Slides: 20
Transmission Access Charges (TAC) Katie Ramsey Staff Attorney Clean Coalition 202 -709 -8063 mobile katie@clean-coalition. org Making Clean Local Energy Accessible Now November 2016
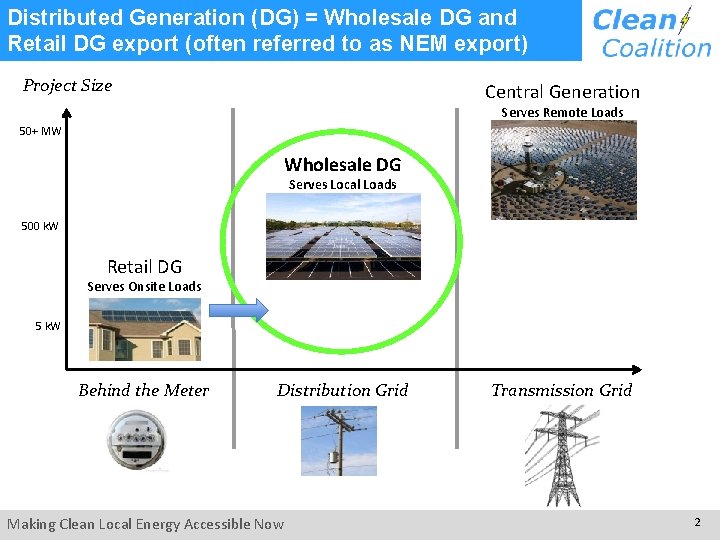
Distributed Generation (DG) = Wholesale DG and Retail DG export (often referred to as NEM export) Project Size Central Generation Serves Remote Loads 50+ MW Wholesale DG Serves Local Loads 500 k. W Retail DG Serves Onsite Loads 5 k. W Behind the Meter Distribution Grid Making Clean Local Energy Accessible Now Transmission Grid 2
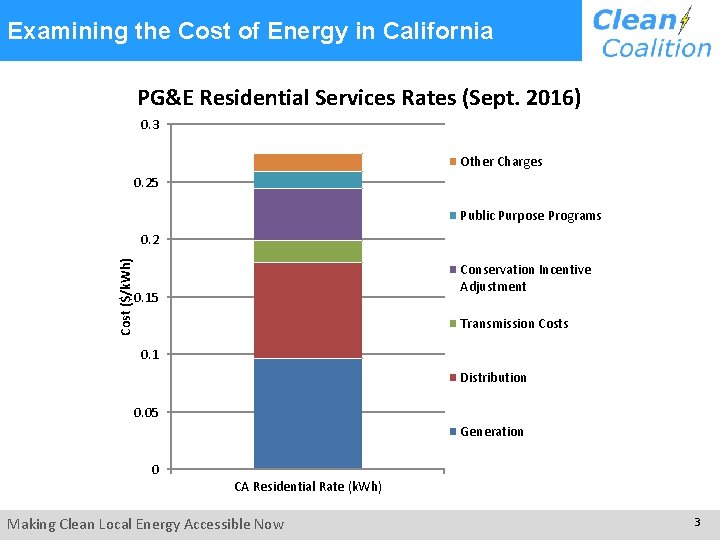
Examining the Cost of Energy in California PG&E Residential Services Rates (Sept. 2016) 0. 3 Other Charges 0. 25 Public Purpose Programs Cost ($/k. Wh) 0. 2 Conservation Incentive Adjustment 0. 15 Transmission Costs 0. 1 Distribution 0. 05 Generation 0 CA Residential Rate (k. Wh) Making Clean Local Energy Accessible Now 3
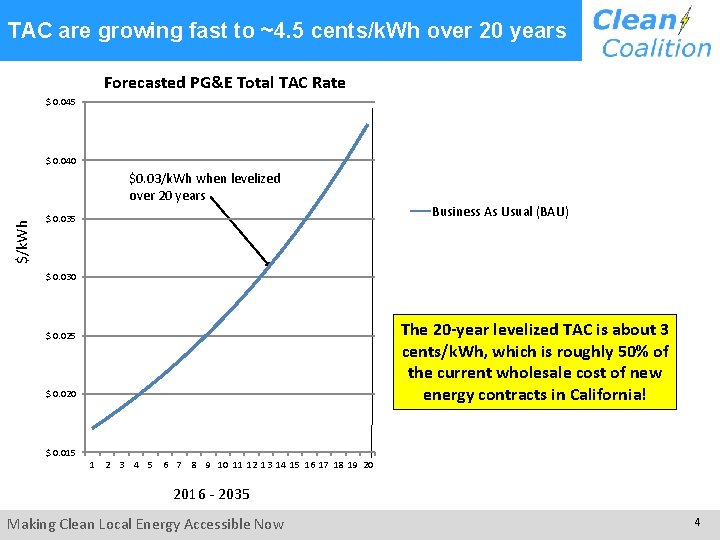
TAC are growing fast to ~4. 5 cents/k. Wh over 20 years Forecasted PG&E Total TAC Rate $ 0. 045 $ 0. 040 $/k. Wh $0. 03/k. Wh when levelized over 20 years $ 0. 035 Business As Usual (BAU) $ 0. 030 The 20 -year levelized TAC is about 3 cents/k. Wh, which is roughly 50% of the current wholesale cost of new energy contracts in California! $ 0. 025 $ 0. 020 $ 0. 015 1 2 3 4 5 6 7 8 9 10 11 12 13 14 15 16 17 18 19 20 2016 - 2035 Making Clean Local Energy Accessible Now 4
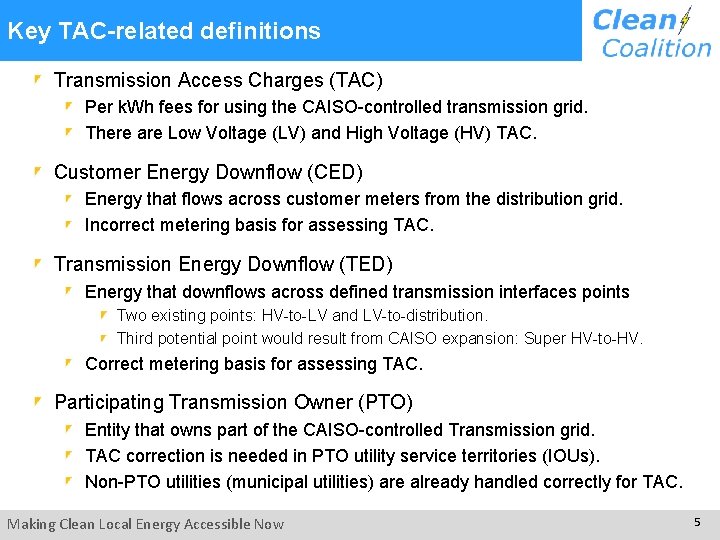
Key TAC-related definitions Transmission Access Charges (TAC) Per k. Wh fees for using the CAISO-controlled transmission grid. There are Low Voltage (LV) and High Voltage (HV) TAC. Customer Energy Downflow (CED) Energy that flows across customer meters from the distribution grid. Incorrect metering basis for assessing TAC. Transmission Energy Downflow (TED) Energy that downflows across defined transmission interfaces points Two existing points: HV-to-LV and LV-to-distribution. Third potential point would result from CAISO expansion: Super HV-to-HV. Correct metering basis for assessing TAC. Participating Transmission Owner (PTO) Entity that owns part of the CAISO-controlled Transmission grid. TAC correction is needed in PTO utility service territories (IOUs). Non-PTO utilities (municipal utilities) are already handled correctly for TAC. Making Clean Local Energy Accessible Now 5
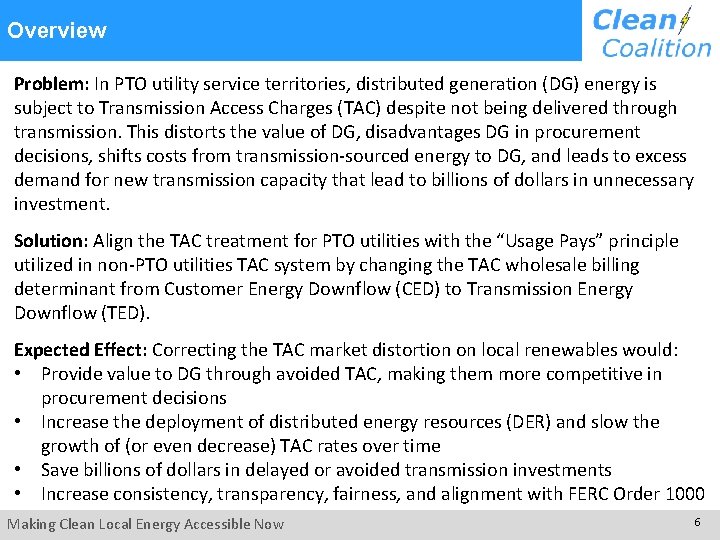
Overview Problem: In PTO utility service territories, distributed generation (DG) energy is subject to Transmission Access Charges (TAC) despite not being delivered through transmission. This distorts the value of DG, disadvantages DG in procurement decisions, shifts costs from transmission-sourced energy to DG, and leads to excess demand for new transmission capacity that lead to billions of dollars in unnecessary investment. Solution: Align the TAC treatment for PTO utilities with the “Usage Pays” principle utilized in non-PTO utilities TAC system by changing the TAC wholesale billing determinant from Customer Energy Downflow (CED) to Transmission Energy Downflow (TED). Expected Effect: Correcting the TAC market distortion on local renewables would: • Provide value to DG through avoided TAC, making them more competitive in procurement decisions • Increase the deployment of distributed energy resources (DER) and slow the growth of (or even decrease) TAC rates over time • Save billions of dollars in delayed or avoided transmission investments • Increase consistency, transparency, fairness, and alignment with FERC Order 1000 Making Clean Local Energy Accessible Now 6
TAC metering fix is needed Current interface for metering TAC in PTO utility service territories (at customer meters based on Customer Energy Downflow) Making Clean Local Energy Accessible Now 7
TAC metering fix is needed Proper interface for metering all High Voltage TAC (based on TED, as is already done in non-PTO utility service territories) Proper interface for metering all Low Voltage TAC (based on TED as is already done in non-PTO utility service territories) Current interface for metering TAC in PTO utility service territories (at customer meters based on Customer Energy Downflow) Making Clean Local Energy Accessible Now 8
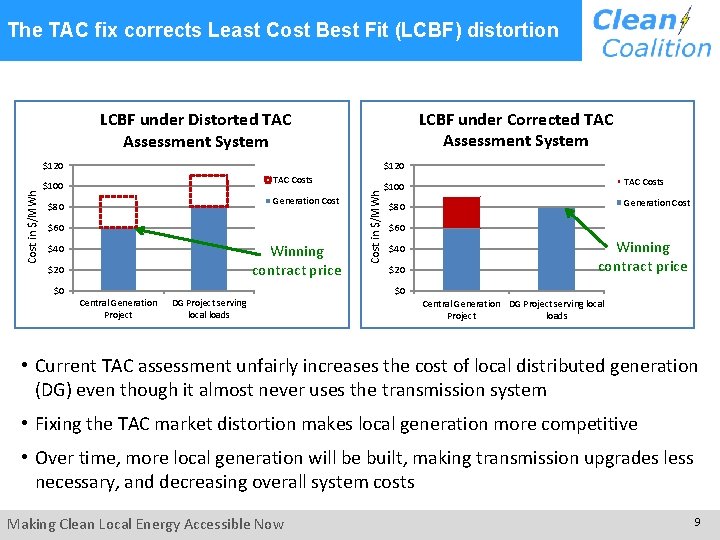
The TAC fix corrects Least Cost Best Fit (LCBF) distortion LCBF under Corrected TAC Assessment System LCBF under Distorted TAC Assessment System $120 TAC Costs $100 Generation Cost $80 $60 Winning contract price $40 $20 $0 Central Generation Project DG Project serving local loads Cost in $/MWh $120 TAC Costs $100 Generation Cost $80 $60 $40 $20 Winning contract price $0 Central Generation DG Project serving local Project loads • Current TAC assessment unfairly increases the cost of local distributed generation (DG) even though it almost never uses the transmission system • Fixing the TAC market distortion makes local generation more competitive • Over time, more local generation will be built, making transmission upgrades less necessary, and decreasing overall system costs Making Clean Local Energy Accessible Now 9
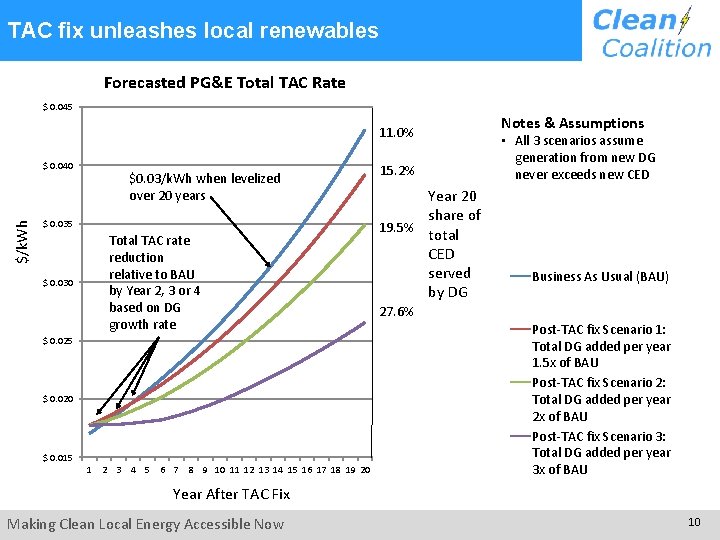
TAC fix unleashes local renewables Forecasted PG&E Total TAC Rate $ 0. 045 11. 0% $/k. Wh $ 0. 040 $0. 03/k. Wh when levelized over 20 years $ 0. 035 $ 0. 030 Total TAC rate reduction relative to BAU by Year 2, 3 or 4 based on DG growth rate $ 0. 025 $ 0. 020 $ 0. 015 1 2 3 4 5 6 7 8 9 10 11 12 13 14 15 16 17 18 19 20 15. 2% Year 20 share of 19. 5% total CED served by DG Notes & Assumptions • All 3 scenarios assume generation from new DG never exceeds new CED Business As Usual (BAU) 27. 6% Post-TAC fix Scenario 1: Total DG added per year 1. 5 x of BAU Post-TAC fix Scenario 2: Total DG added per year 2 x of BAU Post-TAC fix Scenario 3: Total DG added per year 3 x of BAU Year After TAC Fix Making Clean Local Energy Accessible Now 10
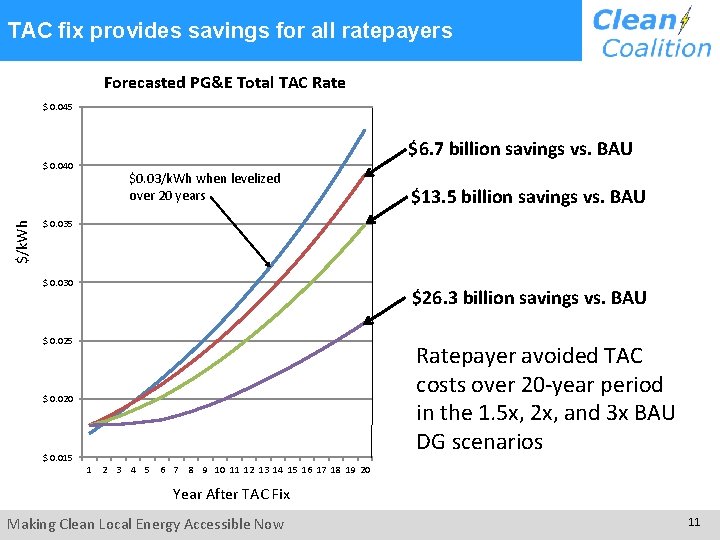
TAC fix provides savings for all ratepayers Forecasted PG&E Total TAC Rate $ 0. 045 $/k. Wh $ 0. 040 $6. 7 billion savings vs. BAU $0. 03/k. Wh when levelized over 20 years $13. 5 billion savings vs. BAU $ 0. 035 $ 0. 030 $26. 3 billion savings vs. BAU $ 0. 025 Ratepayer avoided TAC costs over 20 -year period in the 1. 5 x, 2 x, and 3 x BAU DG scenarios $ 0. 020 $ 0. 015 1 2 3 4 5 6 7 8 9 10 11 12 13 14 15 16 17 18 19 20 Year After TAC Fix Making Clean Local Energy Accessible Now 11
Cost effect example: immediate 2016 Scenario IOU CCA LSE Customer Energy Downflow (CED, in GWh) ESP Total Notes 70 30 10 110 64% 27% 9% 100% NA NA NA $1, 650 $0. 0150 $1, 050 $450 $1, 650 DG (GWh) 1. 4 0. 6 0 2 Share of total LSE CED served by DG 2% 2% 0% 2% TED (GWh) 68. 6 29. 4 10 108 % of TED 64% 27% 9% 100% NA NA NA $1, 650 $0. 0153 $1, 048 (-$2) $449 (-$1) $153 (+$3) $1, 650 % of Total CED TRR (in thousands) TAC Rate per k. Wh (now) TAC payment (in thousands) TRR (in thousands) TED-based TAC Rate (per k. Wh) TED-based TAC payments (in thousands) Making Clean Local Energy Accessible Now Current TAC wholesale billing determinant Share of total TAC basis (now) Total Transmission Revenue Required TRR/CED TAC Rate x CED 2% is the highest percentage of DG in any PTO utility service territory today Proposed TAC basis Share of total TAC basis (proposed) Remains unchanged TRR/TED New TAC Rate x TED 12
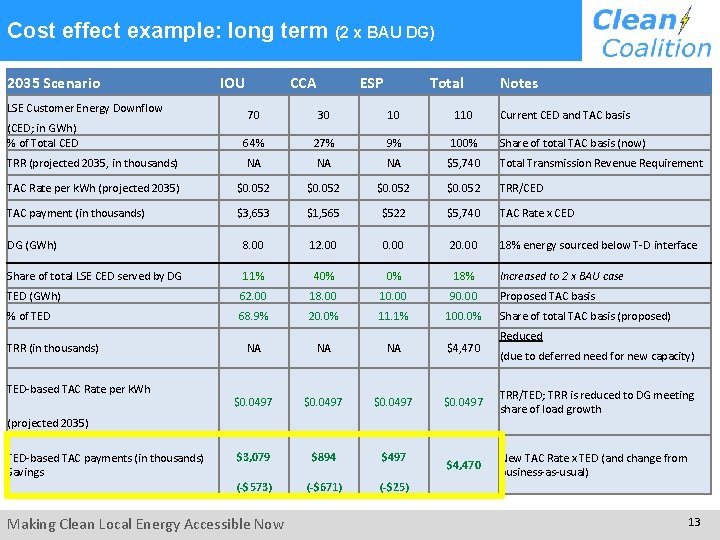
Cost effect example: long term (2 x BAU DG) 2035 Scenario LSE Customer Energy Downflow IOU CCA ESP Total Notes (CED; in GWh) % of Total CED 70 30 10 110 64% 27% 9% 100% Share of total TAC basis (now) TRR (projected 2035, in thousands) NA NA NA $5, 740 Total Transmission Revenue Requirement TAC Rate per k. Wh (projected 2035) $0. 052 TRR/CED TAC payment (in thousands) $3, 653 $1, 565 $522 $5, 740 TAC Rate x CED DG (GWh) 8. 00 12. 00 0. 00 20. 00 18% energy sourced below T-D interface Share of total LSE CED served by DG 11% 40% 0% 18% Increased to 2 x BAU case TED (GWh) 62. 00 18. 00 10. 00 90. 00 Proposed TAC basis % of TED 68. 9% 20. 0% 11. 1% 100. 0% TRR (in thousands) TED-based TAC Rate per k. Wh Share of total TAC basis (proposed) Reduced NA NA NA $4, 470 $0. 0497 TRR/TED; TRR is reduced to DG meeting share of load growth $3, 079 $894 $497 $4, 470 New TAC Rate x TED (and change from business-as-usual) (-$573) (-$671) (-$25) (projected 2035) TED-based TAC payments (in thousands) Savings Current CED and TAC basis Making Clean Local Energy Accessible Now (due to deferred need for new capacity) 13
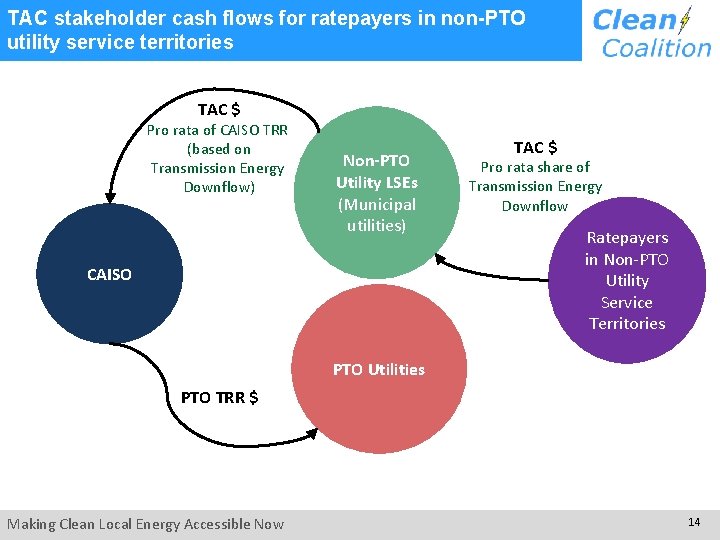
TAC stakeholder cash flows for ratepayers in non-PTO utility service territories TAC $ Pro rata of CAISO TRR (based on Transmission Energy Downflow) Non-PTO Utility LSEs (Municipal utilities) CAISO TAC $ Pro rata share of Transmission Energy Downflow Ratepayers in Non-PTO Utility Service Territories PTO Utilities PTO TRR $ Making Clean Local Energy Accessible Now 14
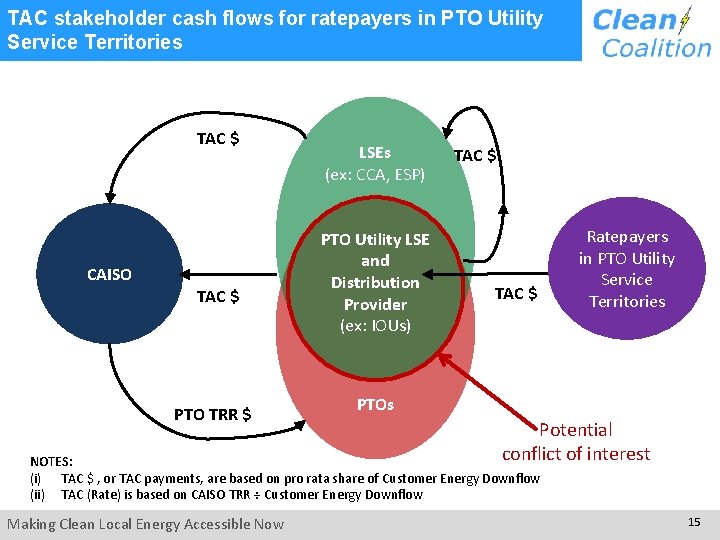
TAC stakeholder cash flows for ratepayers in PTO Utility Service Territories TAC $ CAISO TAC $ PTO TRR $ LSEs (ex: CCA, ESP) PTO Utility LSE and Distribution Provider (ex: IOUs) TAC $ Ratepayers in PTO Utility Service Territories PTOs Potential conflict of interest NOTES: (i) TAC $ , or TAC payments, are based on pro rata share of Customer Energy Downflow (ii) TAC (Rate) is based on CAISO TRR ÷ Customer Energy Downflow Making Clean Local Energy Accessible Now 15
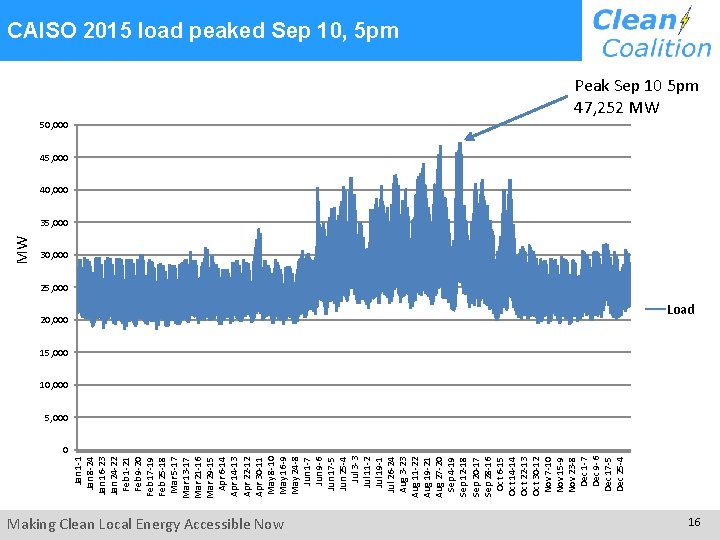
Jan 1 -1 Jan 8 -24 Jan 16 -23 Jan 24 -22 Feb 1 -21 Feb 9 -20 Feb 17 -19 Feb 25 -18 Mar 5 -17 Mar 13 -17 Mar 21 -16 Mar 29 -15 Apr 6 -14 Apr 14 -13 Apr 22 -12 Apr 30 -11 May 8 -10 May 16 -9 May 24 -8 Jun 1 -7 Jun 9 -6 Jun 17 -5 Jun 25 -4 Jul 3 -3 Jul 11 -2 Jul 19 -1 Jul 26 -24 Aug 3 -23 Aug 11 -22 Aug 19 -21 Aug 27 -20 Sep 4 -19 Sep 12 -18 Sep 20 -17 Sep 28 -16 Oct 6 -15 Oct 14 -14 Oct 22 -13 Oct 30 -12 Nov 7 -10 Nov 15 -9 Nov 23 -8 Dec 1 -7 Dec 9 -6 Dec 17 -5 Dec 25 -4 MW CAISO 2015 load peaked Sep 10, 5 pm Peak Sep 10 5 pm 47, 252 MW 50, 000 45, 000 40, 000 35, 000 30, 000 25, 000 20, 000 Load 15, 000 10, 000 5, 000 0 Making Clean Local Energy Accessible Now 16
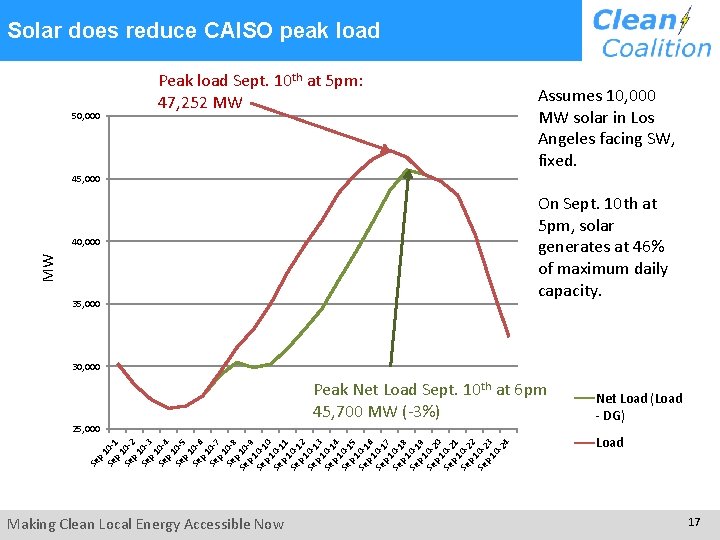
Solar does reduce CAISO peak load 50, 000 Peak load Sept. 10 th at 5 pm: 47, 252 MW Assumes 10, 000 MW solar in Los Angeles facing SW, fixed. 45, 000 On Sept. 10 th at 5 pm, solar generates at 46% of maximum daily capacity. MW 40, 000 35, 000 30, 000 Peak Net Load Sept. 10 th at 6 pm 45, 700 MW (-3%) Load Se p Se 10 -1 p Se 10 -2 p Se 10 -3 p Se 10 -4 p Se 10 -5 p Se 10 -6 p Se 10 -7 p Se 10 -8 p Se 10 p -9 Se 10 -1 p 0 Se 10 -1 p 1 Se 10 -1 p 2 Se 10 -1 p 3 Se 10 -1 p 4 Se 10 -1 p 5 Se 10 -1 p 6 Se 10 -1 p 7 Se 10 -1 p 8 Se 10 -1 p 9 Se 10 -2 p 0 Se 10 -2 p 1 Se 10 -2 p 2 Se 10 -2 p 3 10 -2 4 25, 000 Net Load (Load - DG) Making Clean Local Energy Accessible Now 17
The TAC Fix is backed by a broad range of organizations Making Clean Local Energy Accessible Now 18
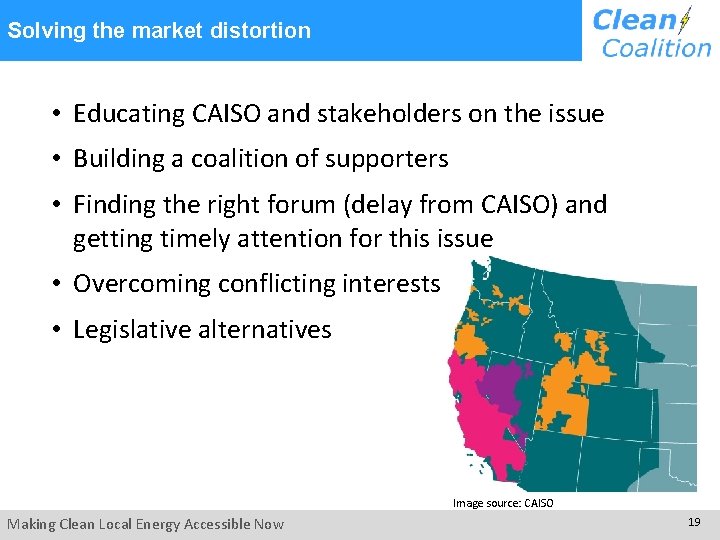
Solving the market distortion • Educating CAISO and stakeholders on the issue • Building a coalition of supporters • Finding the right forum (delay from CAISO) and getting timely attention for this issue • Overcoming conflicting interests • Legislative alternatives Image source: CAISO Making Clean Local Energy Accessible Now 19
Getting involved For more information on the TAC Campaign, visit www. clean-coalition. org/tac or email katie@clean-coalition. org Endorse the TAC Campaign • Contact Daryl Michalik, Executive Director of the Dynamic Grid Council daryl@dynamicgridcouncil. com Add your voice directly by filing your own comments to CAISO and key influencers Making Clean Local Energy Accessible Now 20