TLM example application T Leveling March 15 2013
- Slides: 27
TLM example application T. Leveling March 15, 2013 Attendees: Don Cossairt Kamran Vaziri Adam Olson Dave Peterson John Anderson Paul Czarapata Tony Leveling
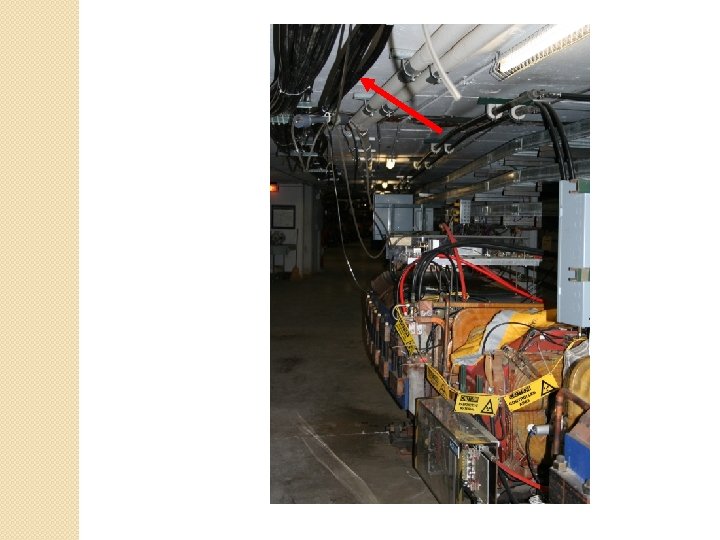
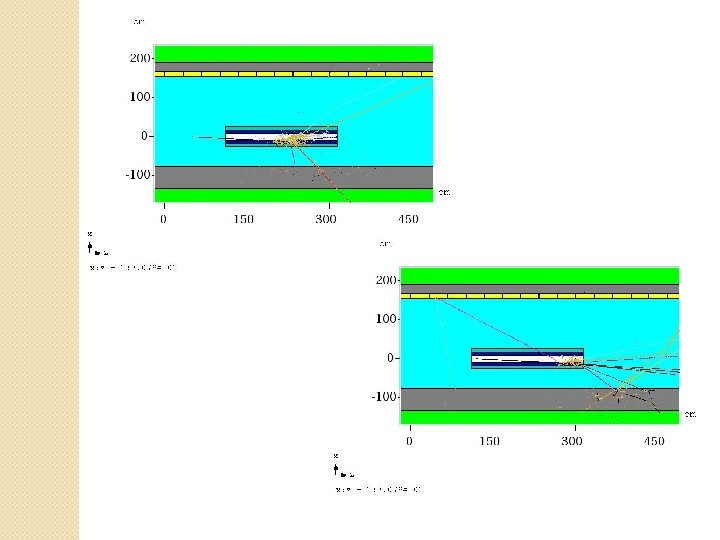
Controlled beam loss location �A 2 B 7, a bending magnet in the Accumulator ring ◦ First bend element following injection into Accumulator ◦ With bend bus de-energized, all beam is lost on this magnet �Studied during 2000 shielding assessment �Measurement verified in 2011/2012 �MARS simulations to compare with measurements
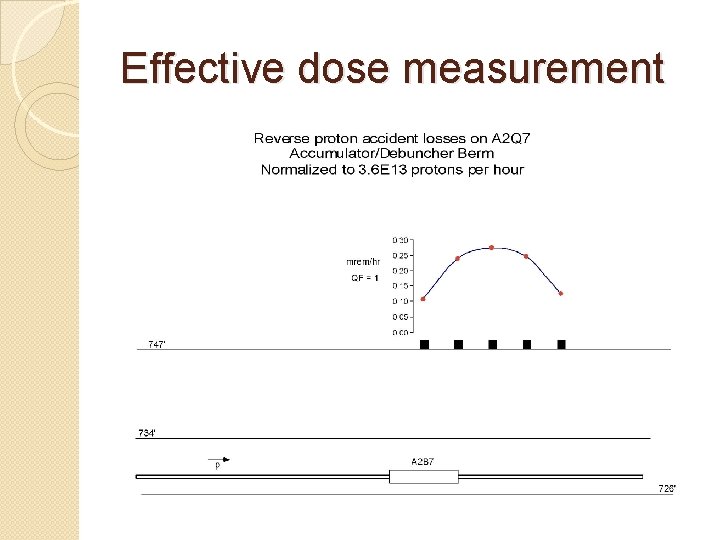
Effective dose measurement
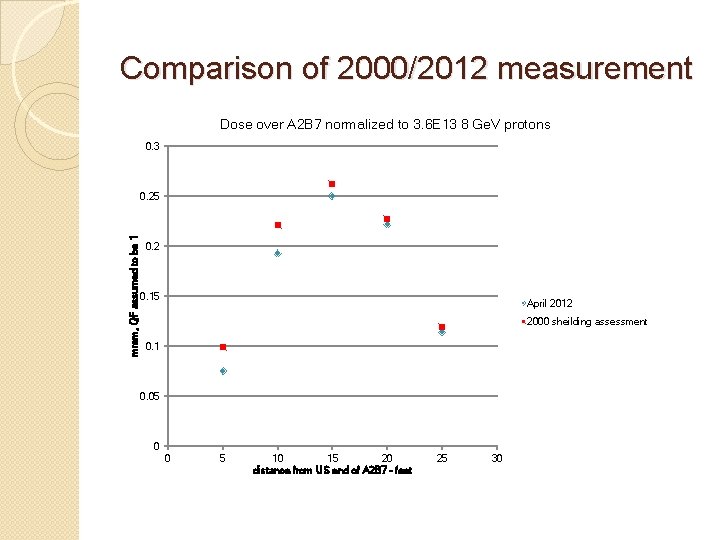
Comparison of 2000/2012 measurement Dose over A 2 B 7 normalized to 3. 6 E 13 8 Ge. V protons 0. 3 mrem, QF assumed to be 1 0. 25 0. 2 0. 15 April 2012 2000 sheilding assessment 0. 1 0. 05 0 0 5 10 15 20 distance from US end of A 2 B 7 - feet 25 30
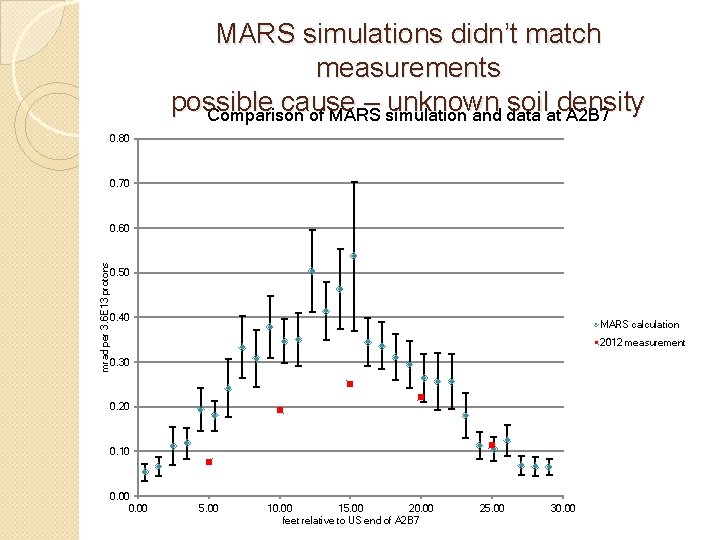
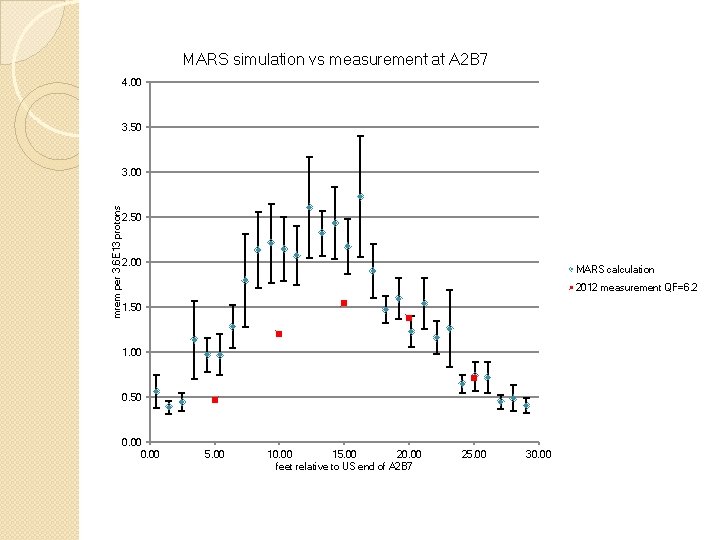
MARS simulations didn’t match measurements possible cause – unknown soil density Comparison of MARS simulation and data at A 2 B 7 0. 80 0. 70 mrad per 3. 6 E 13 protons 0. 60 0. 50 0. 40 MARS calculation 2012 measurement 0. 30 0. 20 0. 10 0. 00 5. 00 10. 00 15. 00 20. 00 feet relative to US end of A 2 B 7 25. 00 30. 00
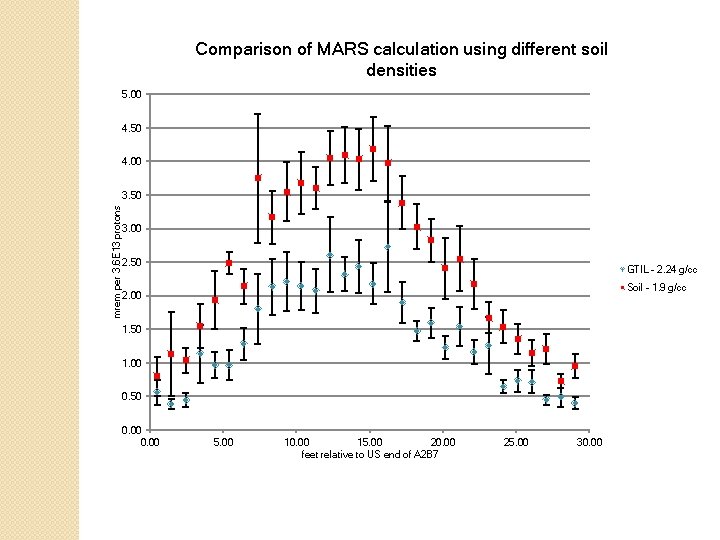
Comparison of MARS calculation using different soil densities 5. 00 4. 50 4. 00 mrem per 3. 6 E 13 protons 3. 50 3. 00 2. 50 GTIL - 2. 24 g/cc Soil - 1. 9 g/cc 2. 00 1. 50 1. 00 0. 50 0. 00 5. 00 10. 00 15. 00 20. 00 feet relative to US end of A 2 B 7 25. 00 30. 00
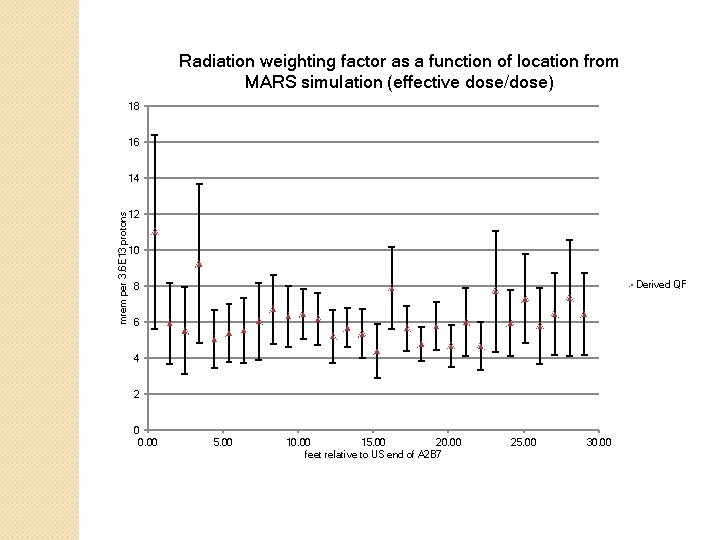
Radiation weighting factor as a function of location from MARS simulation (effective dose/dose) 18 16 mrem per 3. 6 E 13 protons 14 12 10 Derived QF 8 6 4 2 0 0. 00 5. 00 10. 00 15. 00 20. 00 feet relative to US end of A 2 B 7 25. 00 30. 00
MARS simulation vs measurement at A 2 B 7 4. 00 3. 50 mrem per 3. 6 E 13 protons 3. 00 2. 50 2. 00 MARS calculation 2012 measurement QF=6. 2 1. 50 1. 00 0. 50 0. 00 5. 00 10. 00 15. 00 20. 00 feet relative to US end of A 2 B 7 25. 00 30. 00
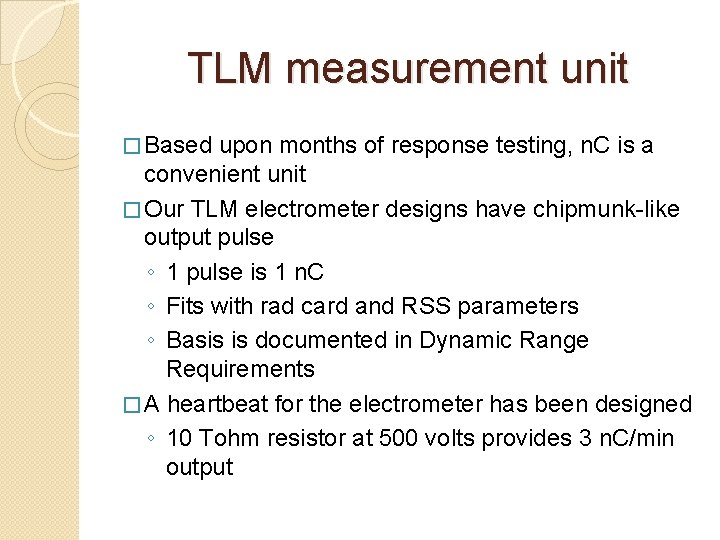
TLM measurement unit � Based upon months of response testing, n. C is a convenient unit � Our TLM electrometer designs have chipmunk-like output pulse ◦ 1 pulse is 1 n. C ◦ Fits with rad card and RSS parameters ◦ Basis is documented in Dynamic Range Requirements � A heartbeat for the electrometer has been designed ◦ 10 Tohm resistor at 500 volts provides 3 n. C/min output
Two electrometer designs �One by AD Instrumentation department ◦ Analog ◦ Background test run begins this week (March 11, 2013) �One by AD RF department ◦ Digital ◦ Background test run began in December 2012
TLM output � Output is a square wave (digital) or TTL pulse (analog) similar to chipmunk � Output is to be directed to RSS via a rad card � Trip levels are application specific, just like chipmunk/scarecrow applications � Trip levels would be established through the shielding assessment process � TTL pulse rate limited to < 70 Hz by design (no pulses go unrecorded) � TLM turns off accelerator absolutely, just like for chipmunk/scarecrow applications � Time-weighted average limits are observed, just like for chipmunk/scarecrow applications
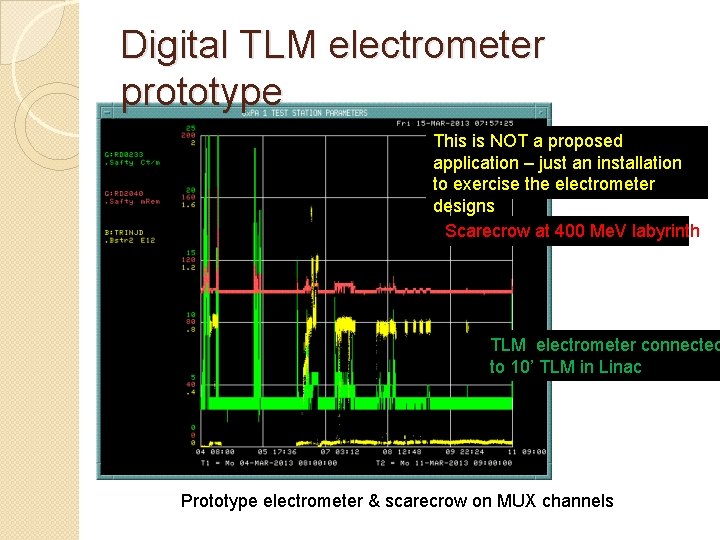
Digital TLM electrometer prototype This is NOT a proposed application – just an installation to exercise the electrometer designs Scarecrow at 400 Me. V labyrinth TLM electrometer connected to 10’ TLM in Linac Prototype electrometer & scarecrow on MUX channels
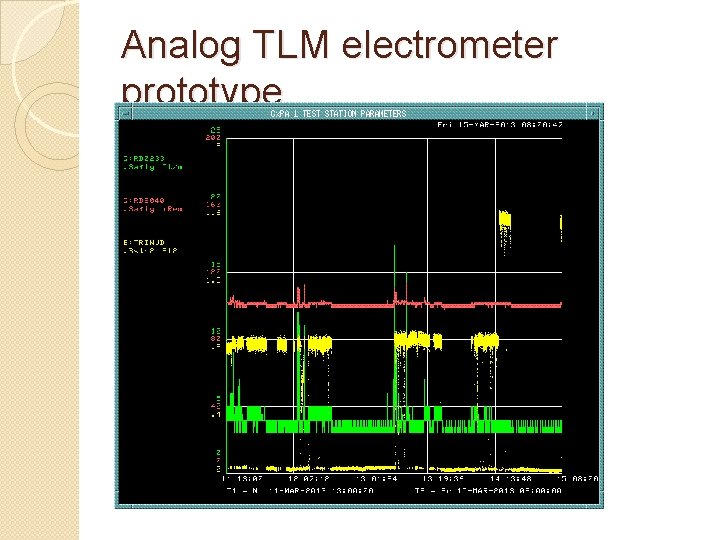
Analog TLM electrometer prototype
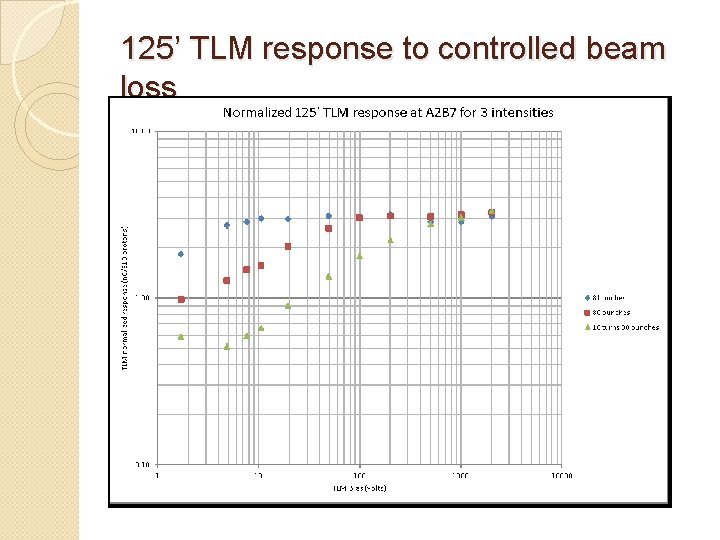
125’ TLM response to controlled beam loss
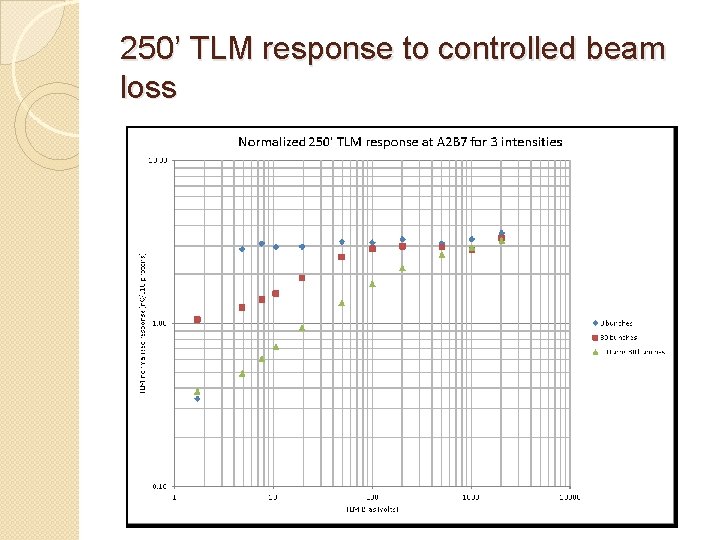
250’ TLM response to controlled beam loss
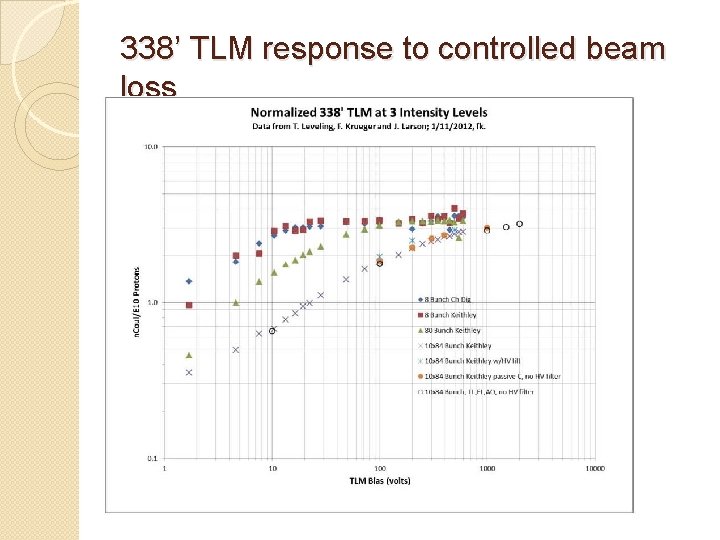
338’ TLM response to controlled beam loss
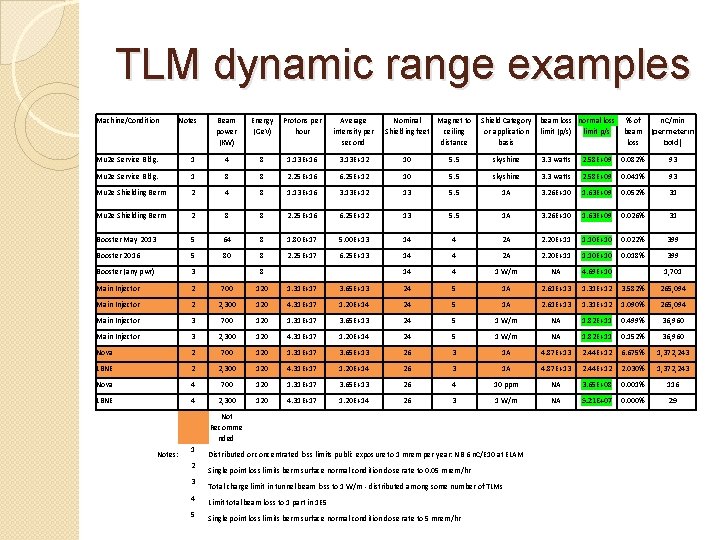
TLM dynamic range examples Machine/Condition Notes Beam power (KW) Energy Protons per (Ge. V) hour Average intensity per second Nominal Shielding feet Magnet to Shield Category beam loss normal loss % of n. C/min ceiling or application limit (p/s) limit p/s beam (per meter in distance basis loss bold) Mu 2 e Service Bldg. 1 4 8 1. 13 E+16 3. 13 E+12 10 5. 5 skyshine 3. 3 watts 2. 58 E+09 0. 082% 93 Mu 2 e Service Bldg. 1 8 8 2. 25 E+16 6. 25 E+12 10 5. 5 skyshine 3. 3 watts 2. 58 E+09 0. 041% 93 Mu 2 e Shielding Berm 2 4 8 1. 13 E+16 3. 13 E+12 13 5. 5 1 A 3. 26 E+10 1. 63 E+09 0. 052% 31 Mu 2 e Shielding Berm 2 8 8 2. 25 E+16 6. 25 E+12 13 5. 5 1 A 3. 26 E+10 1. 63 E+09 0. 026% 31 Booster May 2013 5 64 8 1. 80 E+17 5. 00 E+13 14 4 2 A 2. 20 E+11 1. 10 E+10 0. 022% 399 Booster 2016 5 80 8 2. 25 E+17 6. 25 E+13 14 4 2 A 2. 20 E+11 1. 10 E+10 0. 018% 399 Booster (any pwr) 3 8 14 4 1 W/m NA 4. 69 E+10 1, 701 Main Injector 2 700 120 1. 31 E+17 3. 65 E+13 24 5 1 A 2. 61 E+13 1. 31 E+12 3. 582% 265, 094 Main Injector 2 2, 300 120 4. 31 E+17 1. 20 E+14 24 5 1 A 2. 61 E+13 1. 31 E+12 1. 090% 265, 094 Main Injector 3 700 120 1. 31 E+17 3. 65 E+13 24 5 1 W/m NA 1. 82 E+11 0. 499% 36, 960 Main Injector 3 2, 300 120 4. 31 E+17 1. 20 E+14 24 5 1 W/m NA 1. 82 E+11 0. 152% 36, 960 Nova 2 700 120 1. 31 E+17 3. 65 E+13 26 3 1 A 4. 87 E+13 2. 44 E+12 6. 675% 1, 372, 243 LBNE 2 2, 300 120 4. 31 E+17 1. 20 E+14 26 3 1 A 4. 87 E+13 2. 44 E+12 2. 030% 1, 372, 243 Nova 4 700 120 1. 31 E+17 3. 65 E+13 26 4 10 ppm NA 3. 65 E+08 0. 001% 116 LBNE 4 2, 300 120 4. 31 E+17 1. 20 E+14 26 3 1 W/m NA 5. 21 E+07 0. 000% 29 Not Recomme nded Notes: 1 2 3 4 5 Distributed or concentrated loss limits public exposure to 1 mrem per year: NB 6 n. C/E 10 at ELAM Single point loss limits berm surface normal condition dose rate to 0. 05 mrem/hr Total charge limit in tunnel beam loss to 1 W/m - distributed among some number of TLMs Limit total beam loss to 1 part in 1 E 5 Single point loss limits berm surface normal condition dose rate to 5 mrem/hr
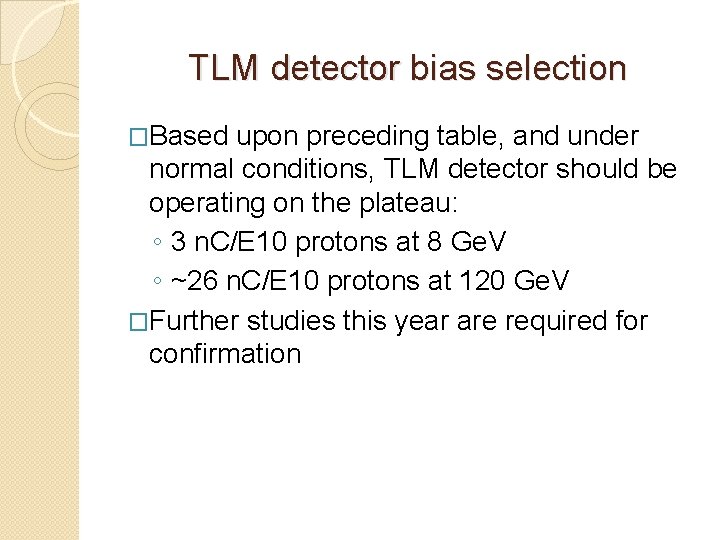
TLM detector bias selection �Based upon preceding table, and under normal conditions, TLM detector should be operating on the plateau: ◦ 3 n. C/E 10 protons at 8 Ge. V ◦ ~26 n. C/E 10 protons at 120 Ge. V �Further studies this year are required for confirmation
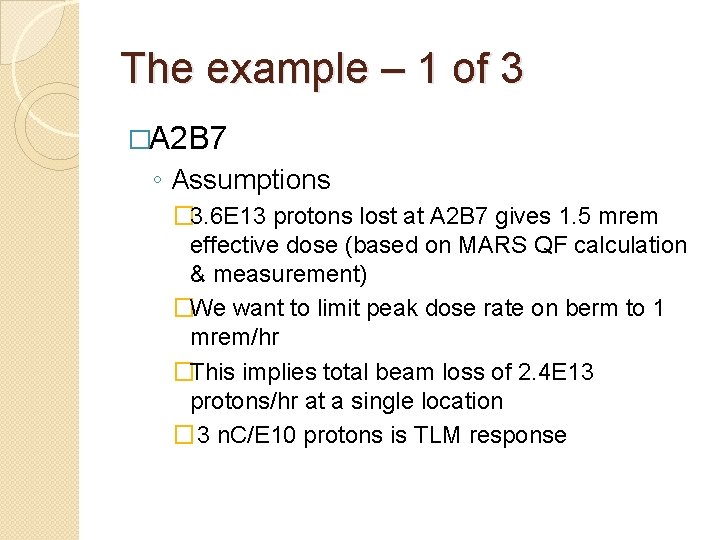
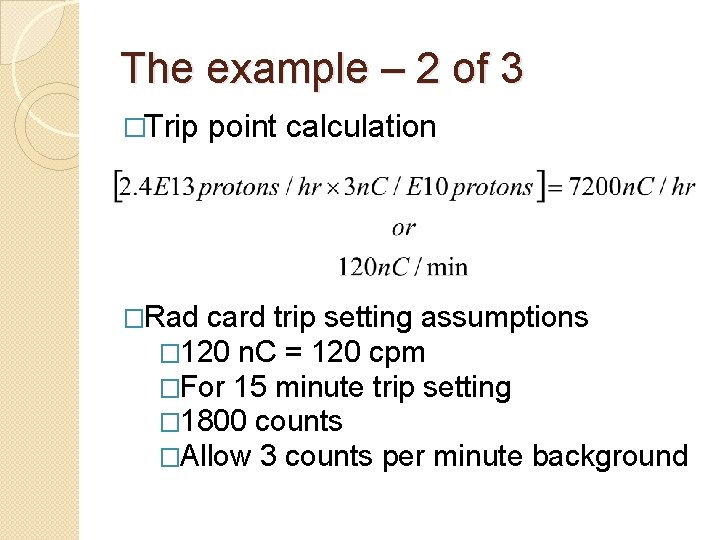
The example – 1 of 3 �A 2 B 7 ◦ Assumptions � 3. 6 E 13 protons lost at A 2 B 7 gives 1. 5 mrem effective dose (based on MARS QF calculation & measurement) �We want to limit peak dose rate on berm to 1 mrem/hr �This implies total beam loss of 2. 4 E 13 protons/hr at a single location � 3 n. C/E 10 protons is TLM response
The example – 2 of 3 �Trip point calculation �Rad card trip setting assumptions � 120 n. C = 120 cpm �For 15 minute trip setting � 1800 counts �Allow 3 counts per minute background
The example – 3 of 3 �If >120 n. C/minute is collected due to a distributed loss, trip occurs anyway �Peak effective dose rate will be < 1 mrem/hr �The machine is held off until the TWA rate of 120 n. C/min is not exceeded ◦ Standard rad card performance.
What happens in case of a gross beam loss? �FET across voltage divider on TLM input senses a beam loss too big to measure continuously �TLM electrometer trips off the RSS by taking away the keep alive voltage �Electrometer continues to send out pulses �No reset until TWA limit is observed
Schedule � Electrometer module development and construction – completed end of April 2013 � Prototype and detector testing - May 2013 through September 2013 � Documentation submitted to AD ES&H - October 2013 � AD ES&H Review and Approval – December 2013 � ES&H Section Approval - February 2014 � Future work – Final design & construction - TBD 24
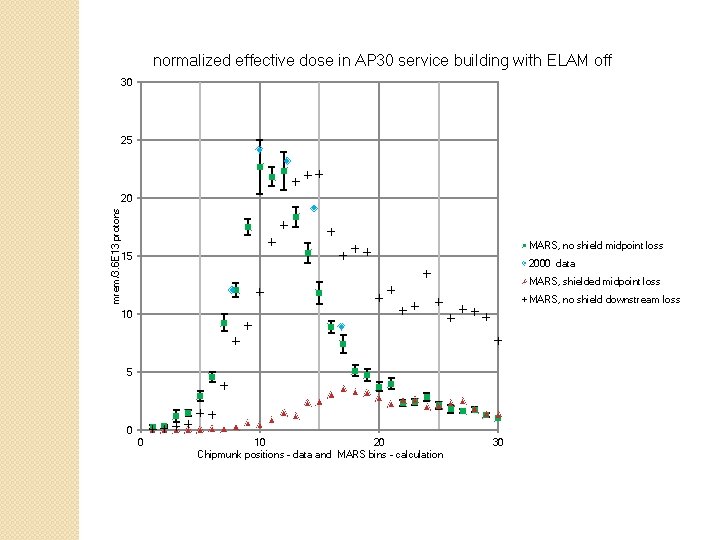
normalized effective dose in AP 30 service building with ELAM off 30 25 mrem/3. 6 E 13 protons 20 MARS, no shield midpoint loss 15 2000 data MARS, shielded midpoint loss MARS, no shield downstream loss 10 5 0 0 10 20 Chipmunk positions - data and MARS bins - calculation 30
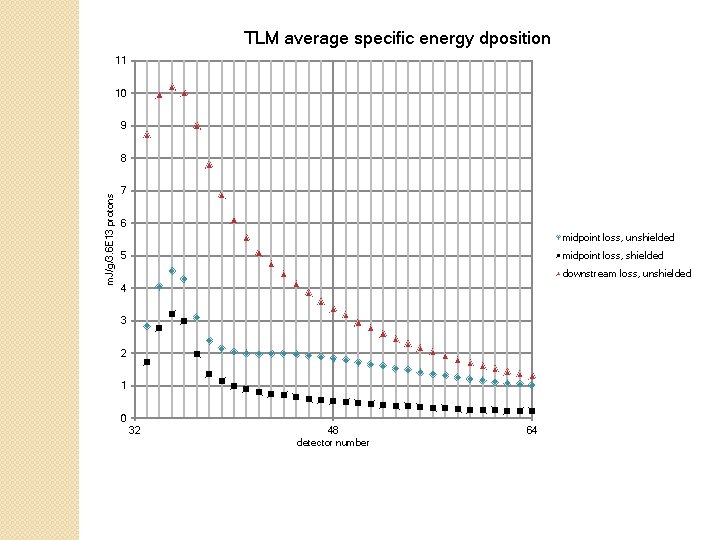
TLM average specific energy dposition 11 10 9 m. J/g/3. 6 E 13 protons 8 7 6 midpoint loss, unshielded midpoint loss, shielded 5 downstream loss, unshielded 4 3 2 1 0 32 48 detector number 64