The Method of LeastSquares Lecture32 MGT 601 4


- Slides: 10
The Method of Least-Squares Lecture#32 MGT 601
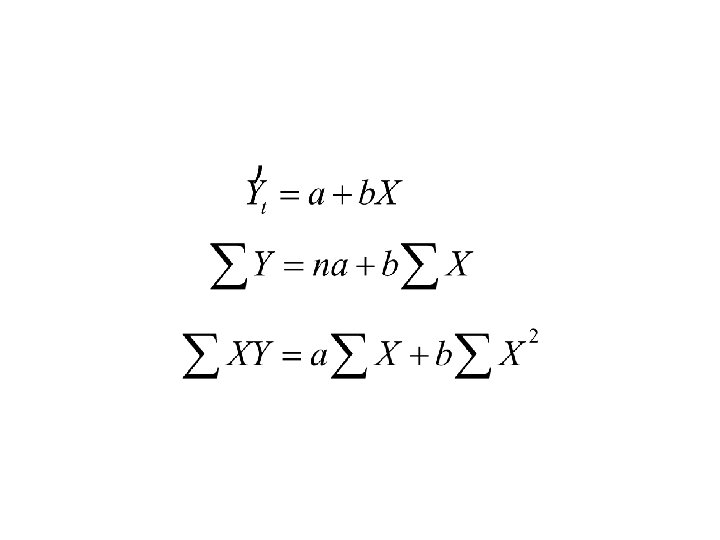
4. The Method of Least-Squares A trend line, described by a mathematical equation of the form of a straight line, a parabola, or an exponential can be measured using the method of least-Squares, by letting time to be independent variable. Let us suppose that the long-term trend appears to be linear. Then the equation of the least-Squares linear trend would be
Method of Least-Squares The values of a and b the two constants are determined by solving the following two normal equations simultaneously;
Method of Least-Squares The trend values are computed from this equation by substituting the values of t and are plotted on the graph of the original values. To simplify computations, the time variable (t) is coded by taking the time deviations from the middle point of the periods and the coded time period is denoted by X. For example, when the number of years is odd, the middle year is taken at 0 or the origin, and when the number of years is even, X=0 is taken at the middle of the two middle two years. The coded form of the linear trend would be
Method of Least-Squares When the long term trend of a time series graph appears to be a curve, we fit a parabolic curve of second degree or a curve of some other type such as exponential, logistic etc. It should be kept in mind that trend which has the smaller is the better fit. This method is useful for prediction purposes.
A problem using a Least-Square method in a Time Series Consider a following data illustrating the number of ships loaded at Karachi Port between 1988 and 1995. In this problem we will find linear equation that will describe the secular trend of loading. Time Series for the number of ships loaded at Karachi Port. Year : 1988 Number: 98 1989 1990 1991 105 116 119 1992 1993 1994 1995 135 156 177 208
Method of Least-Squares