The Italian housing market in the crisis Fresh

- Slides: 22
The Italian housing market in the crisis: Fresh evidence Francesco Zollino OECD STESEG Meeting Paris 10 -11 September 2009
Outline 1. Importance of investing in information on the housing market 2. The statistical outlook in Italy 3. The Bank of Italy-Tecnoborsa new survey: 4. The new Bo. I price indicator 5. More on price developments in Italy
1. The need for a better monitoring the housing market Developments in residential property prices are crucial in economic analysis: 1) changes in house prices affect the business cycle through their impact on (a) households’ wealth and in turn on consumption behaviour (b) residential investments; 2) sharp price fluctuations impact on financial stability (credit quality, value of collateral. . . ) 3) the functioning of the housing market affects labour mobility Empirical analysis shows that housing market might contribute to the persistent propagation of shocks that hit the economy The recent crisis confirms the importance of investing in reliable, complete and (possibly) harmonized statistics on the housing market. Information available in Italy (as well as in the euro area) is lacking. This presentation focuses on a recent initiative undertaken in Italy to enhance a timely monitoring of the housing market: a) new survey on market operators; b) new price indicator
2. The statistical outlook in Italy In Italy information on the housing market is: • released by many (private and public) institutions/research centres; • not systematic, not timely, not available for a few important dimensions a) Price statistics Official (NSI) data on property transaction prices are not available yet. Alternative sources (all pro and cons): Nomisma: no breakdown in the series but limited geographical coverage Il Consulente immobiliare (CI): long time series (1965) and broad territorial reach, but frequent changes in the reference sample (breakdown). Osservatorio del mercato immobiliare (OMI). Broad territorial coverage, but lack of historical depth (since 2002) and data published with a delay of a few months. All in all (Bank of Italy statistics) CI is the source that is best suited to analyzing medium-term developments. It is used in BI (Zollino, Muzzicato and Sabbatini, 2008) to compute an index since mid-1960 s OMI is important for the wealth of information provided and territorial coverage. It is used in BI (Cannari and Faiella, 2007) for estimating households’ wealth.
2. The statistical outlook in Italy /2 (b) Non-price information a) Statistics on building permits are released, but only at an annual frequency and with a delay of 1. 5 years b) Information on transactions is available (OMI), but with 3 -4 months delay. Furthermore, data are semi-annual (quarterly data only on an experimental basis) c) Information regarding how long it takes to sell a dwelling, the percentage of discount on the initial price and so on is not collected systematically. d) (c) Qualitative (high-frequency) surveys ISAE monthly surveys. (1) Question on the households’ intention to buy a dwelling (poor leading properties of the answers); (2) business climate of building firms a) New initiative to fill the gap for the residential market Early 2009 Bank of Italy and Tecnoborsa launched a new quarterly survey to collect (timely) information on the residential housing market.
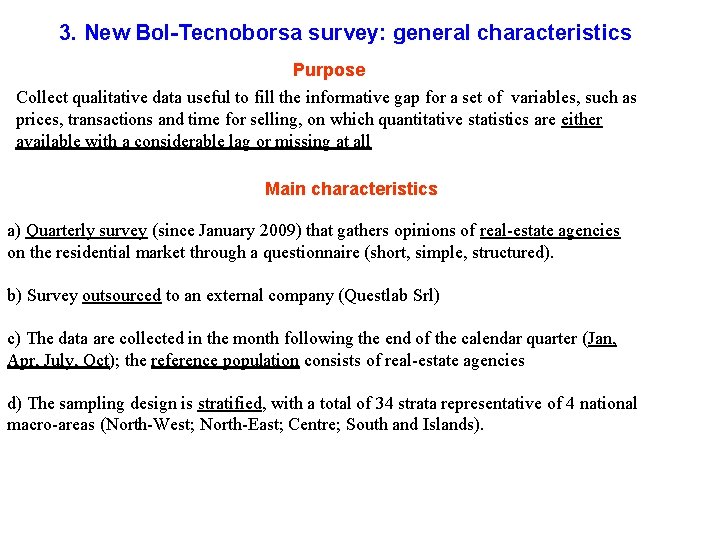
3. New Bo. I-Tecnoborsa survey: general characteristics Purpose Collect qualitative data useful to fill the informative gap for a set of variables, such as prices, transactions and time for selling, on which quantitative statistics are either available with a considerable lag or missing at all Main characteristics a) Quarterly survey (since January 2009) that gathers opinions of real-estate agencies on the residential market through a questionnaire (short, simple, structured). b) Survey outsourced to an external company (Questlab Srl) c) The data are collected in the month following the end of the calendar quarter (Jan, Apr, July, Oct); the reference population consists of real-estate agencies d) The sampling design is stratified, with a total of 34 strata representative of 4 national macro-areas (North-West; North-East; Centre; South and Islands).
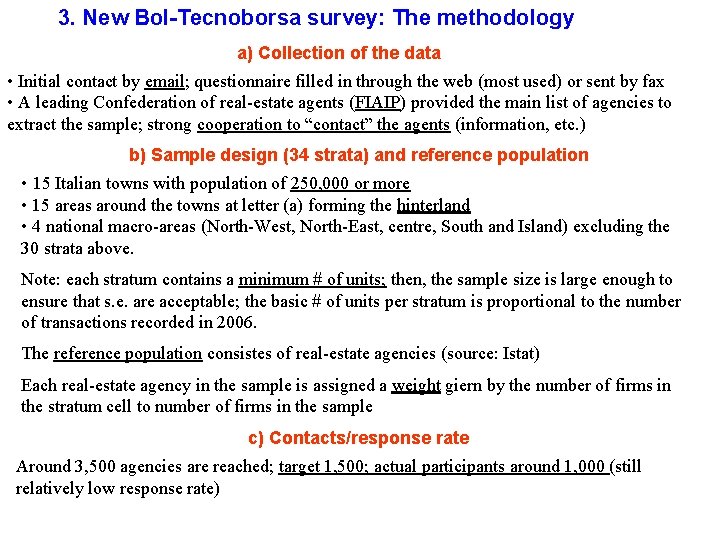
3. New Bo. I-Tecnoborsa survey: The methodology a) Collection of the data • Initial contact by email; questionnaire filled in through the web (most used) or sent by fax • A leading Confederation of real-estate agents (FIAIP) provided the main list of agencies to extract the sample; strong cooperation to “contact” the agents (information, etc. ) b) Sample design (34 strata) and reference population • 15 Italian towns with population of 250, 000 or more • 15 areas around the towns at letter (a) forming the hinterland • 4 national macro-areas (North-West, North-East, centre, South and Island) excluding the 30 strata above. Note: each stratum contains a minimum # of units; then, the sample size is large enough to ensure that s. e. are acceptable; the basic # of units per stratum is proportional to the number of transactions recorded in 2006. The reference population consistes of real-estate agencies (source: Istat) Each real-estate agency in the sample is assigned a weight giern by the number of firms in the stratum cell to number of firms in the sample c) Contacts/response rate Around 3, 500 agencies are reached; target 1, 500; actual participants around 1, 000 (still relatively low response rate)
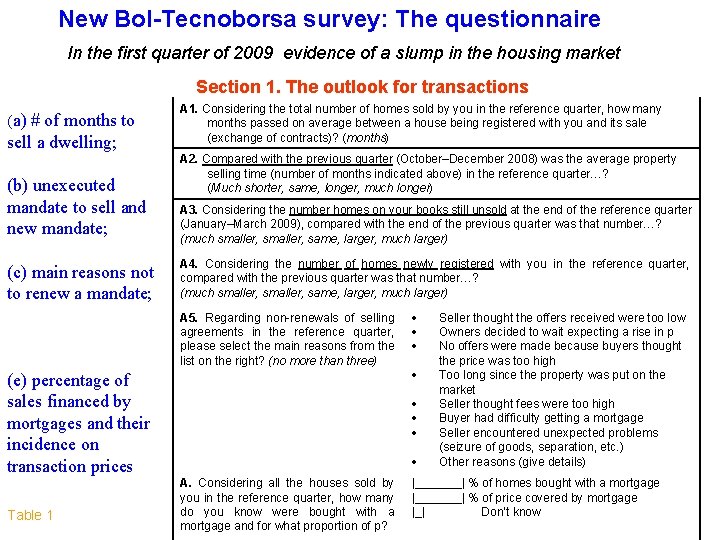
New Bo. I-Tecnoborsa survey: The questionnaire In the first quarter of 2009 evidence of a slump in the housing market Section 1. The outlook for transactions (a) # of months to sell a dwelling; (b) unexecuted mandate to sell and new mandate; (c) main reasons not to renew a mandate; A 1. Considering the total number of homes sold by you in the reference quarter, how many months passed on average between a house being registered with you and its sale (exchange of contracts)? (months) A 2. Compared with the previous quarter (October–December 2008) was the average property selling time (number of months indicated above) in the reference quarter…? (Much shorter, same, longer, much longer) A 3. Considering the number homes on your books still unsold at the end of the reference quarter (January–March 2009), compared with the end of the previous quarter was that number…? (much smaller, same, larger, much larger) A 4. Considering the number of homes newly registered with you in the reference quarter, compared with the previous quarter was that number…? (much smaller, same, larger, much larger) A 5. Regarding non-renewals of selling agreements in the reference quarter, please select the main reasons from the list on the right? (no more than three) (e) percentage of sales financed by mortgages and their incidence on transaction prices Table 1 A. Considering all the houses sold by you in the reference quarter, how many do you know were bought with a mortgage and for what proportion of p? Seller thought the offers received were too low Owners decided to wait expecting a rise in p No offers were made because buyers thought the price was too high Too long since the property was put on the market Seller thought fees were too high Buyer had difficulty getting a mortgage Seller encountered unexpected problems (seizure of goods, separation, etc. ) Other reasons (give details) |_______| % of homes bought with a mortgage |_______| % of price covered by mortgage |_| Don’t know
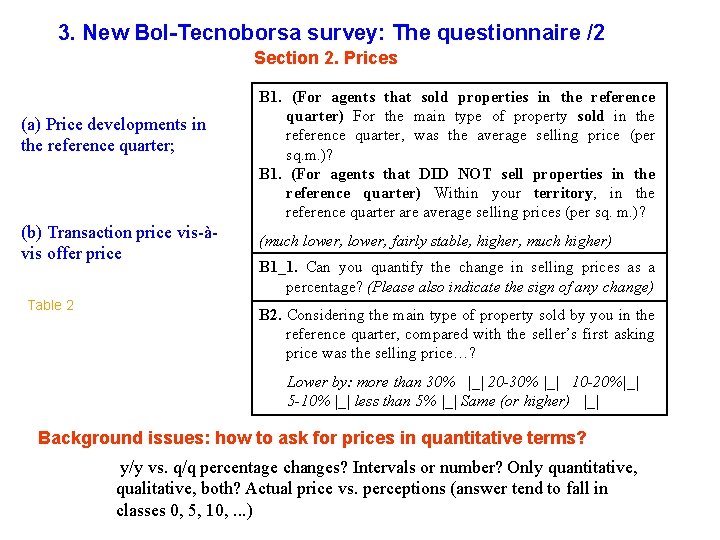
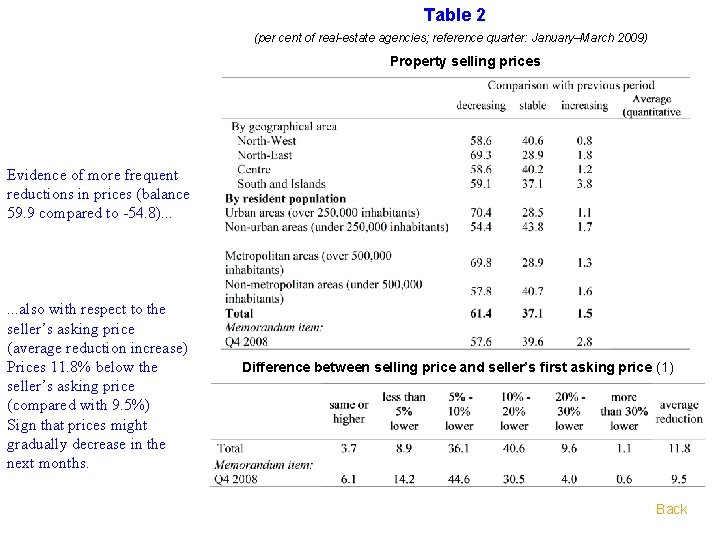
3. New Bo. I-Tecnoborsa survey: The questionnaire /2 Section 2. Prices (a) Price developments in the reference quarter; (b) Transaction price vis-àvis offer price Table 2 B 1. (For agents that sold properties in the reference quarter) For the main type of property sold in the reference quarter, was the average selling price (per sq. m. )? B 1. (For agents that DID NOT sell properties in the reference quarter) Within your territory, in the reference quarter are average selling prices (per sq. m. )? (much lower, fairly stable, higher, much higher) B 1_1. Can you quantify the change in selling prices as a percentage? (Please also indicate the sign of any change) B 2. Considering the main type of property sold by you in the reference quarter, compared with the seller’s first asking price was the selling price…? Lower by: more than 30% |_| 20 -30% |_| 10 -20%|_| 5 -10% |_| less than 5% |_| Same (or higher) |_| Background issues: how to ask for prices in quantitative terms? y/y vs. q/q percentage changes? Intervals or number? Only quantitative, qualitative, both? Actual price vs. perceptions (answer tend to fall in classes 0, 5, 10, . . . )
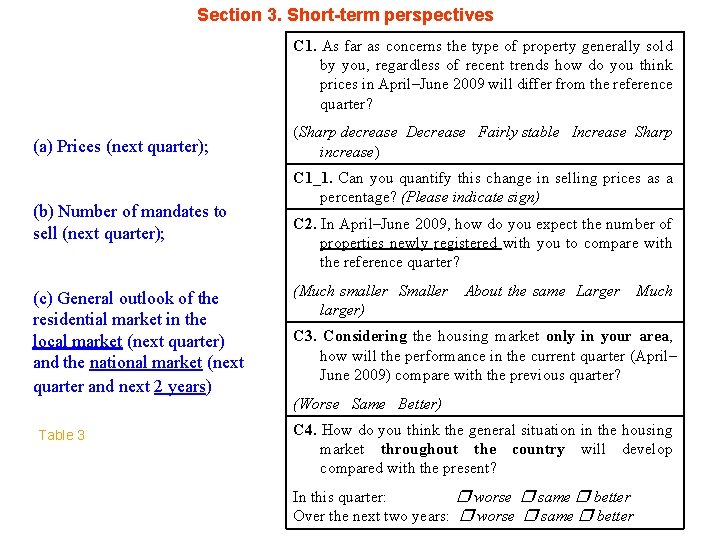
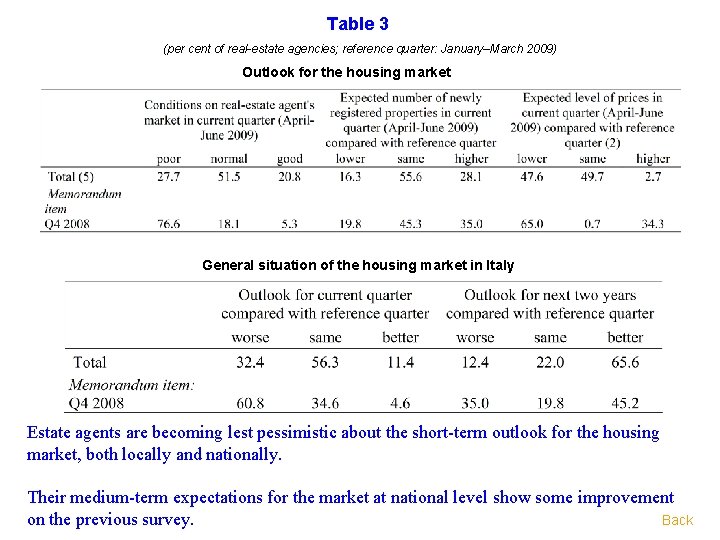
Section 3. Short-term perspectives C 1. As far as concerns the type of property generally sold by you, regardless of recent trends how do you think prices in April–June 2009 will differ from the reference quarter? (a) Prices (next quarter); (b) Number of mandates to sell (next quarter); (c) General outlook of the residential market in the local market (next quarter) and the national market (next quarter and next 2 years) Table 3 (Sharp decrease Decrease Fairly stable Increase Sharp increase) C 1_1. Can you quantify this change in selling prices as a percentage? (Please indicate sign) C 2. In April–June 2009, how do you expect the number of properties newly registered with you to compare with the reference quarter? (Much smaller Smaller About the same Larger Much larger) C 3. Considering the housing market only in your area, how will the performance in the current quarter (April– June 2009) compare with the previous quarter? (Worse Same Better) C 4. How do you think the general situation in the housing market throughout the country will develop compared with the present? In this quarter: worse same better Over the next two years: worse same better
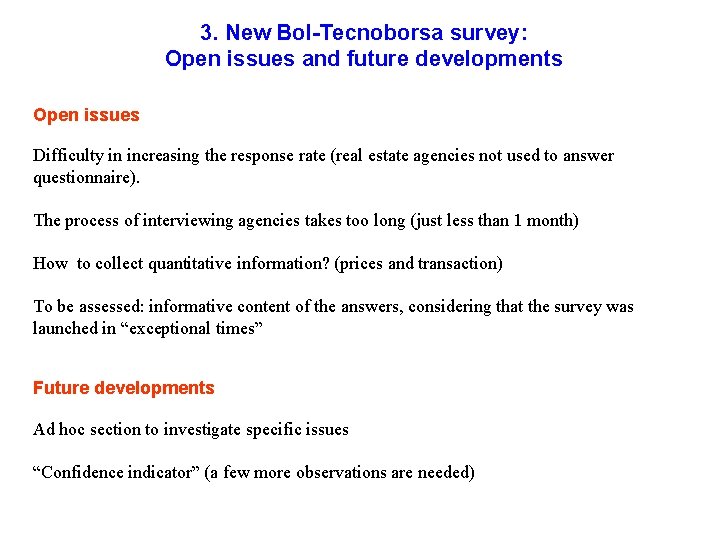
3. New Bo. I-Tecnoborsa survey: Open issues and future developments Open issues Difficulty in increasing the response rate (real estate agencies not used to answer questionnaire). The process of interviewing agencies takes too long (just less than 1 month) How to collect quantitative information? (prices and transaction) To be assessed: informative content of the answers, considering that the survey was launched in “exceptional times” Future developments Ad hoc section to investigate specific issues “Confidence indicator” (a few more observations are needed)
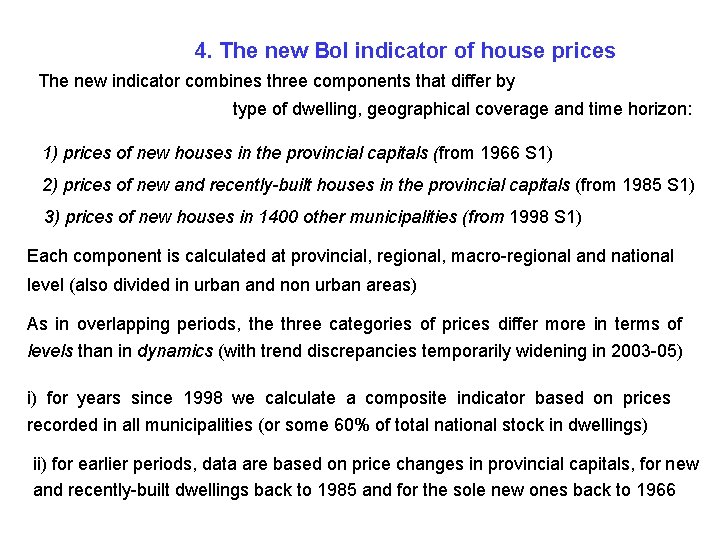
4. The new Bo. I indicator of house prices The new indicator combines three components that differ by type of dwelling, geographical coverage and time horizon: 1) prices of new houses in the provincial capitals (from 1966 S 1) 2) prices of new and recently-built houses in the provincial capitals (from 1985 S 1) 3) prices of new houses in 1400 other municipalities (from 1998 S 1) Each component is calculated at provincial, regional, macro-regional and national level (also divided in urban and non urban areas) As in overlapping periods, the three categories of prices differ more in terms of levels than in dynamics (with trend discrepancies temporarily widening in 2003 -05) i) for years since 1998 we calculate a composite indicator based on prices recorded in all municipalities (or some 60% of total national stock in dwellings) ii) for earlier periods, data are based on price changes in provincial capitals, for new and recently-built dwellings back to 1985 and for the sole new ones back to 1966
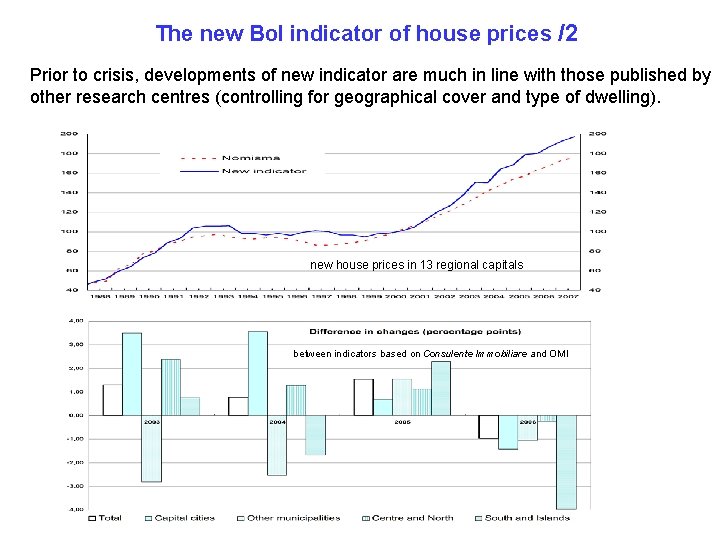
The new Bo. I indicator of house prices /2 Prior to crisis, developments of new indicator are much in line with those published by other research centres (controlling for geographical cover and type of dwelling). new house prices in 13 regional capitals between indicators based on Consulente Immobiliare and OMI
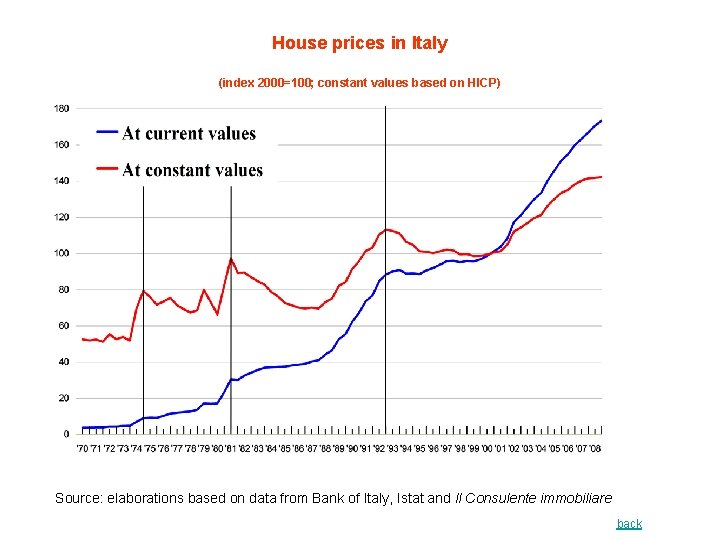
5. More on house prices developments in Italy - Based on Bo. I indicator of house prices, analysis of medium term developments points at four cycles in the Italian housing markets: - The first cycle, presumably already under way when data collection began in 1965, closed with the peak reached at the end of 1974, when prices surged by more than 30 per cent after five years of broad stability (Figure) - The second cycle, from the end of 1974 to mid-1981, was characterized by a phase of volatility that was more accentuated around the second oil shock, interrupted by an abrupt rise in prices, that reached a new peak in 1981(Figure) - The third cycle, lasting up to the second half of 1992, began with a gradual downward correction, with prices down in 1986 to the low of the previous cycle, followed by more than 8 per cent per year increase in real terms until the peak in 1992 (Figure) - In the fourth cycle, likely just closed by the end of 2008, after a seven year fall at a milder pace than in the past, house prices show a brisk upswing (5% per year in real terms) until first signs of a slowdown since the end of 2006 (Figure)
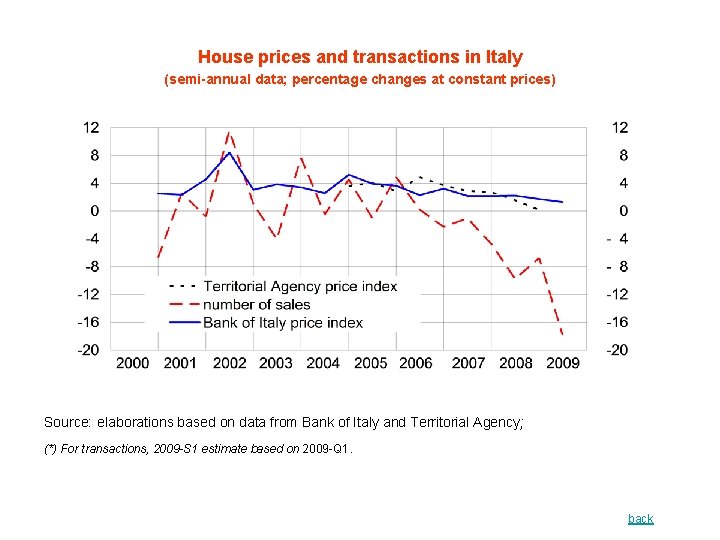
5. More on house prices developments in Italy /2 - Recent developments point to a gradual fading of house inflation in Italy, by a diverging intensity across different sources as transaction volume shrank in latest periods - According to OMI, house prices in real terms stabilized in the first semester of 2008, and show a slight decline in the second (Figure) - According to Bo. I indicator, barely in line with OMI in previous years, house prices were still on the raise in the first semester, with a virtual stagnation in the second, signalling that uncertainty usually surrounding property price increased as the volume recession deepened. In the first semester 2009 prices still keep increasing at a moderate pace. - Latest figures point to number of transactions keeping plummeting in the first quarter of 2009, totalling an overall drop by 36% since the middle of 2006. (Figure)
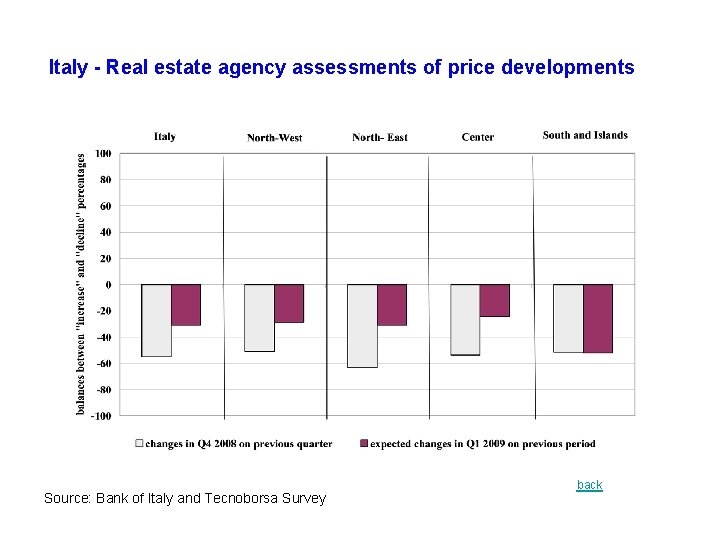
5. More on house prices developments in Italy /3 - Based on historical evidence that volume cycles are more timely reactive than prices to changes in fundamentals on housing market, property prices should soften further in the next future. - However, the contracting volume of sales is likely resulting in a larger margin of error in measuring prices, as it is suggested by the widening gap between different price indicators. - The qualitative assessment of real-estate agents, according to the Bank of Italy. Tecnoborsa survey, is that the fall in prices had probably begun at the end of the last year (Figure) - That points at a possible reconciliation between Bo. I and Territory Agency (OMI) price indicators, as the latter heavily hinges on real estate assessments to validate official records whereas they are poorly reliable on a local basis due to unsatisfactory number of transactions. Bo. I indicator, as based on raw data from il Consulente Immobiliare, reports only on prices affective paid on the market.
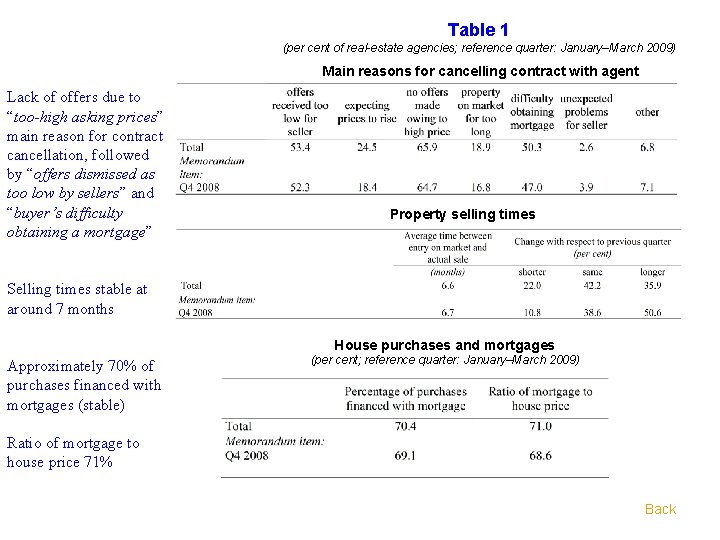
Table 1 (per cent of real-estate agencies; reference quarter: January–March 2009) Main reasons for cancelling contract with agent Lack of offers due to “too-high asking prices” main reason for contract cancellation, followed by “offers dismissed as too low by sellers” and “buyer’s difficulty obtaining a mortgage” Property selling times Selling times stable at around 7 months House purchases and mortgages Approximately 70% of purchases financed with mortgages (stable) (per cent; reference quarter: January–March 2009) Ratio of mortgage to house price 71% Back
Table 2 (per cent of real-estate agencies; reference quarter: January–March 2009) Property selling prices Evidence of more frequent reductions in prices (balance 59. 9 compared to -54. 8). . . also with respect to the seller’s asking price (average reduction increase) Prices 11. 8% below the seller’s asking price (compared with 9. 5%) Sign that prices might gradually decrease in the next months. Difference between selling price and seller’s first asking price (1) Back
Table 3 (per cent of real-estate agencies; reference quarter: January–March 2009) Outlook for the housing market General situation of the housing market in Italy Estate agents are becoming lest pessimistic about the short-term outlook for the housing market, both locally and nationally. Their medium-term expectations for the market at national level show some improvement on the previous survey. Back
House prices in Italy (index 2000=100; constant values based on HICP) Source: elaborations based on data from Bank of Italy, Istat and Il Consulente immobiliare back
House prices and transactions in Italy (semi-annual data; percentage changes at constant prices) Source: elaborations based on data from Bank of Italy and Territorial Agency; (*) For transactions, 2009 -S 1 estimate based on 2009 -Q 1. back
Italy - Real estate agency assessments of price developments Source: Bank of Italy and Tecnoborsa Survey back