The Changing Face of North American LNG Damien



- Slides: 21
The Changing Face of North American LNG Damien J. Gaul Natural Gas Division New York Energy Forum 2008 February 5, 2008 New York, New York Energy Information Administration Official Energy Statistics from the U. S. Government
Summary 1. Review of Current Trends 2. Natural Gas Outlook to 2030 3. Natural Gas Import Outlook
Current U. S. LNG Facilities Consuming West . Consuming East . . . 4 44 4. ). 4. . 4 4 Everett 44 4 4 44 4. 44. . . ). . . 4. Northeast. 4 44. . 4. 4 4 Gateway. ) Cove Point. . 4. 4. . 4 ). . . 4 ! Elba Island ! ) ) Lake Charles : Producing Region Kenai Source: Energy Information Administration Gulf Gateway ) Marine Terminal – Export (1) Marine Terminal – Import (6). Storage (with liquefaction) (57) 4 Storage (without liquefaction) (39) Stranded Utility (5) ! Vehicular Fuel (2) Nitrogen Rejection unit (5) :
Current U. S. LNG Import Terminals Everett, Massachusetts 3. 4 Bcf Storage Capacity Regasification Capacity: Peak: 1. 035 Bcf per day Baseload: 715 MMcf per day Cove Point, Maryland 7. 8 Bcf Storage Capacity Regasification Capacity: Peak: 1. 0 Bcf per day Baseload: 750 MMcf per day Lake Charles, Louisiana 9. 0 Bcf Storage Capacity Regasification Capacity: Peak: 2. 1 Bcf per day Baseload: 1. 8 Bcf per day Massachusetts, Offshore Gulf Gateway Energy Bridge Regasification Capacity: Peak: 600 MMcf per day Baseload: 500 MMcf per day Elba Island, Georgia 7. 3 Bcf Storage Capacity Regasification Capacity: Peak: 1. 2 Bcf per day Baseload: 820 MMcf per day Gulf of Mexico, Offshore Gulf Gateway Energy Bridge Regasification Capacity: Peak: 690 MMcf per day Baseload: 500 MMcf per day Source: Energy Information Administration
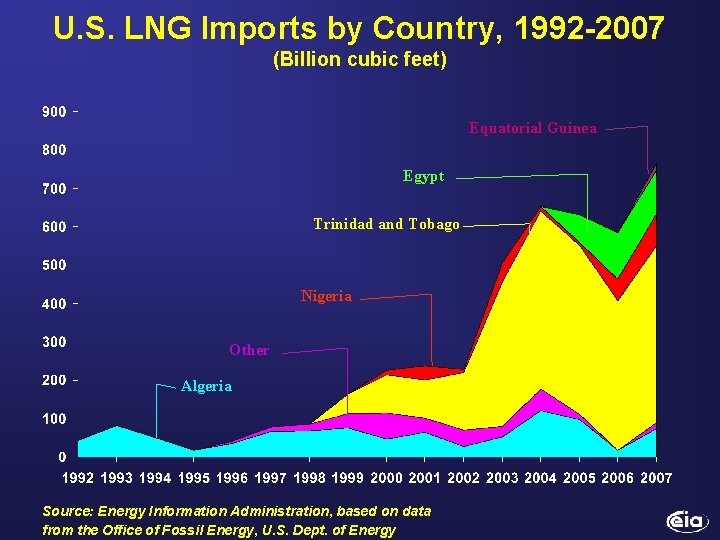
U. S. LNG Imports by Country, 1992 -2007 (Billion cubic feet) Equatorial Guinea Egypt Trinidad and Tobago Nigeria Other Algeria Source: Energy Information Administration, based on data from the Office of Fossil Energy, U. S. Dept. of Energy
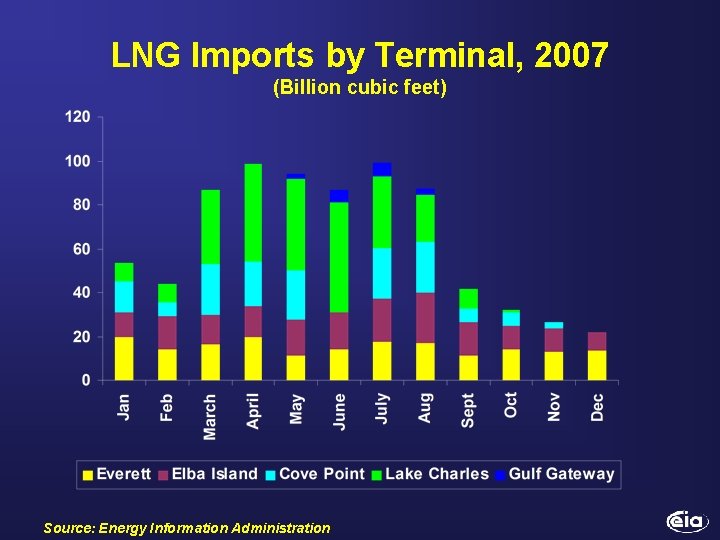
LNG Imports by Terminal, 2007 (Billion cubic feet) Source: Energy Information Administration
Overall Natural Gas Outlook to 2030
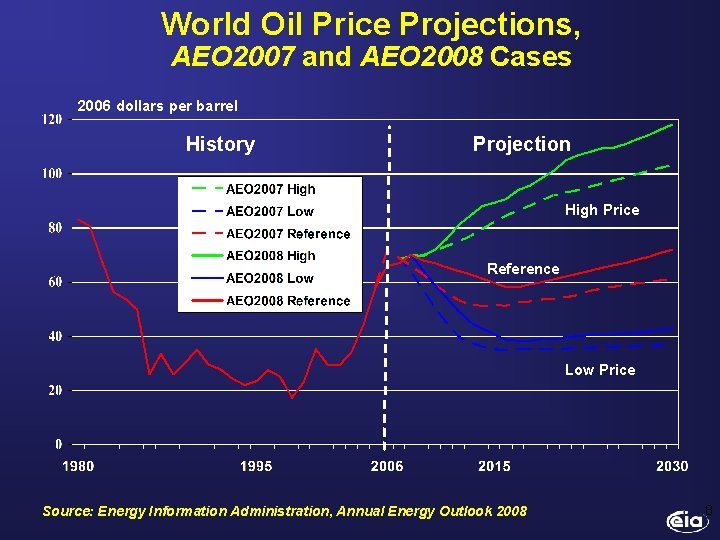
World Oil Price Projections, AEO 2007 and AEO 2008 Cases 2006 dollars per barrel History Projection High Price Reference Low Price Source: Energy Information Administration, Annual Energy Outlook 2008 8
U. S Natural Gas Wellhead Prices, 1970 -2030 2006 dollars per thousand cubic feet History Source: Energy Information Administration, Annual Energy Outlook 2008 Projection 9
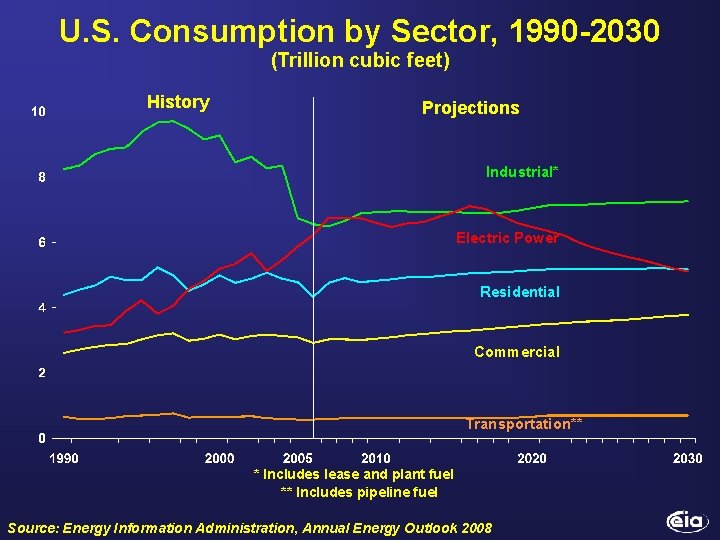
U. S. Consumption by Sector, 1990 -2030 (Trillion cubic feet) History Projections Industrial* Electric Power Residential Commercial Transportation** * Includes lease and plant fuel ** Includes pipeline fuel Source: Energy Information Administration, Annual Energy Outlook 2008
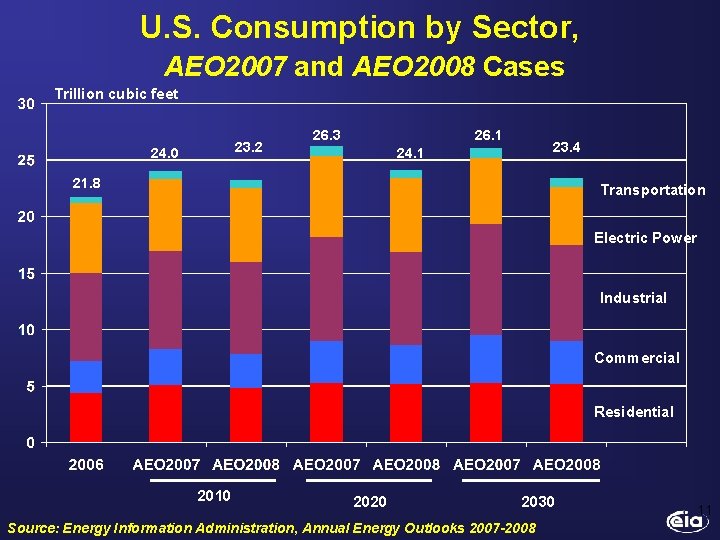
U. S. Consumption by Sector, AEO 2007 and AEO 2008 Cases Trillion cubic feet 23. 2 24. 0 26. 3 26. 1 23. 4 24. 1 21. 8 Transportation Electric Power Industrial Commercial Residential 2010 2020 2030 Source: Energy Information Administration, Annual Energy Outlooks 2007 -2008 11
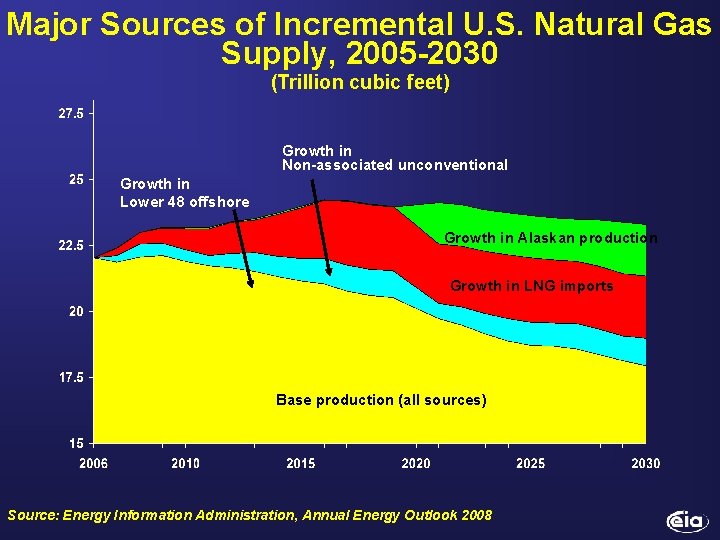
Major Sources of Incremental U. S. Natural Gas Supply, 2005 -2030 (Trillion cubic feet) Growth in Non-associated unconventional Growth in Lower 48 offshore Growth in Alaskan production Growth in LNG imports Base production (all sources) Source: Energy Information Administration, Annual Energy Outlook 2008
• Natural Gas Import Outlook
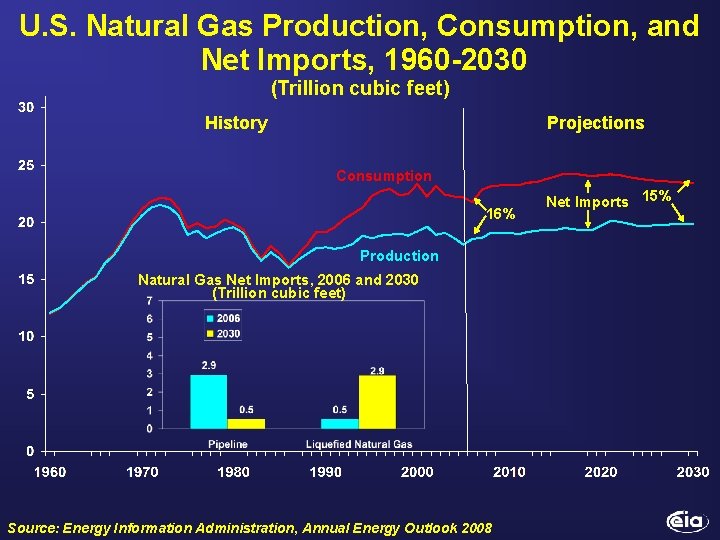
U. S. Natural Gas Production, Consumption, and Net Imports, 1960 -2030 (Trillion cubic feet) History Projections Consumption 16% Production Natural Gas Net Imports, 2006 and 2030 (Trillion cubic feet) Source: Energy Information Administration, Annual Energy Outlook 2008 Net Imports 15%
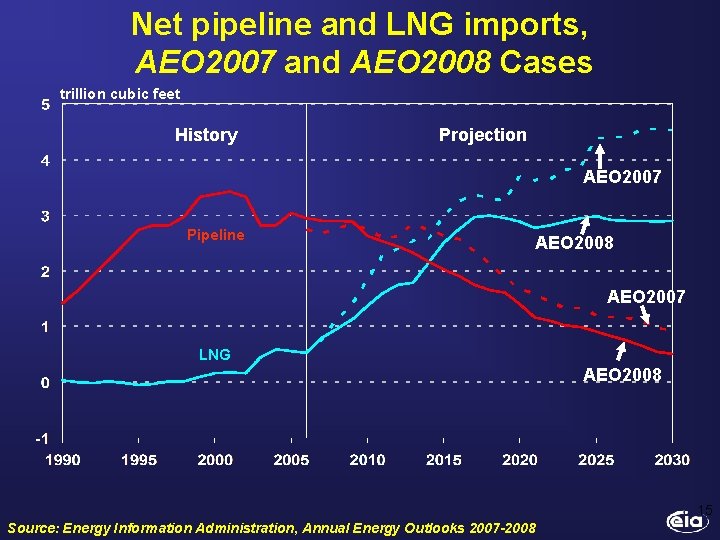
Net pipeline and LNG imports, AEO 2007 and AEO 2008 Cases trillion cubic feet History Projection AEO 2007 Pipeline AEO 2008 AEO 2007 LNG AEO 2008 15 Source: Energy Information Administration, Annual Energy Outlooks 2007 -2008
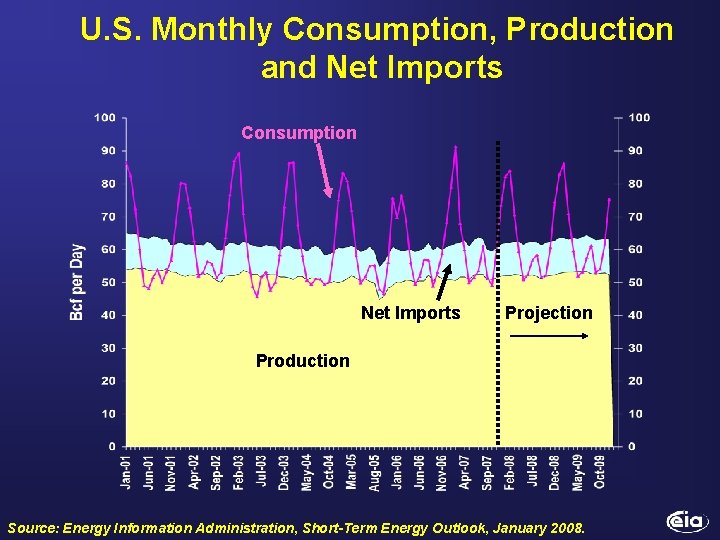
U. S. Monthly Consumption, Production and Net Imports Consumption Net Imports Projection Production Source: Energy Information Administration, Short-Term Energy Outlook, January 2008.
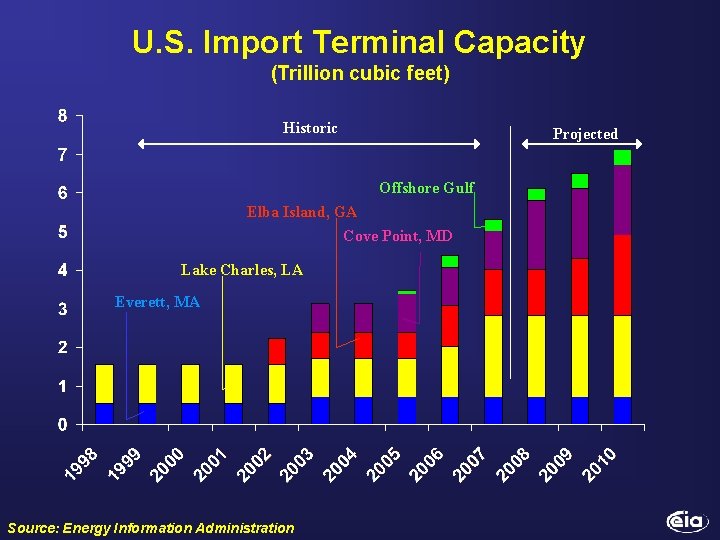
U. S. Import Terminal Capacity (Trillion cubic feet) Historic Projected Offshore Gulf Elba Island, GA Cove Point, MD Lake Charles, LA Everett, MA Source: Energy Information Administration
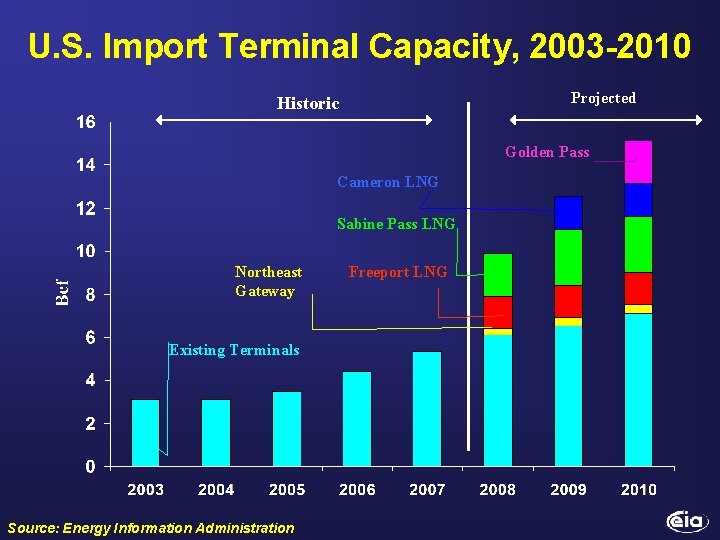
U. S. Import Terminal Capacity, 2003 -2010 Projected Historic Golden Pass Cameron LNG Sabine Pass LNG Northeast Gateway Existing Terminals Source: Energy Information Administration Freeport LNG
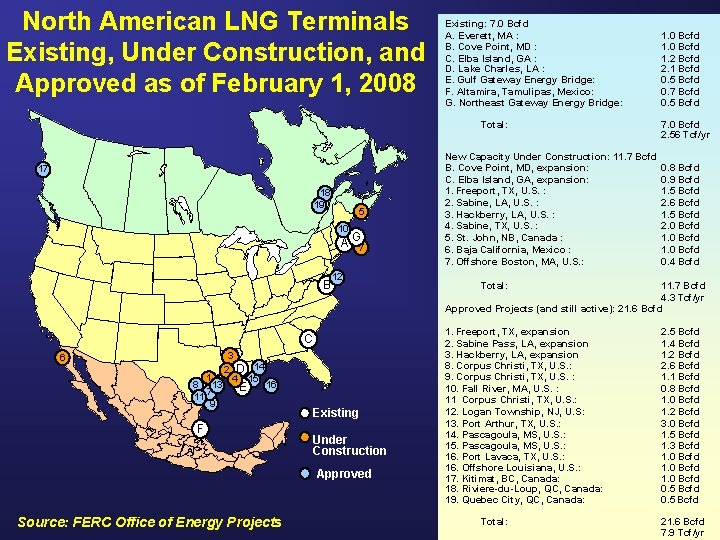
North American LNG Terminals Existing, Under Construction, and Approved as of February 1, 2008 Existing: 7. 0 Bcfd A. Everett, MA : B. Cove Point, MD : C. Elba Island, GA : D. Lake Charles, LA : E. Gulf Gateway Energy Bridge: F. Altamira, Tamulipas, Mexico: G. Northeast Gateway Energy Bridge: Total: 17 18 19 5 10 A G 7 B 12 C 6 1 8 13 7 11 9 3 2 D 14 4 15 E 16 F Existing Under Construction Approved Source: FERC Office of Energy Projects New Capacity Under Construction: 11. 7 Bcfd B. Cove Point, MD, expansion: C. Elba Island, GA, expansion: 1. Freeport, TX, U. S. : 2. Sabine, LA, U. S. : 3. Hackberry, LA, U. S. : 4. Sabine, TX, U. S. : 5. St. John, NB, Canada : 6. Baja California, Mexico : 7. Offshore Boston, MA, U. S. : 1. 0 Bcfd 1. 2 Bcfd 2. 1 Bcfd 0. 5 Bcfd 0. 7 Bcfd 0. 5 Bcfd 7. 0 Bcfd 2. 56 Tcf/yr 0. 8 Bcfd 0. 9 Bcfd 1. 5 Bcfd 2. 6 Bcfd 1. 5 Bcfd 2. 0 Bcfd 1. 0 Bcfd 0. 4 Bcfd Total: 11. 7 Bcfd 4. 3 Tcf/yr Approved Projects (and still active): 21. 6 Bcfd 1. Freeport, TX, expansion 2. Sabine Pass, LA, expansion 3. Hackberry, LA, expansion 8. Corpus Christi, TX, U. S. : 9. Corpus Christi, TX, U. S. : 10. Fall River, MA, U. S. : 11 Corpus Christi, TX, U. S. : 12. Logan Township, NJ, U. S: 13. Port Arthur, TX, U. S. : 14. Pascagoula, MS, U. S. : 15. Pascagoula, MS, U. S. : 16. Port Lavaca, TX, U. S. : 16. Offshore Louisiana, U. S. : 17. Kitimat, BC, Canada: 18. Riviere-du-Loup, QC, Canada: 19. Quebec City, QC, Canada: Total: 2. 5 Bcfd 1. 4 Bcfd 1. 2 Bcfd 2. 6 Bcfd 1. 1 Bcfd 0. 8 Bcfd 1. 0 Bcfd 1. 2 Bcfd 3. 0 Bcfd 1. 5 Bcfd 1. 3 Bcfd 1. 0 Bcfd 0. 5 Bcfd 21. 6 Bcfd 7. 9 Tcf/yr
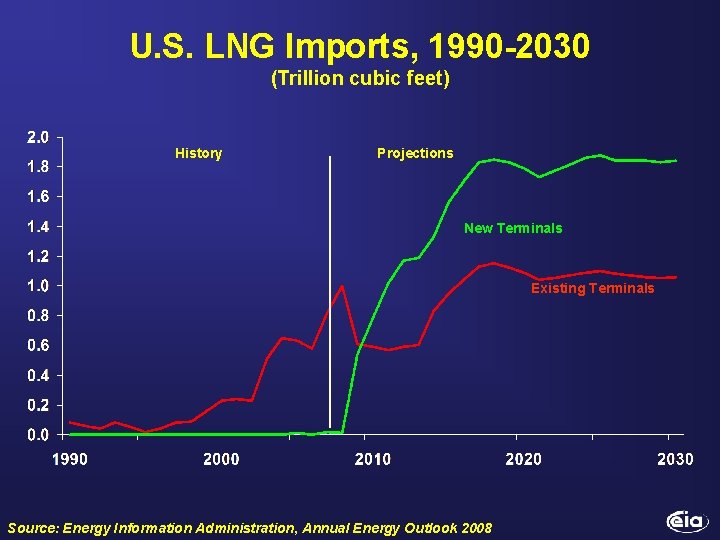
U. S. LNG Imports, 1990 -2030 (Trillion cubic feet) History Projections New Terminals Existing Terminals Source: Energy Information Administration, Annual Energy Outlook 2008
Periodic Reports Petroleum Status and Natural Gas Storage Reports, weekly Short-Term Energy Outlook, monthly Annual Energy Outlook 2008, February 2008 International Energy Outlook 2007, June 2007, next release May 2008 Examples of Special Analyses “Economic Effects of High Oil Prices, ” Annual Energy Outlook 2006 Analysis of Oil and Gas Production in the Arctic National Wildlife Refuge, March 2004 The Global Liquefied Natural Gas Market: Status and Outlook, December 2003 “Restricted Natural Gas Supply Case, ” Annual Energy Outlook 2005 www. eia. doe. gov Damien Gaul Damien. Gaul@eia. doe. gov