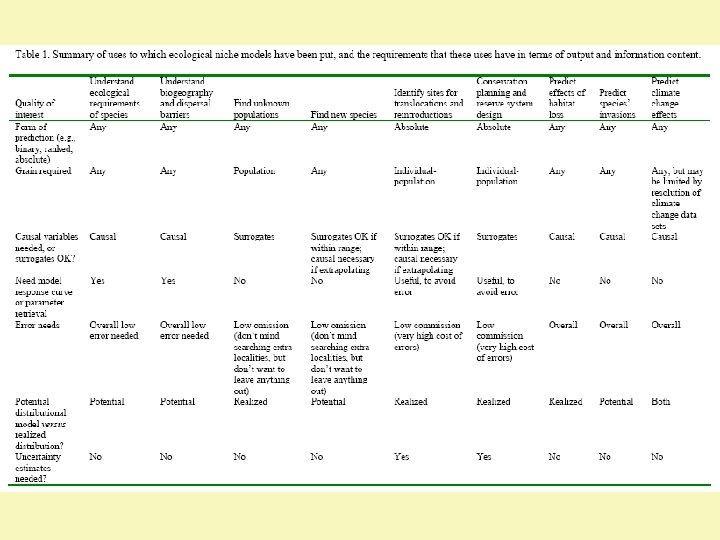
Testing Predictive Performance of Ecological Niche Models A


 absent Predicted present a (true positive)")

 (Liu et al. 2005 Ecography 29: 385 -393)")
")
 Omission (c/a+c) (proportion of presences predicted absent) Commission")
 T 10 LPT")
")

 absent Predicted present a (true positive)")
 absent Predicted present a (true positive)")
 absent Predicted present a (true positive)")
 absent Predicted present a (true positive)")

 absent Predicted present a (true positive)")
 absent Predicted present a (true positive)")
 (fraction of absences predicted present)")
 Curve A B set of ‘absences’ Frequency")
- Slides: 27
Testing Predictive Performance of Ecological Niche Models A. Townsend Peterson, STOLEN FROM Richard Pearson
Niche Model Validation • Diverse challenges … – Not a single loss function or optimality criterion – Different uses demand different criteria – In particular, relative weights applied to omission and commission errors in evaluating models • Nakamura: “which way is relevant to adopt is not a mathematical question, but rather a question for the user” – Asymmetric loss functions
Where do I get testing data? ?
Model calibration and evaluation strategies: resubstitution Projection Calibration All available data Same region Different region 100% Different time Different resolution Evaluation (after Araújo et al. 2005 Gl. Ch. Biol. )
Model calibration and evaluation strategies: independent validation Projection Same region All available data 100% Different region Calibration Evaluation Different time Different resolution (after Araújo et al. 2005 Gl. Ch. Biol. )
Model calibration and evaluation strategies: data splitting Projection Calibration data Calibration 70% Same region Different time Test data 30% Different resolution Evaluation (after Araújo et al. 2005 Gl. Ch. Biol. )
Types of Error
The four types of results that are possible when testing a distribution model (see Pearson NCEP module 2007)
Presence-absence confusion matrix Recorded present Recorded (or assumed) absent Predicted present a (true positive) b (false positive) Predicted absent c (false negative) d (true negative)
Thresholding
Selecting a decision threshold (p/a data) (Liu et al. 2005 Ecography 29: 385 -393)
Selecting a decision threshold (p/a data)
Selecting a decision threshold (p/a data) Omission (c/a+c) (proportion of presences predicted absent) Commission (b/b+d) (proportion of absences predicted present)
Selecting a decision threshold (p-o data) T 10 LPT
Threshold-dependent Tests (= loss functions)
The four types of results that are possible when testing a distribution model (see Pearson NCEP module 2007)
Presence-absence test statistics Recorded present Recorded (or assumed) absent Predicted present a (true positive) b (false positive) Predicted absent c (false negative) d (true negative) Proportion (%) correctly predicted (or ‘accuracy’, or ‘correct classification rate’): (a + d)/(a + b + c + d)
Presence-absence test statistics Recorded present Recorded (or assumed) absent Predicted present a (true positive) b (false positive) Predicted absent c (false negative) d (true negative) Cohen’s Kappa:
Presence-only test statistics Recorded present Recorded (or assumed) absent Predicted present a (true positive) b (false positive) Predicted absent c (false negative) d (true negative) Proportion of observed presences correctly predicted (or ‘sensitivity’, or ‘true positive fraction’): a/(a + c)
Presence-only test statistics Recorded present Recorded (or assumed) absent Predicted present a (true positive) b (false positive) Predicted absent c (false negative) d (true negative) Proportion of observed presences correctly predicted (or ‘sensitivity’, or ‘true positive fraction’): a/(a + c) Proportion of observed presences incorrectly predicted (or ‘omission rate’, or ‘false negative fraction’): c/(a + c)
Presence-only test statistics: testing for statistical significance U. sikorae Success rate: 4 from 7 Proportion predicted present: 0. 231 Binomial p = 0. 0546 U. sikorae Success rate: 6 from 7 Proportion predicted present: 0. 339 Binomial p = 0. 008 Leaf-tailed gecko (Uroplatus)
Absence-only test statistics Recorded present Recorded (or assumed) absent Predicted present a (true positive) b (false positive) Predicted absent c (false negative) d (true negative) Proportion of observed (or assumed) absences correctly predicted (or ‘specificity’, or ‘true negative fraction’): d/(b + d)
Absence-only test statistics Recorded present Recorded (or assumed) absent Predicted present a (true positive) b (false positive) Predicted absent c (false negative) d (true negative) Proportion of observed (or assumed) absences correctly predicted (or ‘specificity’, or ‘true negative fraction’): d/(b + d) Proportion of observed (or assumed) absences incorrectly predicted (or ‘commission rate’, or ‘false positive fraction’): b/(b + d)
AUC: a threshold-independent test statistic (1 – omission rate) (fraction of absences predicted present) Recorded present Predicted absent Recorded (or assumed) absent a (true positive) b (false positive) c (false negative) d (true negative) sensitivity = a/(a+c) specificity = d/(b+d)
Threshold-independent assessment: The Receiver Operating Characteristic (ROC) Curve A B set of ‘absences’ Frequency 1 set of ‘presences’ sensitivity 0 Predicted probability of occurrence 1 C set of ‘presences’ Frequency set of ‘absences’ 0 0 1 - specificity 1 0 Predicted probability of occurrence 1 (check out: http: //www. anaesthetist. com/mnm/stats/roc/Findex. htm)