Teachers Name ANDREW ARON School RAFSANJANI SOGA SECONDARY
,")


CLASS LIMITS. There are two limit for each class, the")


 Ø The differences between consecutive lower limit or upper limits. Also")


Basic mathematics for secondary school, bookthree, Moevt, UDSM.")

- Slides: 32
Teacher’s Name: ANDREW ARON, School: RAFSANJANI SOGA SECONDARY, Region: PWANI, Subject: BASIC APPLIED MATHEMATICS(BAM), Topic: STATISTICS, Sub-topic: INTRODUCTION TO STATISTICS, 29 marks Form: FIVE,
LESSON OBJECTIVES Students should be able to Explain the meaning of statistics Explain the meaning of measurement and data Mention types of statistics Distinguish various presentation of data Construct a graphs/lines represents data Explain the significance of statistics
INTRODUCTION Questions: 1. What do you understand by the term statistics? 2. Name the types of statistics you know. 3. What are the uses of statistics? 4. What is data? 5. What is measurements? 6. Do you know any ways of presenting data? Mention them
STATISTICS. v Statistics is the science of collecting, organizing, presenting, analyzing and interpreting data to assist in making more effective decisions and making reasonable conclusion. v Definition: Science of collection, presentation, analysis, and reasonable interpretation of data.
MEASUREMENT Measurement is a process of assigning numbers to an observation The measurements obtained in a research study are called the data. The goal of statistics is to help researchers organize and interpret the data.
DATA v Statistical data are usually obtained by counting or measuring items. Most data can be put into the following categories: 1. Qualitative data- are measurements that each fail into one of several categories. (hair color, ethnic groups and other attributes of the population) 2. Quantitative data - are observations that are measured on a numerical scale (distance traveled to college, number of children in a family, etc. )
TYPES OF STATISTICS. A. Descriptive statistics – Methods of organizing, summarizing, and presenting data in an informative way B. Inferential statistics – The methods used to determine something about a population on the basis of a sample Population –The entire set of individuals or objects of interest or the measurements obtained from all individuals or objects of interest Sample – A portion, or part, of the population of interest
A. Descriptive Statistics Collect data e. g. , Survey Present data e. g. , Tables and graphs Summarize data e. g. , Sample mean =
FREQUENCY DISTRIBUTION TABLES v A frequency distribution table shows classes or intervals of data entries with a count of the number of entries in each class v Example. Make a frequency distribution tables for the following data using 5 classes: 5, 10, 7, 19, 25, 12, 15, 7, 6, 8, 17, 22, 21, 7, 7, 24, 5, 6, 5.
SOLUTION
FREQUENCY DISTRBUTION TABLES Frequency distribution table TALLY CLASS FREQUENCIES 5 -8 ///// 10 9 -11 / 1 12 -15 // 2 16 -19 /// 3 20 -23 // 2 24 -27 // 2
EXERCISE 1. prepare the frequency distribution tables for the following data, 2, 1, 3, 4, 2, 5, 2, 3, 4, 5, 1, 6, 2, 3, 2, 2, 3, 4, 4, 1, 3, 3, 2, 4, 5, 2, 6, 1, 4, 2, 3, 4.
CUMULATIVE FREQUENCY DISTRIBUTION TABLES Cumulative frequency distribution tables for ungrouped data Examples Make a cumulative frequency table of a data 2, 1, 3, 4, 2, 5, 2, 3, 4, 5, 1, 6, 2, 3, 2, 2, 3, 4, 4, 1, 3, 3, 2, 4, 5, 2, 6, 1, 4, 2, 3, 4.
CUMULATIVE FREQUENCY TABLES CLASS TALLY FREQUENCIES CUMULATIVE FREQUENCY 5 -8 ///// 10 10 9 -11 / 1 11 12 -15 // 2 13 16 -19 /// 3 16 20 -23 // 2 18 24 -27 // 2 20
USEFULL TERMINOLOGIES IN STATISTICS A)CLASS LIMITS. There are two limit for each class, the lower limit and upper limit. Ø The lower limit for every class is the smallest value in that class. Ø The upper limit for every class is the greatest value in that class Ø Example, 6 -10 : the lower limit is 6 and upper limit is 10.
B. CLASS MARKS
C. CLASS BOUNDARIES Class boundaries are the numbers used to separate classes. Example: 6 -10, lower boundary is 5. 5 and upper boundary is 10. 5
D. CLASS SIZE(WIDTH) Ø The differences between consecutive lower limit or upper limits. Also the difference between the class boundaries of each class interval. But also the difference between consecutive class marks
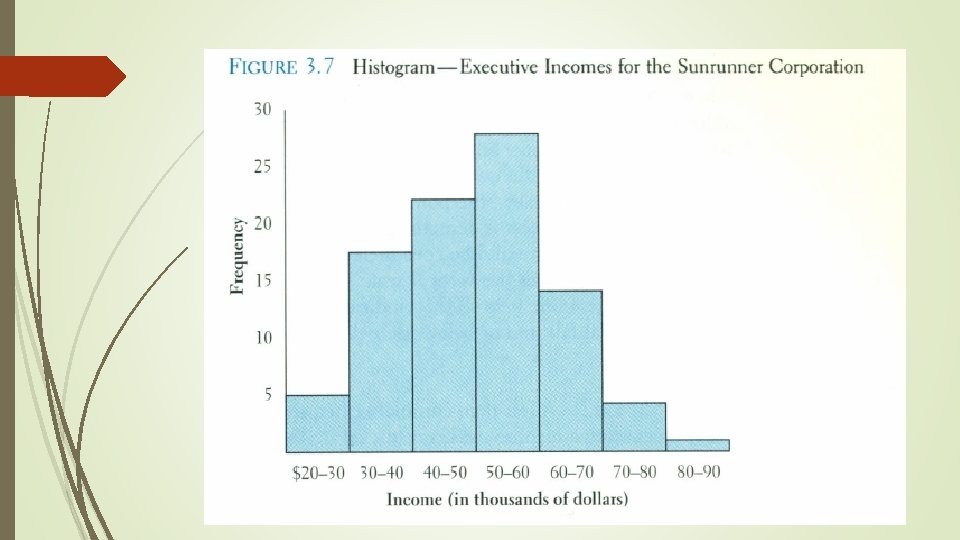
PRESENTATION OF DATA HISTOGRAM Frequently used to graphically present interval and ratio data Is often used for interval and ratio data The adjacent bars indicate that a numerical range is being summarized by indicating the frequencies in arbitrarily chosen classes
FREQUENCY POLYGON THE FREQUENCY POLYGON is a graph that displays the data by using lines that connect points
FREQUENCY POLYGON
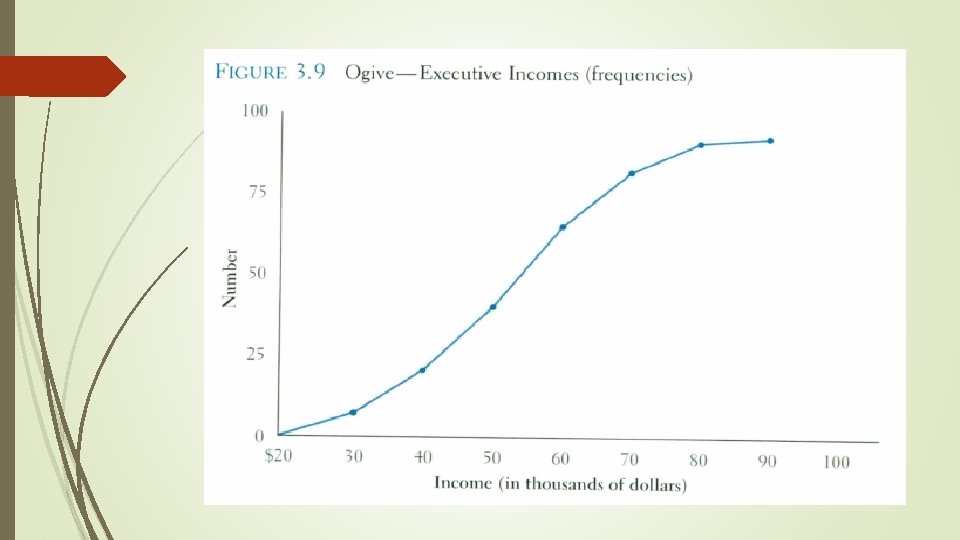
THE OGIVE A graph of a cumulative frequency distribution Ogive is used when one wants to determine how many observations lie above or below a certain value in a distribution. First cumulative frequency distribution is constructed Cumulative frequencies are plotted at the upper class limit of each category Ogive can also be constructed for a relative frequency distribution.
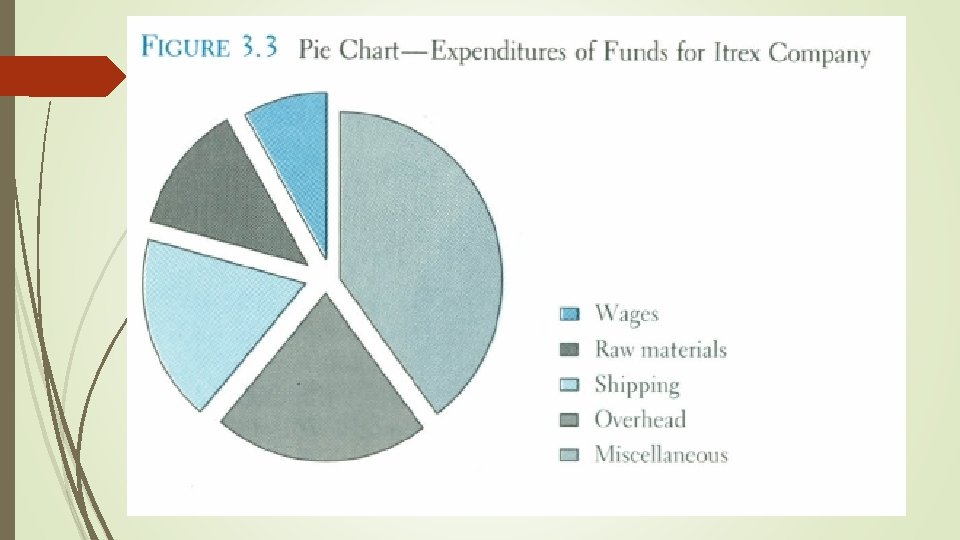
THE PIE CHART The pie chart is an effective way of displaying the percentage breakdown of data by category. Useful if the relative sizes of the data components are to be emphasized Pie charts also provide an effective way of presenting ratio- or interval-scaled data after they have been organized into categories
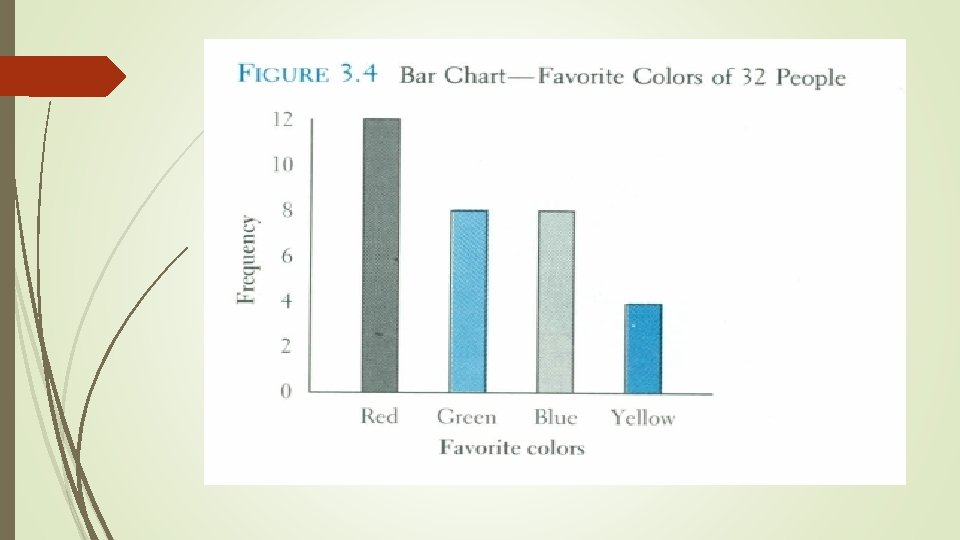
BAR CHART Another common method for graphically presenting nominal and ordinal scaled data One bar is used to represent the frequency for each category The bars are usually positioned vertically with their bases located on the horizontal axis of the graph The bars are separated, and this is why such a graph is frequently used for nominal and ordinal data – the separation emphasize the plotting of frequencies for distinct categories
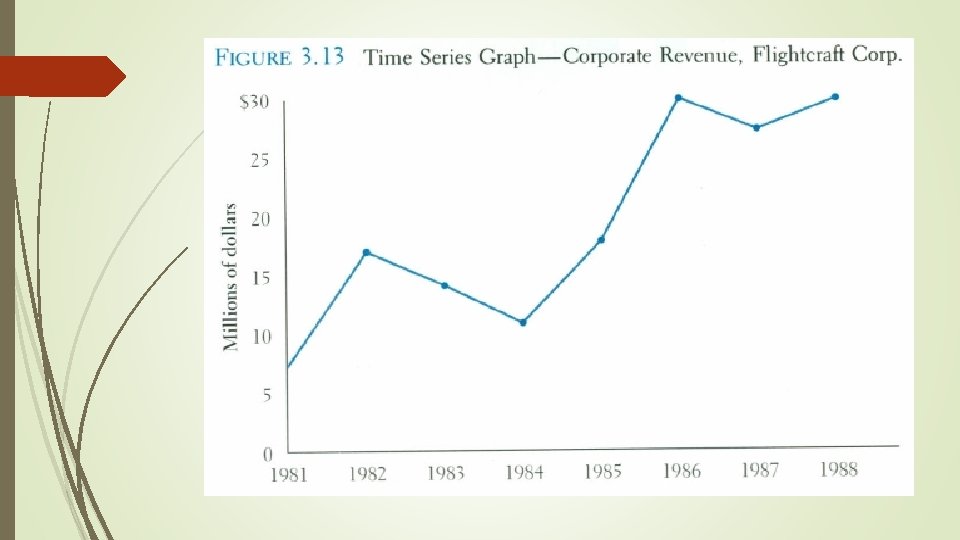
THE TIME SERIES GRAPH The time series graph is a graph of data that have been measured over time. The horizontal axis of this graph represents time periods and the vertical axis shows the numerical values corresponding to these time periods
REFFERENCES • BAM book, white board, Tie(2009)Basic mathematics for secondary school, bookthree, Moevt, UDSM. • JAMES, R(2010) Probability and Non Probability statistics, Nairobu, kenya. • http//www. google/search.
THE END OF A LESSON: BYE