Teacher Note Module 2 Overview Content Area HypothesisTesting


- Slides: 44
Teacher Note: Module 2 Overview Content Area: Hypothesis-Testing: Cross-Sectional Study Essential Questions: How can I select groups of people and collect data/evidence from them that will test my hypothesis? If my causal hypothesis is correct, how would the exposure and outcome be distributed in these groups? Enduring Understanding: Causal hypotheses can be tested by conducting investigations of the exposures and outcomes of selected groups of people as they go about their lives. Information from these observational studies can be used to determine if an exposure and an outcome are associated. Because observational studies are complicated by factors not controlled by the observer, when an association is found, other explanations in addition to causality also must be considered. Core Concepts: • Testing hypotheses • Association • Exposure/outcome • Comparison group • 2 x 2 table • Observational studies • Study design/study plan • Study samples • Prevalence rate • Prevalence ratio • Statement of effect Lesson 2 -2: Cross-Sectional Studies Revised Sept 14, 2011 Lessons: 2 -1 Looking for Associations 2 -2 Cross-Sectional Studies 2 -3 Developing Hypothesis and Study Questions 2 -4 Respect – Part II 2 -5 Planning Study Conduct 2 -6 Cross-Sectional Study - In Class 2 -7 Cross-Sectional Study – In School 1
Teacher Note: Enduring Epidemiological Understandings for the Epidemiology and the Energy Balance Equation Curriculum 1. Health and disease are not distributed haphazardly in a population. There are patterns to their occurrence that can be identified through surveillance. Analysis of the patterns of health and disease distribution can provide clues formulating hypotheses about their possible causes. 2. Causal hypotheses can be tested by conducting investigations of the exposures and outcomes of selected groups of people as they go about their lives. Information from these observational studies can be used to determine if an exposure and an outcome are associated. Because observational studies are complicated by factors not controlled by the observer, other explanations also must be considered. Lesson 2 -2: Cross-Sectional Studies 2
Teacher Note: Authentic Assessment for Module 2 of the Epidemiology and the Energy Balance Equation Curriculum Students will conduct, analyze, and interpret observational, crosssectional studies among students in their class and then among students outside their class. Working in teams, students will have the opportunity to demonstrate their abilities to select a reasonable hypothesis of interest to them, design study questions about exposure and outcome, obtain informed consent, collect and manage data, calculate and compare prevalence rates, make accurate statements about whether their data support that hypothesis, and consider alternate explanations for what they observed. Reporting of results will be required, such as a written report, an item for the school newspaper, or an oral presentation or poster for students, teachers, and/or parents. Specific performance criteria will be used to help ensure that the experiences allow a genuine, realistic, and fair assessment of students’ comprehension of the Module 2 Enduring Epidemiological Understanding. Lesson 2 -2: Cross-Sectional Studies 3
Start of Lesson 2 -2 (estimate 1 class period) Lesson 2 -2: Cross-Sectional Studies 4
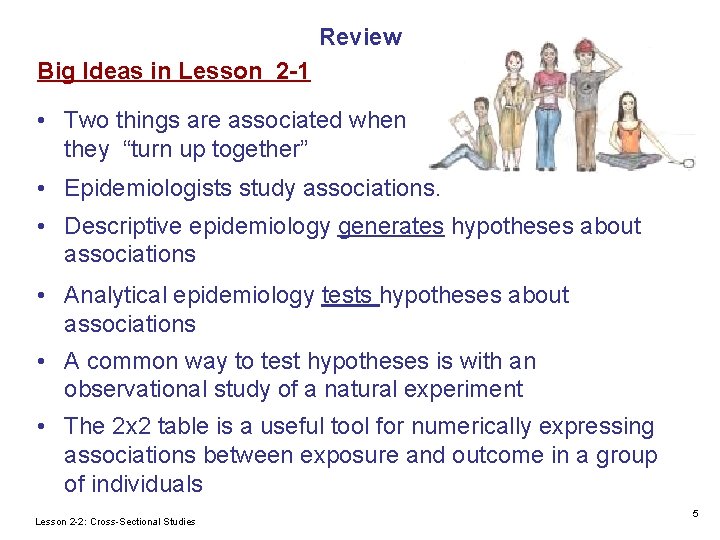
Review Big Ideas in Lesson 2 -1 • Two things are associated when they “turn up together” • Epidemiologists study associations. • Descriptive epidemiology generates hypotheses about associations • Analytical epidemiology tests hypotheses about associations • A common way to test hypotheses is with an observational study of a natural experiment • The 2 x 2 table is a useful tool for numerically expressing associations between exposure and outcome in a group of individuals Lesson 2 -2: Cross-Sectional Studies 5
The Journey from Exposure to Outcome Lesson 2 -2: Cross-Sectional Studies 6
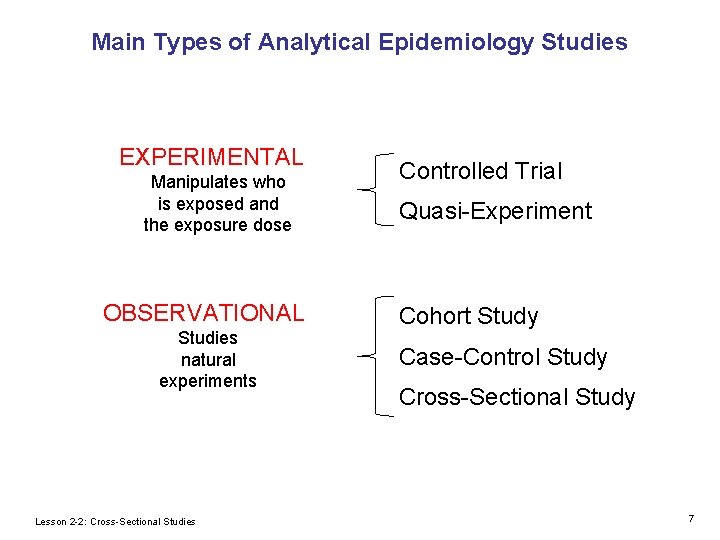
Main Types of Analytical Epidemiology Studies EXPERIMENTAL Manipulates who is exposed and the exposure dose OBSERVATIONAL Studies natural experiments Lesson 2 -2: Cross-Sectional Studies Controlled Trial Quasi-Experiment Cohort Study Case-Control Study Cross-Sectional Study 7
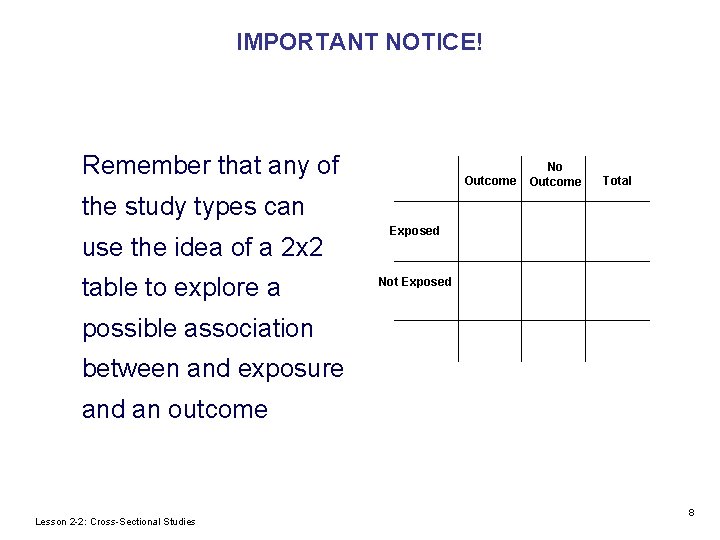
IMPORTANT NOTICE! Remember that any of Outcome No Outcome Total the study types can use the idea of a 2 x 2 table to explore a Exposed Not Exposed possible association between and exposure and an outcome Lesson 2 -2: Cross-Sectional Studies 8
Cross-Sectional Study a d e all c s ime e study t e Som valenc pre A sn apsh ot of w h is go at ing o n One poin time An observational study Lesson 2 -2: Cross-Sectional Studies 9
What Do You Think? • Would the quickest and easiest study be experimental or observational? Observational • What would be the least amount of data you could collect from each study participant [in order to study an association]? Two questions – one about the exposure, and one about the outcome Lesson 2 -2: Cross-Sectional Studies 10
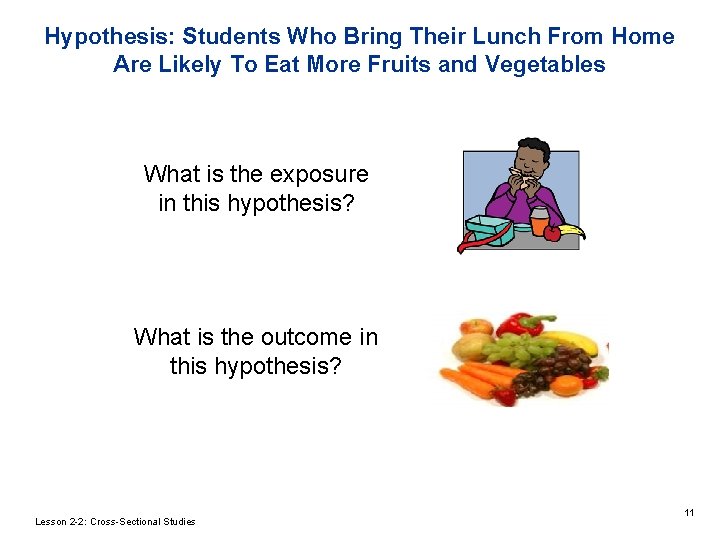
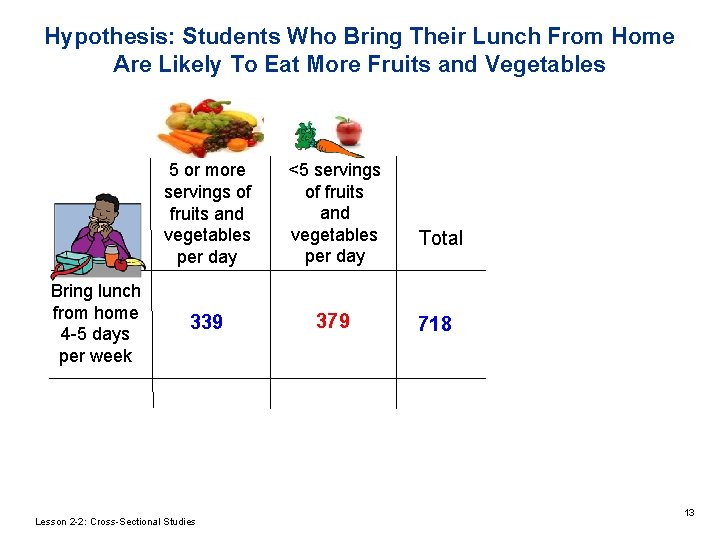
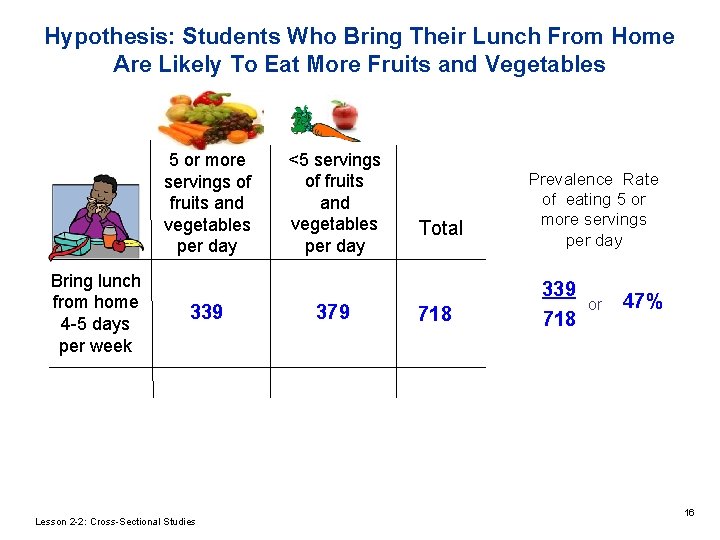
Hypothesis: Students Who Bring Their Lunch From Home Are Likely To Eat More Fruits and Vegetables What is the exposure in this hypothesis? What is the outcome in this hypothesis? Lesson 2 -2: Cross-Sectional Studies 11
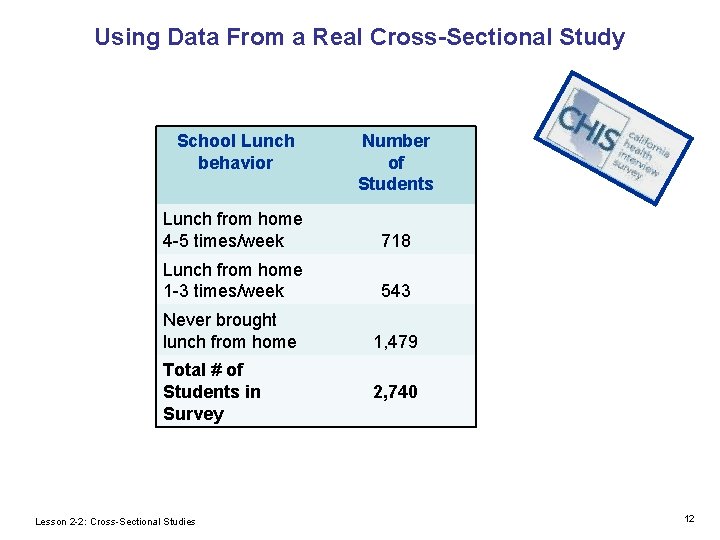
Using Data From a Real Cross-Sectional Study School Lunch behavior Number of Students Lunch from home 4 -5 times/week 718 Lunch from home 1 -3 times/week 543 Never brought lunch from home Total # of Students in Survey Lesson 2 -2: Cross-Sectional Studies 1, 479 2, 740 12
Hypothesis: Students Who Bring Their Lunch From Home Are Likely To Eat More Fruits and Vegetables <5 servings 5 or more of fruits servings of and fruits and vegetables Total per day Bring lunch from home 4 -5 days per week 339 Lesson 2 -2: Cross-Sectional Studies 379 718 13
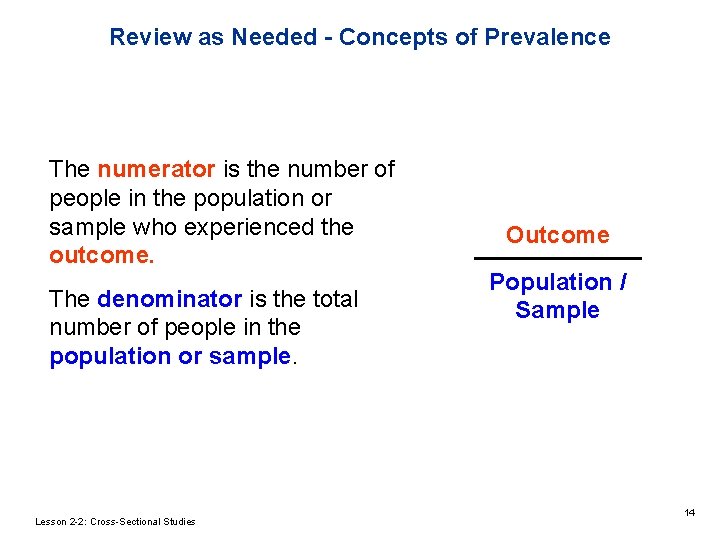
Review as Needed - Concepts of Prevalence The numerator is the number of people in the population or sample who experienced the outcome. The denominator is the total number of people in the population or sample. Lesson 2 -2: Cross-Sectional Studies Outcome Population / Sample 14
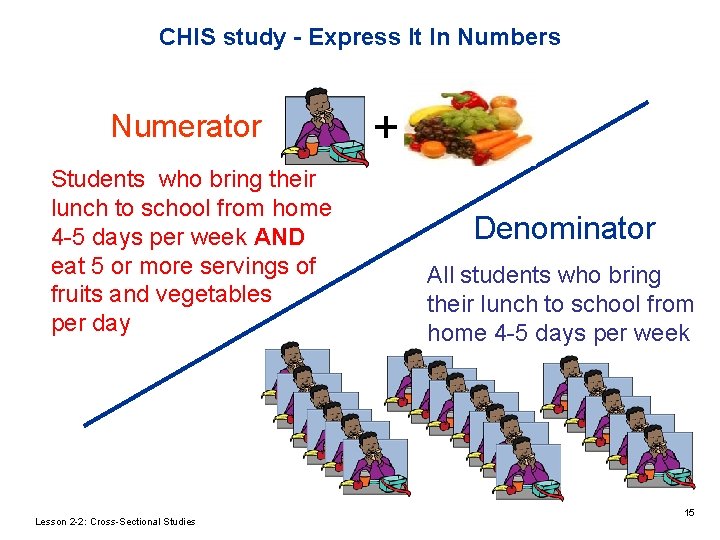
CHIS study - Express It In Numbers Numerator Students who bring their lunch to school from home 4 -5 days per week AND eat 5 or more servings of fruits and vegetables per day Lesson 2 -2: Cross-Sectional Studies + Denominator All students who bring their lunch to school from home 4 -5 days per week 15
Hypothesis: Students Who Bring Their Lunch From Home Are Likely To Eat More Fruits and Vegetables <5 servings 5 or more of fruits servings of and fruits and vegetables Total per day Bring lunch from home 4 -5 days per week 339 Lesson 2 -2: Cross-Sectional Studies 379 718 Tested Prevalence Rate of eating 5 or more servings per day 339 718 or 47% 16
Inference Process of predicting from what is observed in a sample, to what is true for the entire population. Lesson 2 -2: Cross-Sectional Studies 17
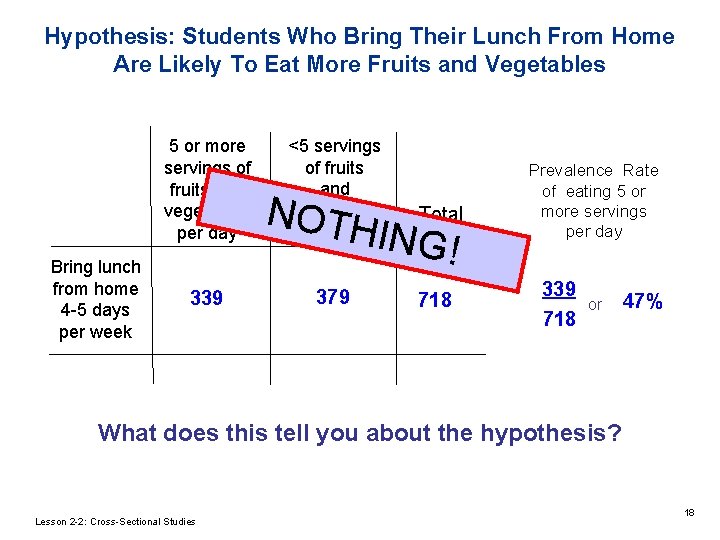
Hypothesis: Students Who Bring Their Lunch From Home Are Likely To Eat More Fruits and Vegetables <5 servings 5 or more of fruits servings of and fruits and vegetables Total per day Bring lunch from home 4 -5 days per week NOTH ING! 339 379 718 Prevalence Rate of eating 5 or more servings per day 339 718 or 47% What does this tell you about the hypothesis? Lesson 2 -2: Cross-Sectional Studies 18
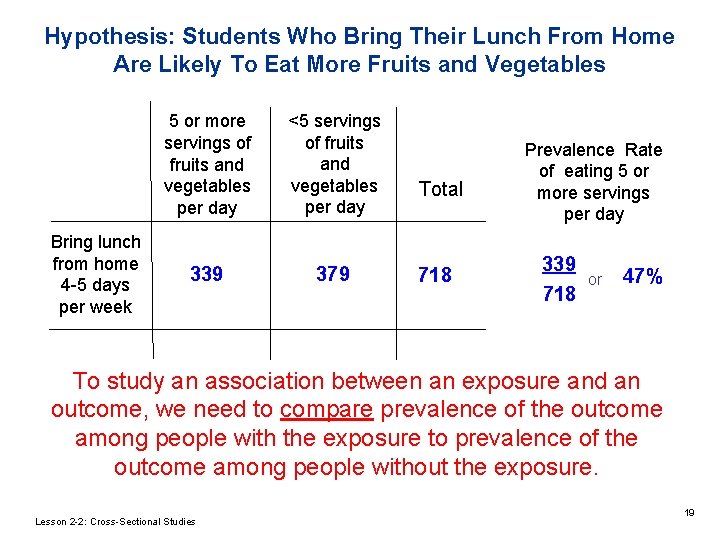
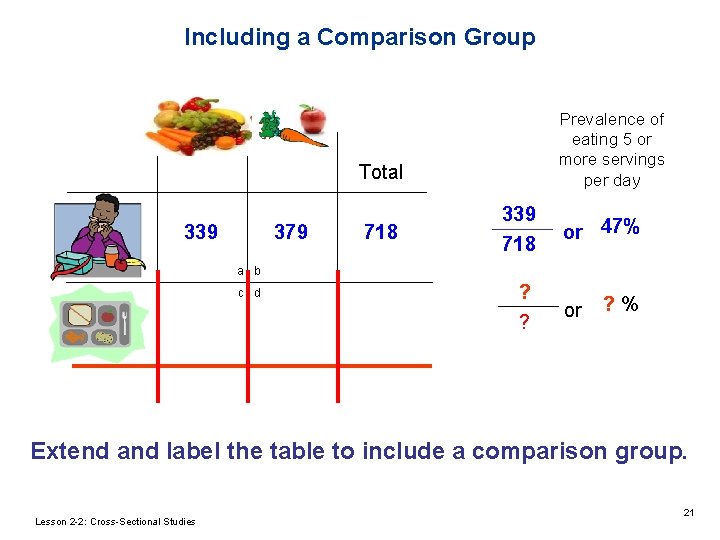
Hypothesis: Students Who Bring Their Lunch From Home Are Likely To Eat More Fruits and Vegetables <5 servings 5 or more of fruits servings of and fruits and vegetables Total per day Bring lunch from home 4 -5 days per week 339 379 718 Tested Prevalence Rate of eating 5 or more servings per day 339 718 or 47% To study an association between an exposure and an outcome, we need to compare prevalence of the outcome among people with the exposure to prevalence of the outcome among people without the exposure. Lesson 2 -2: Cross-Sectional Studies 19
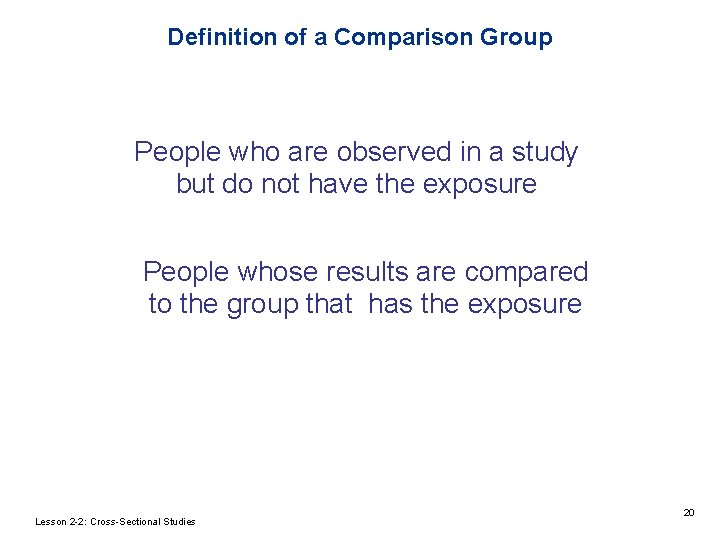
Definition of a Comparison Group People who are observed in a study but do not have the exposure People whose results are compared to the group that has the exposure Lesson 2 -2: Cross-Sectional Studies 20
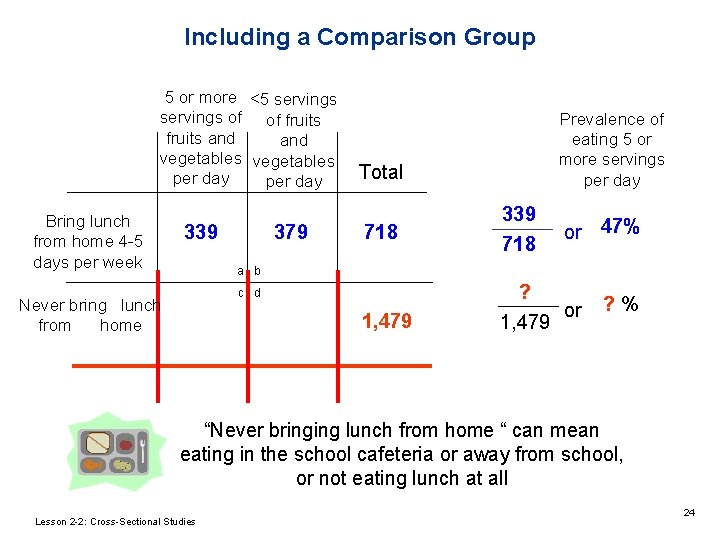
Including a Comparison Group Prevalence of eating 5 or more servings per day Total 339 379 718 339 718 or 47% a b c d ? ? or ? % Extend and label the table to include a comparison group. Lesson 2 -2: Cross-Sectional Studies 21
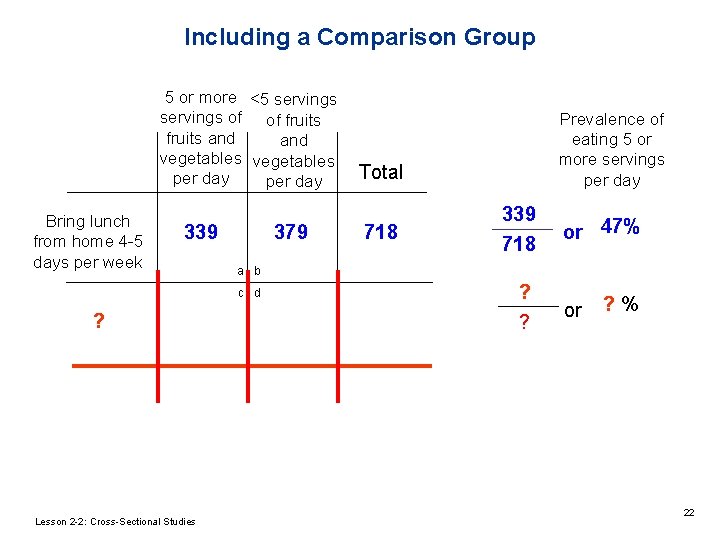
Including a Comparison Group 5 or more <5 servings of of fruits and vegetables Total per day Bring lunch 339 from home 4 -5 days per week 379 Lesson 2 -2: Cross-Sectional Studies 339 718 or 47% a b c d ? 718 Prevalence of eating 5 or more servings per day ? ? or ? % 22
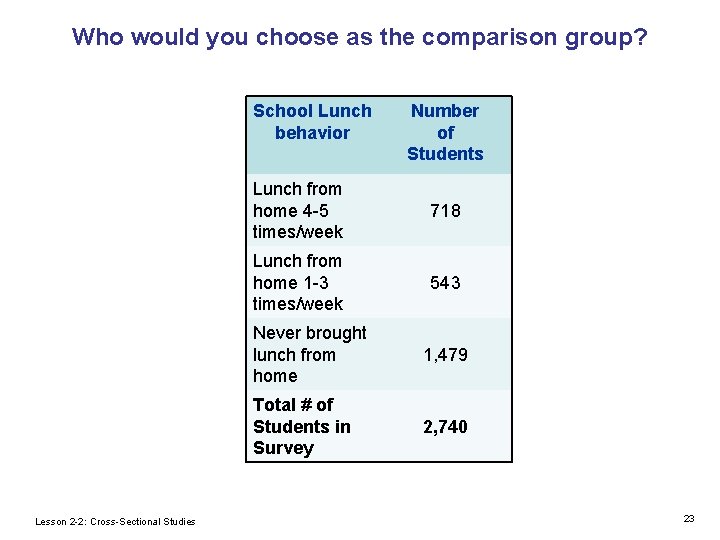
Who would you choose as the comparison group? School Lunch behavior Lesson 2 -2: Cross-Sectional Studies Number of Students Lunch from home 4 -5 times/week 718 Lunch from home 1 -3 times/week 543 Never brought lunch from home 1, 479 Total # of Students in Survey 2, 740 23
Including a Comparison Group 5 or more <5 servings of of fruits and vegetables Total per day Bring lunch 339 from home 4 -5 days per week 379 718 339 718 or 47% a b c d Never bring lunch from home Prevalence of eating 5 or more servings per day 1, 479 ? or 1, 479 ? % “Never bringing lunch from home “ can mean eating in the school cafeteria or away from school, or not eating lunch at all Lesson 2 -2: Cross-Sectional Studies 24
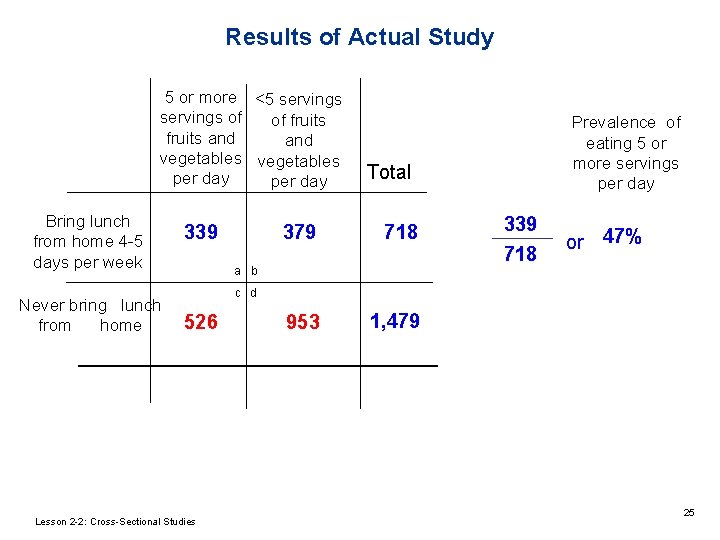
Results of Actual Study 5 or more <5 servings of of fruits and vegetables Total per day Bring lunch 339 from home 4 -5 days per week Never bring lunch from home 379 718 953 1, 479 a b Prevalence of eating 5 or more servings per day 339 718 or 47% c d 526 Lesson 2 -2: Cross-Sectional Studies 25
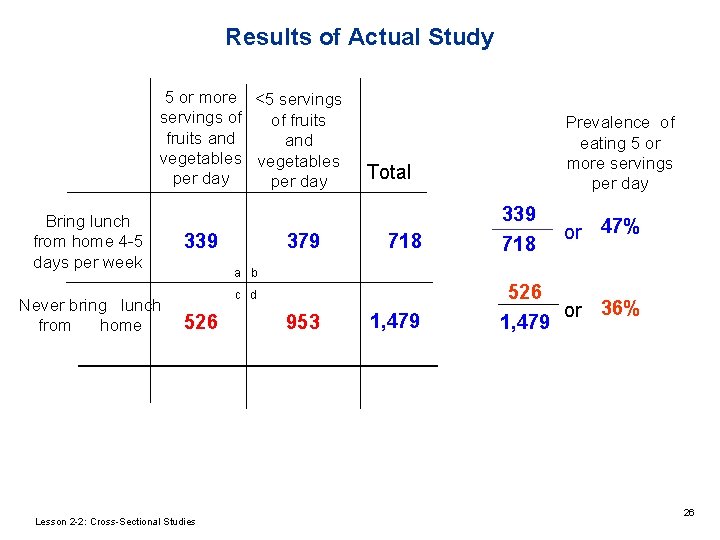
Results of Actual Study 5 or more <5 servings of of fruits and vegetables Total per day Bring lunch from home 4 -5 339 days per week Never bring lunch from home 379 718 Lesson 2 -2: Cross-Sectional Studies 339 718 or 47% a b c d 526 Prevalence of eating 5 or more servings per day 953 1, 479 526 or 36% 1, 479 26
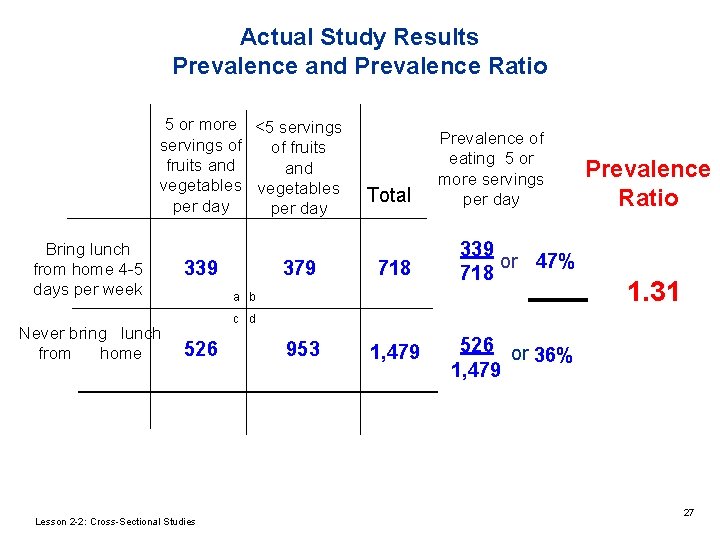
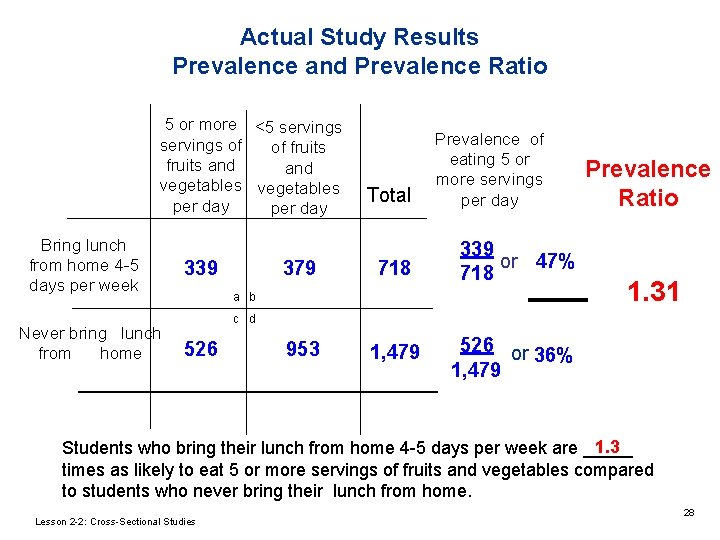
Actual Study Results Prevalence and Prevalence Ratio 5 or more <5 servings of of fruits and vegetables Total per day Bring lunch from home 4 -5 339 days per week Never bring lunch from home Prevalence of eating 5 or more servings per day 379 718 339 or 47% 718 953 1, 479 526 or 36% 1, 479 a b Prevalence Ratio 1. 31 c d 526 Lesson 2 -2: Cross-Sectional Studies 27
Actual Study Results Prevalence and Prevalence Ratio 5 or more <5 servings of of fruits and vegetables Total per day Bring lunch from home 4 -5 339 days per week Never bring lunch from home Prevalence of eating 5 or more servings per day 379 718 339 or 47% 718 953 1, 479 526 or 36% 1, 479 a b Prevalence Ratio 1. 31 c d 526 1. 3 Students who bring their lunch from home 4 -5 days per week are _____ times as likely to eat 5 or more servings of fruits and vegetables compared to students who never bring their lunch from home. Lesson 2 -2: Cross-Sectional Studies 28
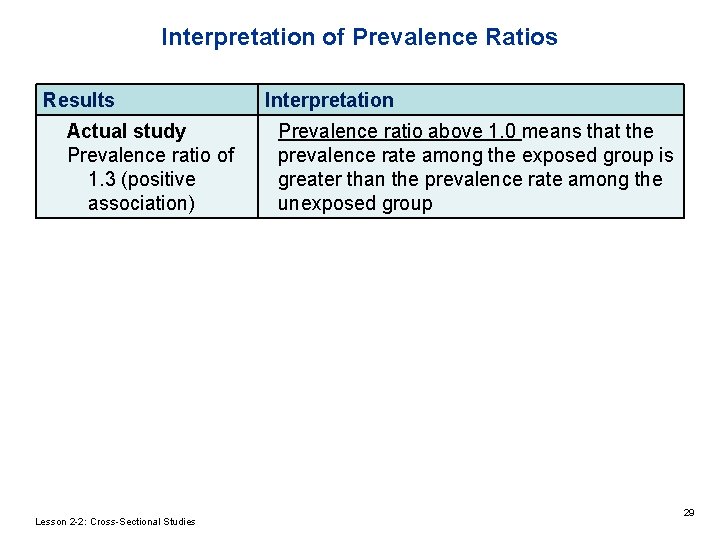
Interpretation of Prevalence Ratios Results Actual study Prevalence ratio of 1. 3 (positive association) Lesson 2 -2: Cross-Sectional Studies Interpretation Prevalence ratio above 1. 0 means that the prevalence rate among the exposed group is greater than the prevalence rate among the unexposed group 29
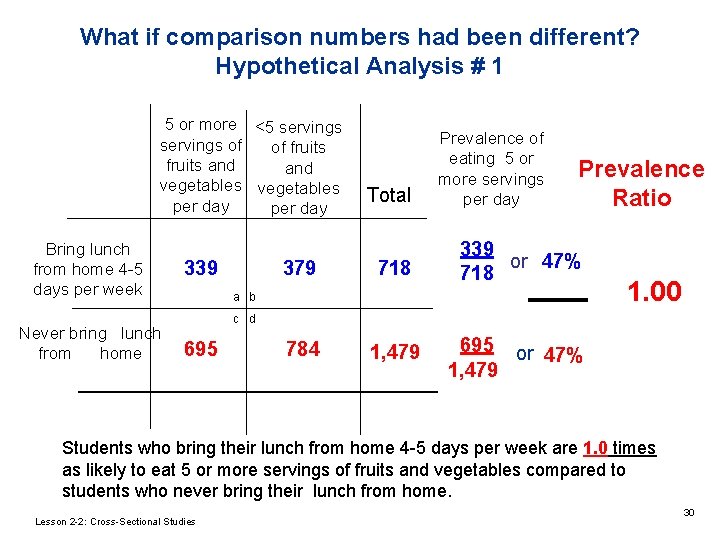
What if comparison numbers had been different? Hypothetical Analysis # 1 5 or more <5 servings of of fruits and vegetables Total per day Bring lunch from home 4 -5 339 days per week Never bring lunch from home Prevalence of eating 5 or more servings per day Prevalence Ratio 379 718 339 or 47% 718 784 1, 479 695 or 47% 1, 479 a b 1. 00 c d 695 Students who bring their lunch from home 4 -5 days per week are 1. 0 times as likely to eat 5 or more servings of fruits and vegetables compared to students who never bring their lunch from home. Lesson 2 -2: Cross-Sectional Studies 30
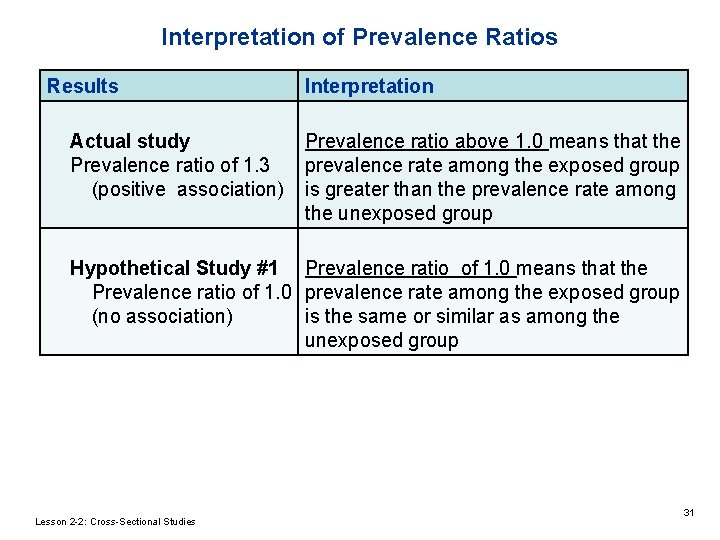
Interpretation of Prevalence Ratios Results Interpretation Actual study Prevalence ratio above 1. 0 means that the Prevalence ratio of 1. 3 prevalence rate among the exposed group (positive association) is greater than the prevalence rate among the unexposed group Hypothetical Study #1 Prevalence ratio of 1. 0 means that the Prevalence ratio of 1. 0 prevalence rate among the exposed group (no association) is the same or similar as among the unexposed group Lesson 2 -2: Cross-Sectional Studies 31
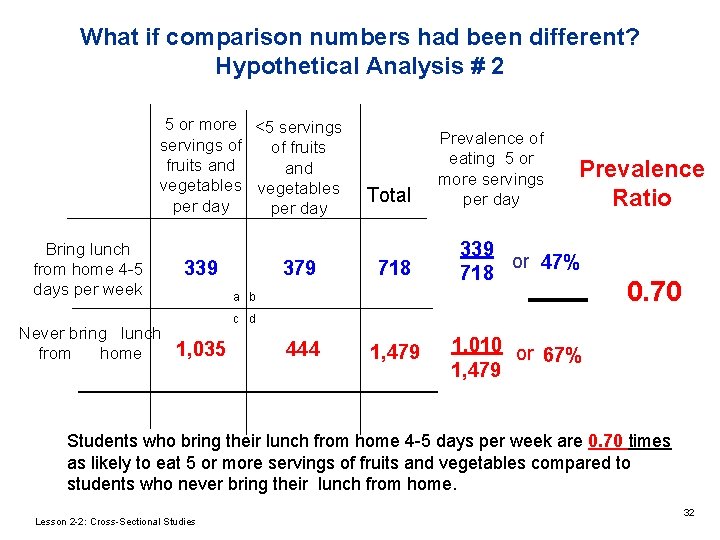
What if comparison numbers had been different? Hypothetical Analysis # 2 5 or more <5 servings of of fruits and vegetables Total per day Bring lunch from home 4 -5 339 days per week Never bring lunch 1, 035 from home Prevalence of eating 5 or more servings per day Prevalence Ratio 379 718 339 or 47% 718 444 1, 479 1, 010 or 67% 1, 479 a b 0. 70 c d Students who bring their lunch from home 4 -5 days per week are 0. 70 times as likely to eat 5 or more servings of fruits and vegetables compared to students who never bring their lunch from home. Lesson 2 -2: Cross-Sectional Studies 32
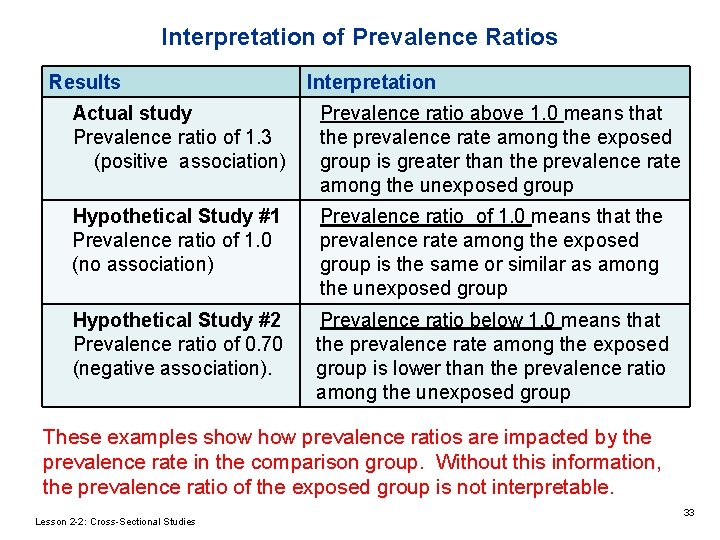
Interpretation of Prevalence Ratios Results Interpretation Actual study Prevalence ratio above 1. 0 means that Prevalence ratio of 1. 3 the prevalence rate among the exposed (positive association) group is greater than the prevalence rate among the unexposed group Hypothetical Study #1 Prevalence ratio of 1. 0 (no association) Prevalence ratio of 1. 0 means that the prevalence rate among the exposed group is the same or similar as among the unexposed group Hypothetical Study #2 Prevalence ratio of 0. 70 (negative association). Prevalence ratio below 1. 0 means that the prevalence rate among the exposed group is lower than the prevalence ratio among the unexposed group These examples show prevalence ratios are impacted by the prevalence rate in the comparison group. Without this information, the prevalence ratio of the exposed group is not interpretable. Lesson 2 -2: Cross-Sectional Studies 33
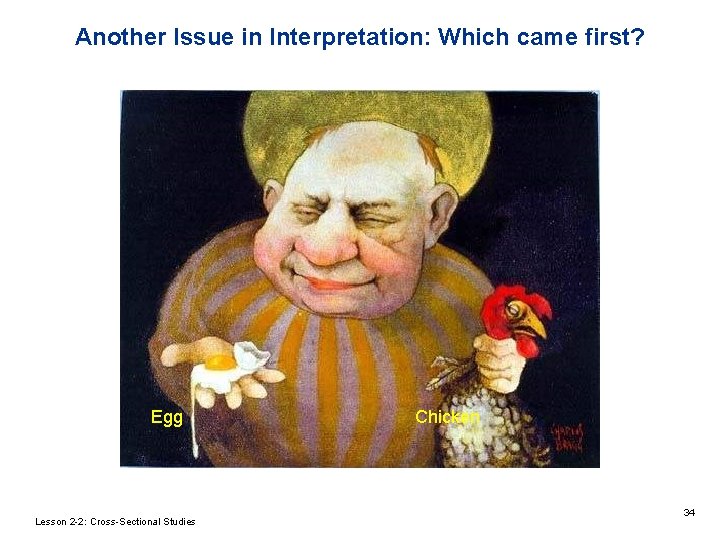
Another Issue in Interpretation: Which came first? Egg Lesson 2 -2: Cross-Sectional Studies Chicken 34
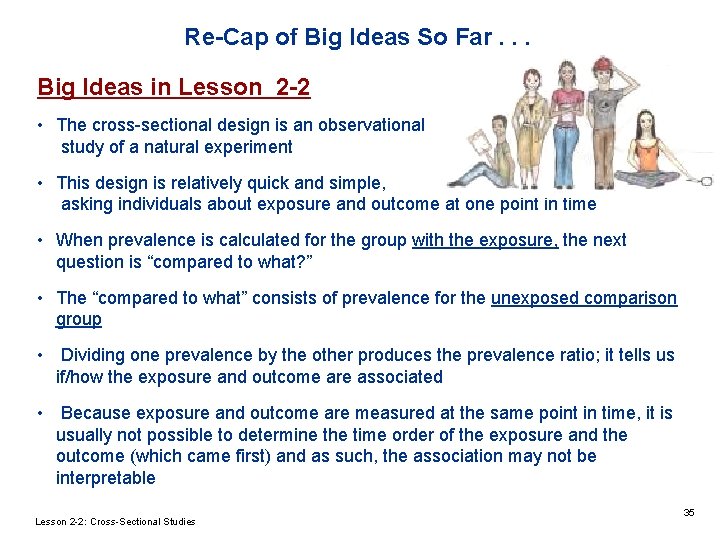
Re-Cap of Big Ideas So Far. . . Big Ideas in Lesson 2 -2 • The cross-sectional design is an observational study of a natural experiment • This design is relatively quick and simple, asking individuals about exposure and outcome at one point in time • When prevalence is calculated for the group with the exposure, the next question is “compared to what? ” • The “compared to what” consists of prevalence for the unexposed comparison group • Dividing one prevalence by the other produces the prevalence ratio; it tells us if/how the exposure and outcome are associated • Because exposure and outcome are measured at the same point in time, it is usually not possible to determine the time order of the exposure and the outcome (which came first) and as such, the association may not be interpretable Lesson 2 -2: Cross-Sectional Studies 35
Optional session to explore how a real study is reported (the CHIS example) Lesson 2 -2: Cross-Sectional Studies 36
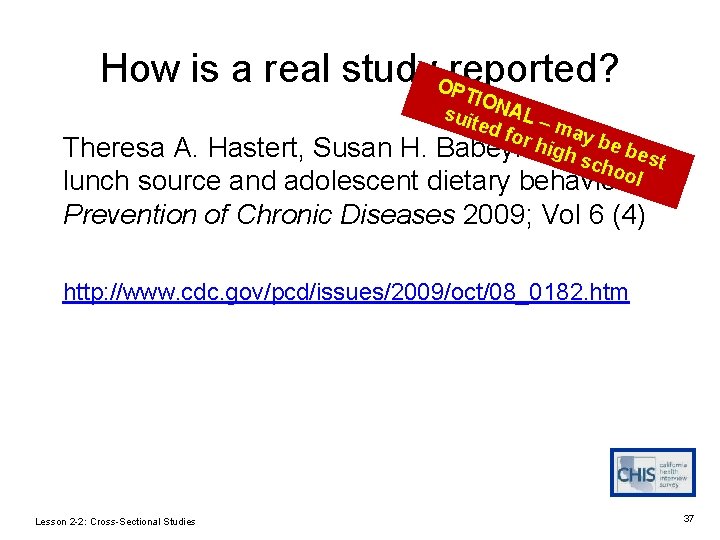
How is a real study reported? OPT IO suit NAL – m ed f or h ay be igh Theresa A. Hastert, Susan H. Babey. School sch best ool lunch source and adolescent dietary behavior. Prevention of Chronic Diseases 2009; Vol 6 (4) http: //www. cdc. gov/pcd/issues/2009/oct/08_0182. htm Lesson 2 -2: Cross-Sectional Studies 37
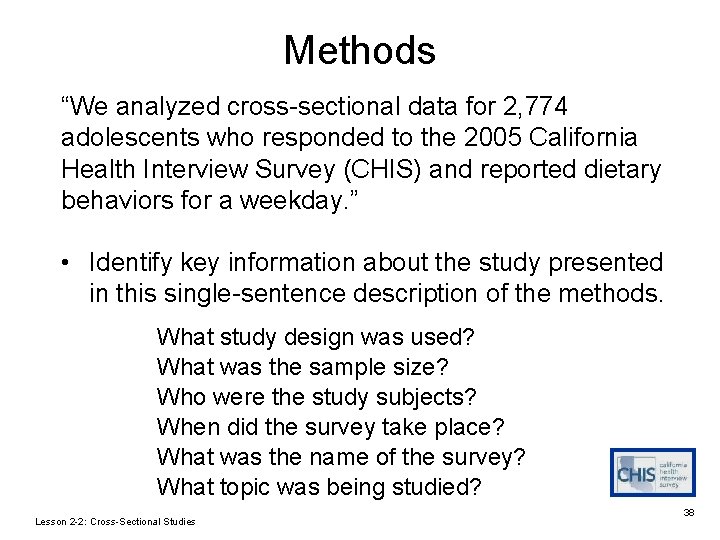
Methods “We analyzed cross-sectional data for 2, 774 adolescents who responded to the 2005 California Health Interview Survey (CHIS) and reported dietary behaviors for a weekday. ” • Identify key information about the study presented in this single-sentence description of the methods. What study design was used? What was the sample size? Who were the study subjects? When did the survey take place? What was the name of the survey? What topic was being studied? Lesson 2 -2: Cross-Sectional Studies 38
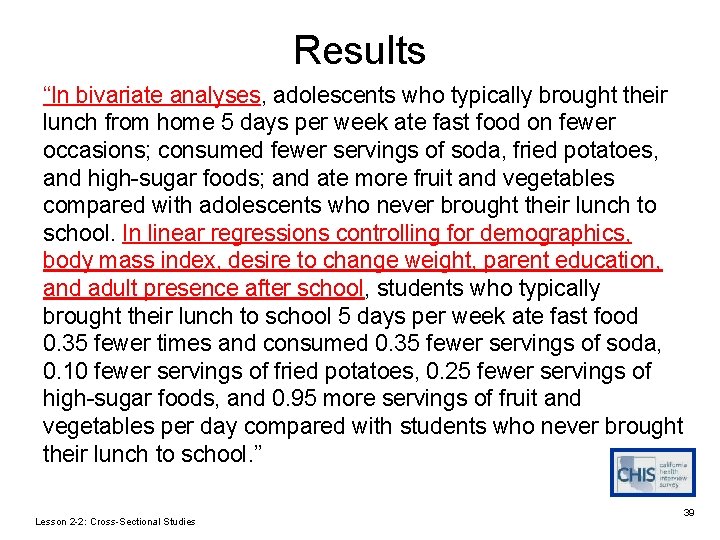
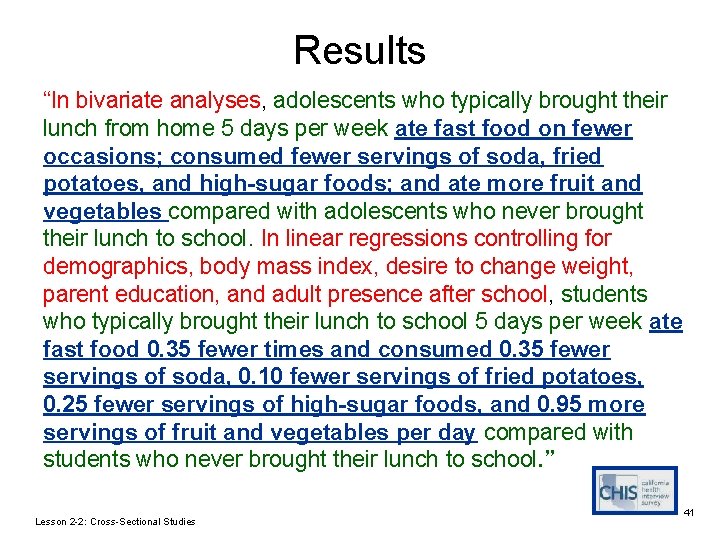
Results “In bivariate analyses, adolescents who typically brought their lunch from home 5 days per week ate fast food on fewer occasions; consumed fewer servings of soda, fried potatoes, and high-sugar foods; and ate more fruit and vegetables compared with adolescents who never brought their lunch to school. In linear regressions controlling for demographics, body mass index, desire to change weight, parent education, and adult presence after school, students who typically brought their lunch to school 5 days per week ate fast food 0. 35 fewer times and consumed 0. 35 fewer servings of soda, 0. 10 fewer servings of fried potatoes, 0. 25 fewer servings of high-sugar foods, and 0. 95 more servings of fruit and vegetables per day compared with students who never brought their lunch to school. ” Lesson 2 -2: Cross-Sectional Studies 39
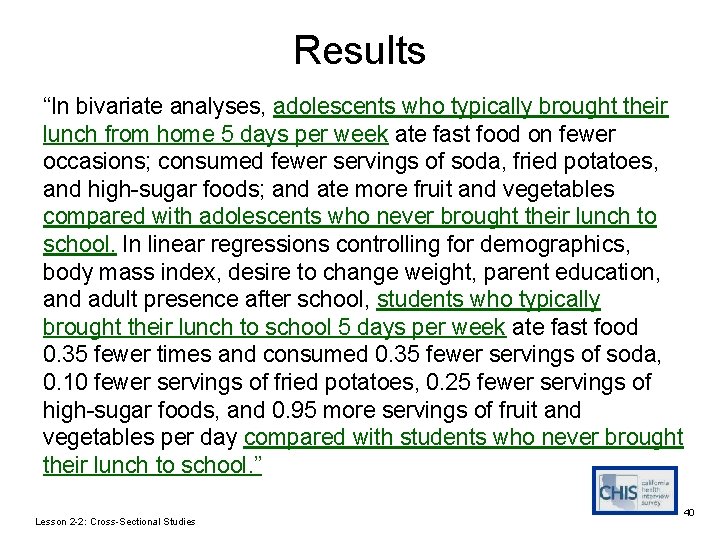
Results “In bivariate analyses, adolescents who typically brought their lunch from home 5 days per week ate fast food on fewer occasions; consumed fewer servings of soda, fried potatoes, and high-sugar foods; and ate more fruit and vegetables compared with adolescents who never brought their lunch to school. In linear regressions controlling for demographics, body mass index, desire to change weight, parent education, and adult presence after school, students who typically brought their lunch to school 5 days per week ate fast food 0. 35 fewer times and consumed 0. 35 fewer servings of soda, 0. 10 fewer servings of fried potatoes, 0. 25 fewer servings of high-sugar foods, and 0. 95 more servings of fruit and vegetables per day compared with students who never brought their lunch to school. ” Lesson 2 -2: Cross-Sectional Studies 40
Results “In bivariate analyses, adolescents who typically brought their lunch from home 5 days per week ate fast food on fewer occasions; consumed fewer servings of soda, fried potatoes, and high-sugar foods; and ate more fruit and vegetables compared with adolescents who never brought their lunch to school. In linear regressions controlling for demographics, body mass index, desire to change weight, parent education, and adult presence after school, students who typically brought their lunch to school 5 days per week ate fast food 0. 35 fewer times and consumed 0. 35 fewer servings of soda, 0. 10 fewer servings of fried potatoes, 0. 25 fewer servings of high-sugar foods, and 0. 95 more servings of fruit and vegetables per day compared with students who never brought their lunch to school. ” Lesson 2 -2: Cross-Sectional Studies 41
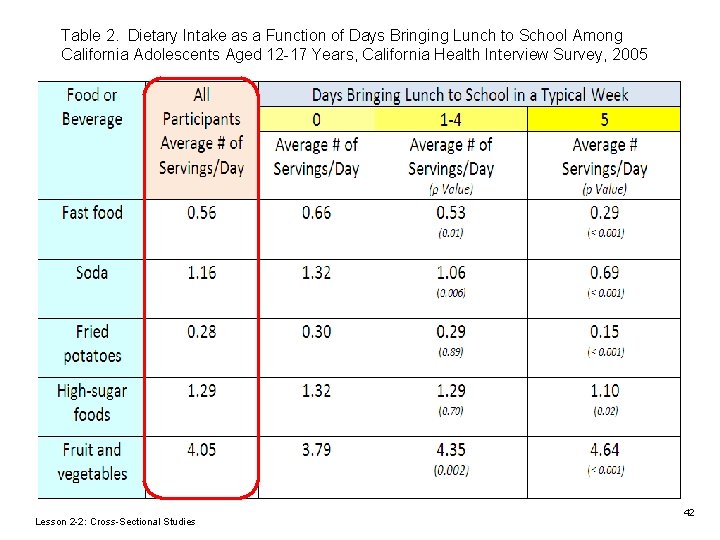
Table 2. Dietary Intake as a Function of Days Bringing Lunch to School Among California Adolescents Aged 12 -17 Years, California Health Interview Survey, 2005 Lesson 2 -2: Cross-Sectional Studies 42
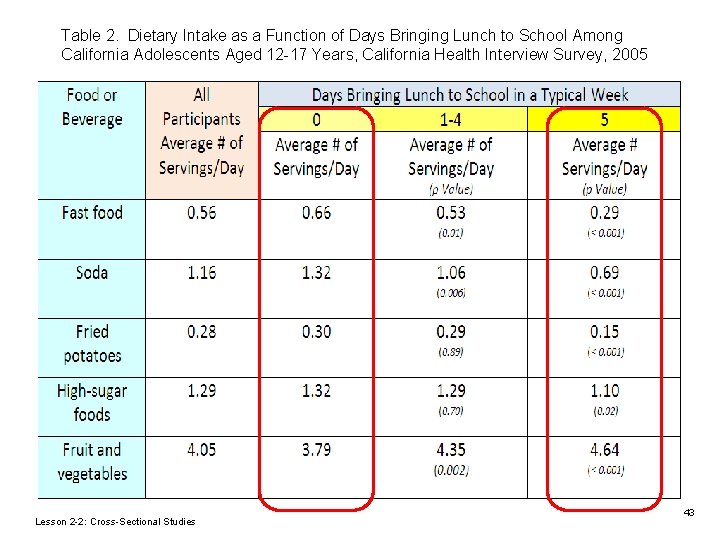
Table 2. Dietary Intake as a Function of Days Bringing Lunch to School Among California Adolescents Aged 12 -17 Years, California Health Interview Survey, 2005 Lesson 2 -2: Cross-Sectional Studies 43
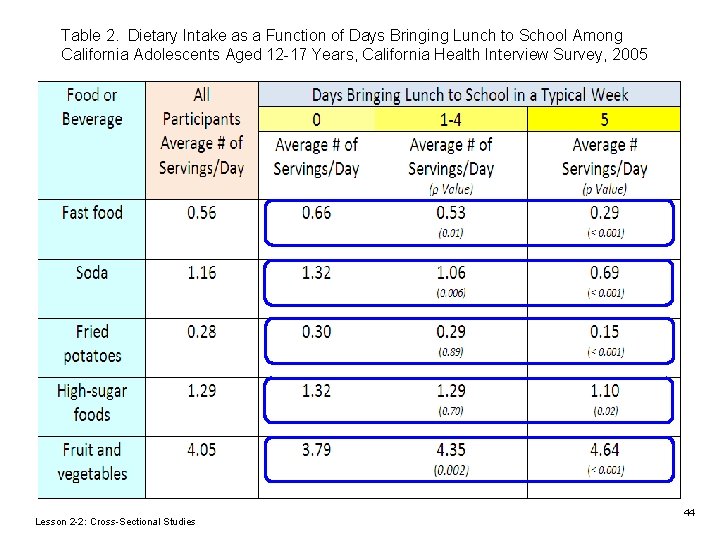
Table 2. Dietary Intake as a Function of Days Bringing Lunch to School Among California Adolescents Aged 12 -17 Years, California Health Interview Survey, 2005 Lesson 2 -2: Cross-Sectional Studies 44