Superhot pixels hot pixels and DSNU on Hawaii2


- Slides: 21
Super-hot pixels, hot pixels and DSNU on Hawaii-2 RG detector Crouzet Pierre-Elie, Jerome Caron, Thibault Viale
Outlines – Context – Test set up – H 2 RG cosmetic at low temperature (82 K-145 K) – – Hot pixel evolution with temperature – DSNU with exposure time H 2 RG cosmetic at high temperature (150 K-170 K) – Switching pixel – Super hot pixel
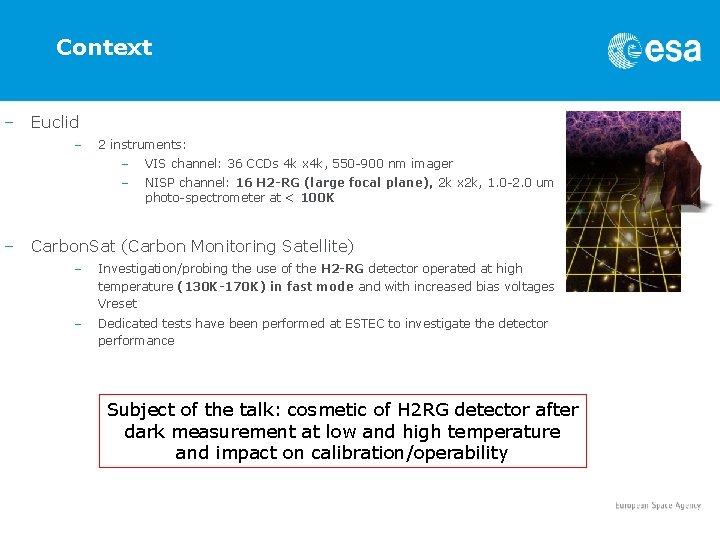
Context – Euclid – 2 instruments: – – – VIS channel: 36 CCDs 4 k x 4 k, 550 -900 nm imager NISP channel: 16 H 2 -RG (large focal plane), 2 k x 2 k, 1. 0 -2. 0 um photo-spectrometer at < 100 K Carbon. Sat (Carbon Monitoring Satellite) – Investigation/probing the use of the H 2 -RG detector operated at high temperature (130 K-170 K) in fast mode and with increased bias voltages Vreset – Dedicated tests have been performed at ESTEC to investigate the detector performance Subject of the talk: cosmetic of H 2 RG detector after dark measurement at low and high temperature and impact on calibration/operability
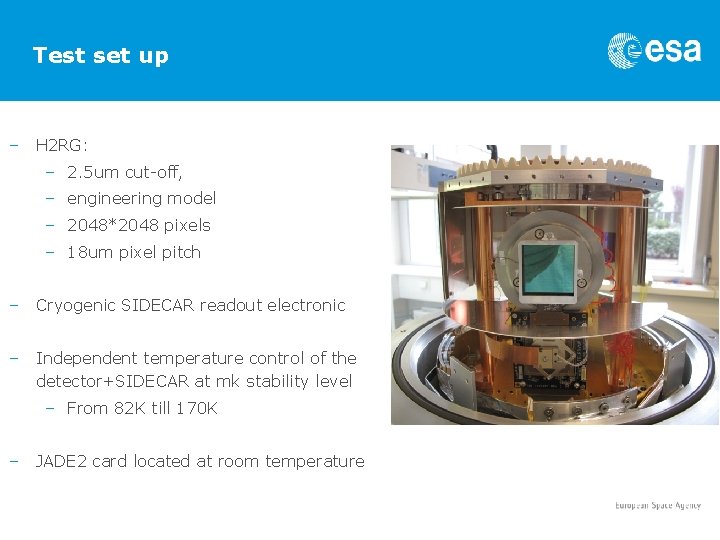
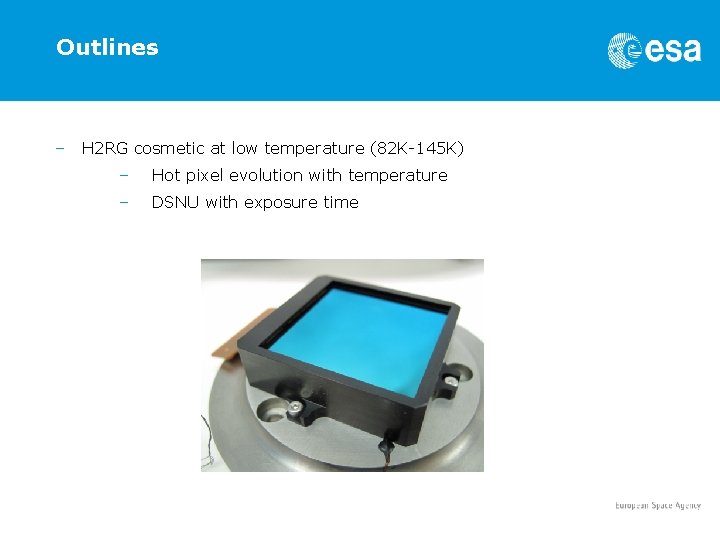
Test set up – H 2 RG: – 2. 5 um cut-off, – engineering model – 2048*2048 pixels – 18 um pixel pitch – Cryogenic SIDECAR readout electronic – Independent temperature control of the detector+SIDECAR at mk stability level – From 82 K till 170 K – JADE 2 card located at room temperature
Outlines – H 2 RG cosmetic at low temperature (82 K-145 K) – Hot pixel evolution with temperature – DSNU with exposure time
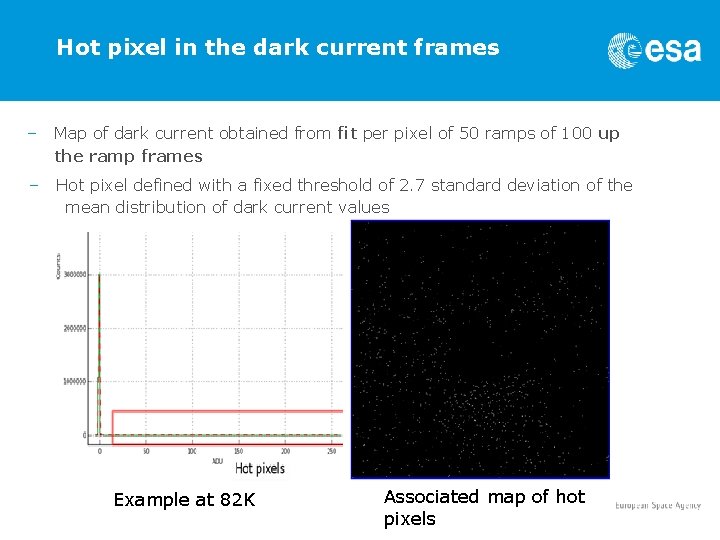
Hot pixel in the dark current frames – Map of dark current obtained from fit per pixel of 50 ramps of 100 up the ramp frames – Hot pixel defined with a fixed threshold of 2. 7 standard deviation of the mean distribution of dark current values Example at 82 K Associated map of hot pixels
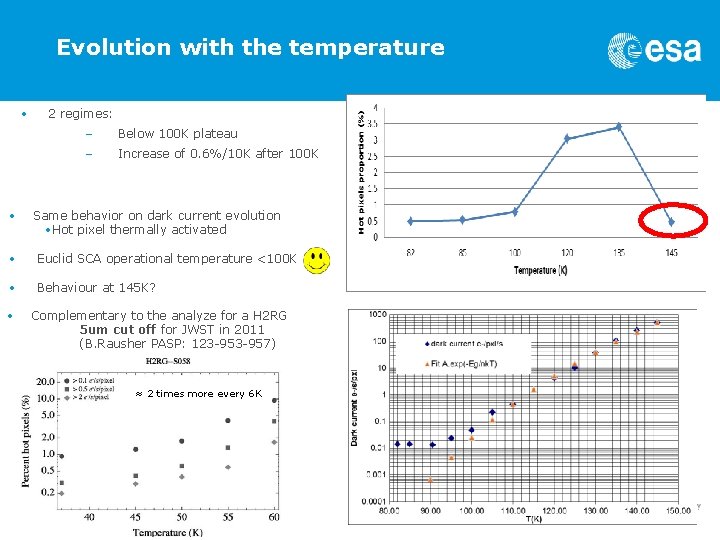
Evolution with the temperature • • 2 regimes: – Below 100 K plateau – Increase of 0. 6%/10 K after 100 K Same behavior on dark current evolution • Hot pixel thermally activated • Euclid SCA operational temperature <100 K • Behaviour at 145 K? • Complementary to the analyze for a H 2 RG 5 um cut off for JWST in 2011 (B. Rausher PASP: 123 -957) ≈ 2 times more every 6 K
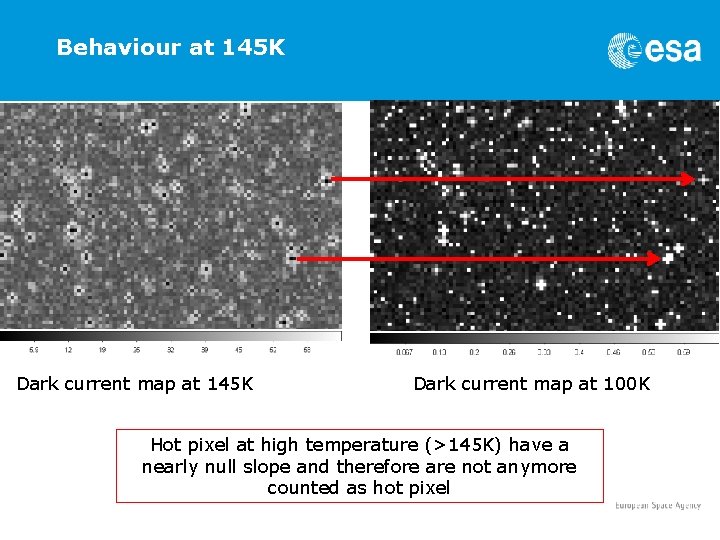
Behaviour at 145 K Dark current map at 100 K Hot pixel at high temperature (>145 K) have a nearly null slope and therefore are not anymore counted as hot pixel
Summary – Hot pixel thermally activated after 100 K – Euclid H 2 RG operational temperature <100 K – – The lowest proportion of hot pixel better for calibration and operability for science Behavior at 145 K only due to hot pixel seen as dead/bad pixels
DSNU with exposure time
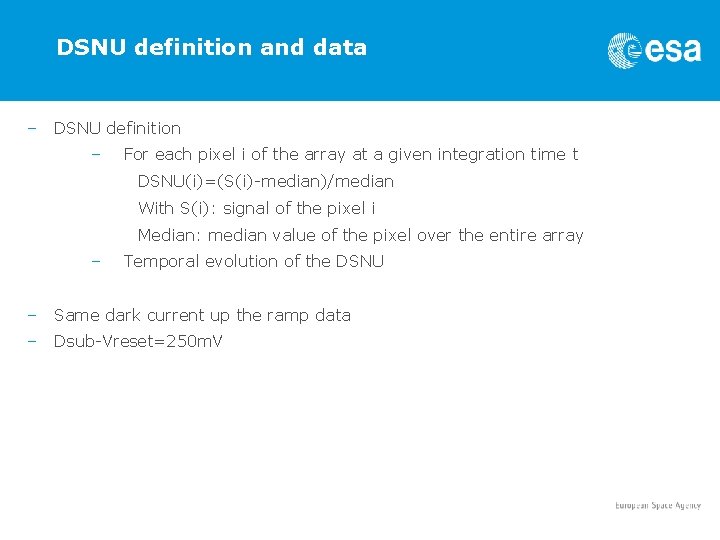
DSNU definition and data – DSNU definition – For each pixel i of the array at a given integration time t DSNU(i)=(S(i)-median)/median With S(i): signal of the pixel i Median: median value of the pixel over the entire array – Temporal evolution of the DSNU – Same dark current up the ramp data – Dsub-Vreset=250 m. V
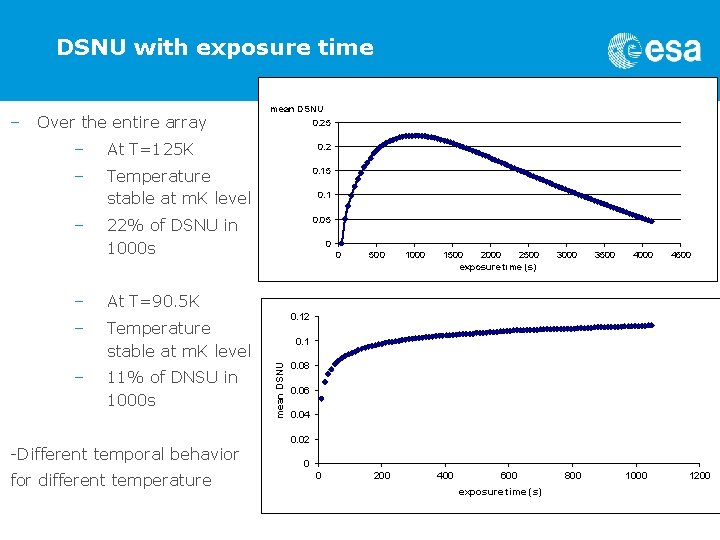
DSNU with exposure time Over the entire array 0. 25 – At T=125 K – Temperature stable at m. K level 0. 15 22% of DSNU in 1000 s 0. 05 – – At T=90. 5 K – Temperature stable at m. K level – 11% of DNSU in 1000 s -Different temporal behavior for different temperature 0. 2 0. 1 0 0 500 1000 1500 2000 2500 exposure time (s) 3000 3500 4000 4500 0. 12 0. 1 mean DSNU – mean DSNU 0. 08 0. 06 0. 04 0. 02 0 0 200 400 600 exposure time (s) 800 1000 1200
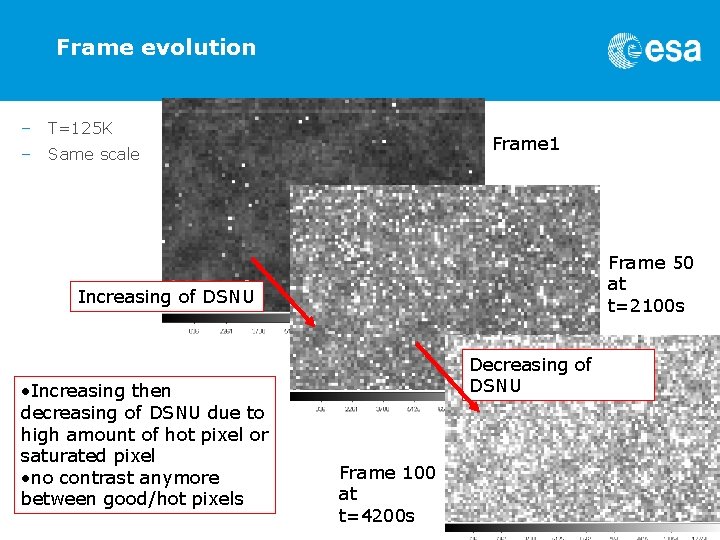
Frame evolution – T=125 K – Same scale Frame 1 Frame 50 at t=2100 s Increasing of DSNU • Increasing then decreasing of DSNU due to high amount of hot pixel or saturated pixel • no contrast anymore between good/hot pixels Decreasing of DSNU Frame 100 at t=4200 s
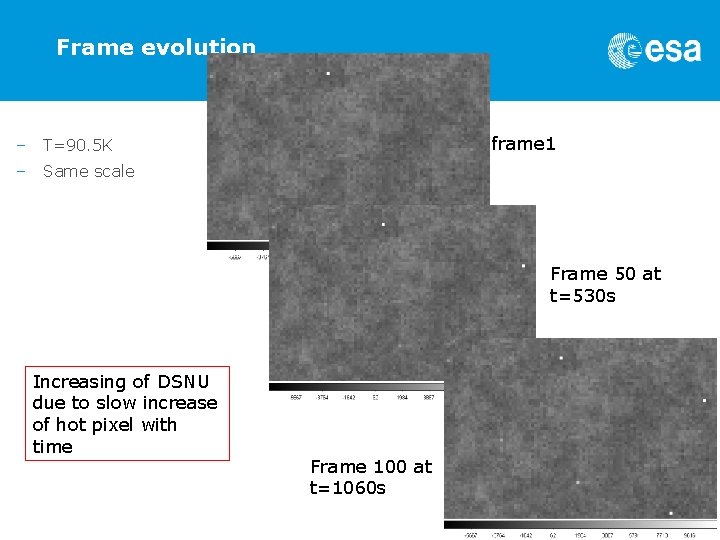
Frame evolution – T=90. 5 K – Same scale frame 1 Frame 50 at t=530 s Increasing of DSNU due to slow increase of hot pixel with time Frame 100 at t=1060 s
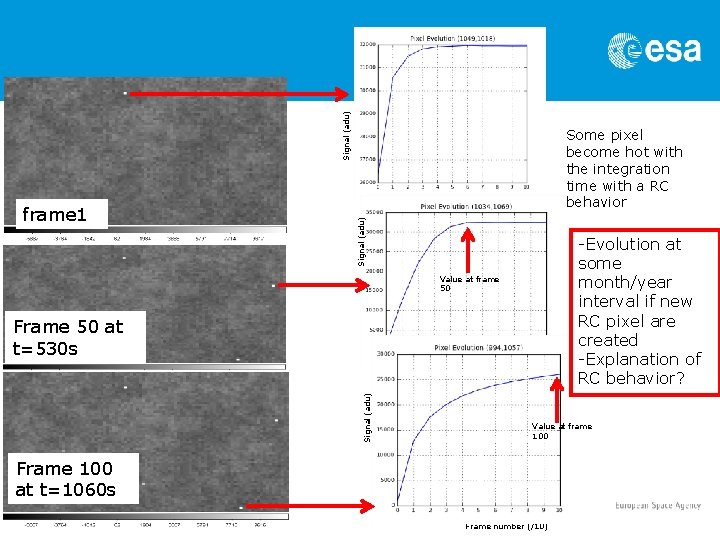
Signal (adu) frame 1 Some pixel become hot with the integration time with a RC behavior -Evolution at some month/year interval if new RC pixel are created -Explanation of RC behavior? Value at frame 50 Signal (adu) Frame 50 at t=530 s Value at frame 100 Frame 100 at t=1060 s Frame number (/10)
Outlines and data – – H 2 RG cosmetic at high temperature (150 K-170 K) – Switching pixel – Super hot pixel Data recorded at 5 Mhz with the JADE 2 card – Integrating down (adu decrease with signal)
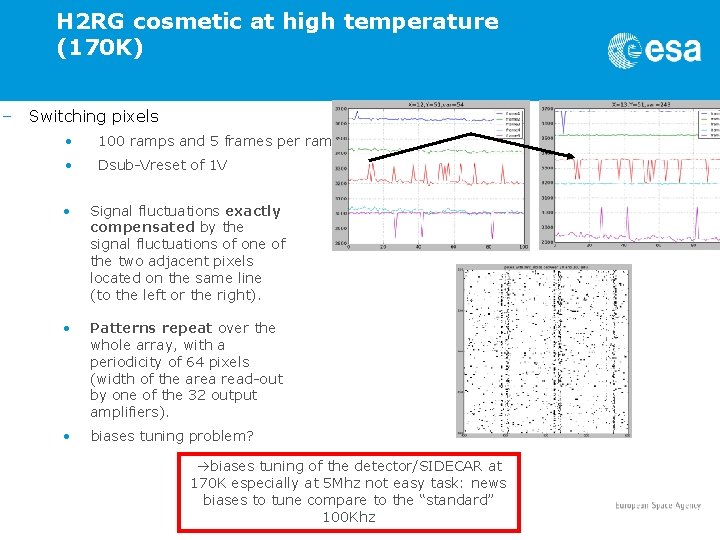
H 2 RG cosmetic at high temperature (170 K) – Switching pixels • 100 ramps and 5 frames per ramp • Dsub-Vreset of 1 V • Signal fluctuations exactly compensated by the signal fluctuations of one of the two adjacent pixels located on the same line (to the left or the right). • Patterns repeat over the whole array, with a periodicity of 64 pixels (width of the area read-out by one of the 32 output amplifiers). • biases tuning problem? biases tuning of the detector/SIDECAR at 170 K especially at 5 Mhz not easy task: news biases to tune compare to the “standard” 100 Khz
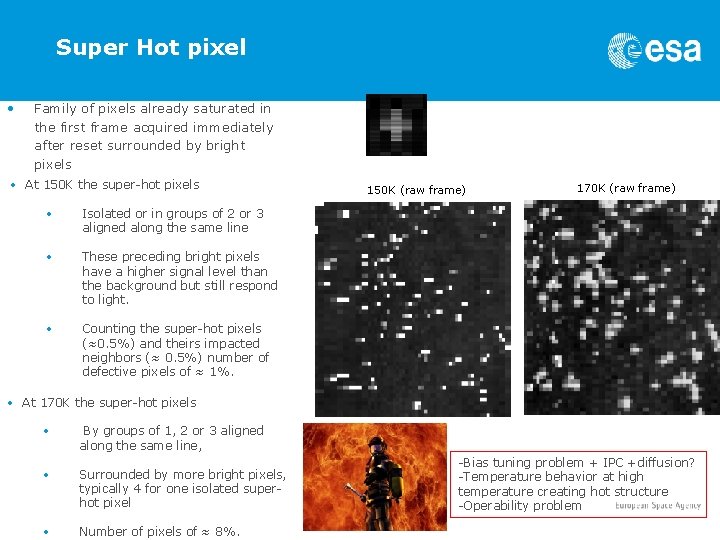
Super Hot pixel • Family of pixels already saturated in the first frame acquired immediately after reset surrounded by bright pixels • At 150 K the super-hot pixels • Isolated or in groups of 2 or 3 aligned along the same line • These preceding bright pixels have a higher signal level than the background but still respond to light. • Counting the super-hot pixels (≈0. 5%) and theirs impacted neighbors (≈ 0. 5%) number of defective pixels of ≈ 1%. 150 K (raw frame) 170 K (raw frame) • At 170 K the super-hot pixels • By groups of 1, 2 or 3 aligned along the same line, • Surrounded by more bright pixels, typically 4 for one isolated superhot pixel • Number of pixels of ≈ 8%. -Bias tuning problem + IPC +diffusion? -Temperature behavior at high temperature creating hot structure -Operability problem
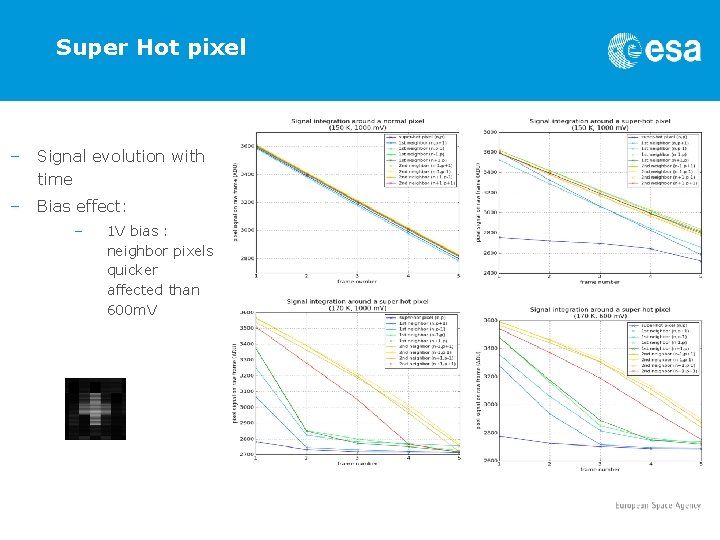
Super Hot pixel – Signal evolution with time – Bias effect: – 1 V bias : neighbor pixels quicker affected than 600 m. V
Conclusion – In the context of the Euclid and Carbon. Sat tests from 82 K till 170 K on the HAWAII-2 RG detector have been performed. – The hot pixel evolution with the temperature suggest hot pixel thermally activated. Temperature <100 K better for calibration and science for Euclid – DSNU evolution with the exposure time shows RC pixel behaviour which need to be explained – At high temperature (150 K-170 K) the detector exhibits: – Switching pixels – Super-hot pixels The behaviour of the H 2 RG detector at high temperature (>150 K) needs to be more understood and biases properly
Super Hot pixel – Temporal evolution 150 K 170 K Signal decrease that is almost two times larger than the normal response. The additional signal could be interpreted as coming from excess electrons flowing from the central super-hot pixel.