Sum of serum n3 fatty acids value might

 affiliated by WHO,")


 loss between BW")
")


- Slides: 15
Sum of serum n-3 fatty acids value might be correlated with residual living days in older adult patients with gastro-intestinal cancer Moeko Kitagawa 1, RD, Seiji Haji 2, MD, Ph. D, Teruyoshi Amagai 1, MD, Ph. D 1: Department of Food Sciences and Nutrition, School of Environmental Sciences, Mukogawa Women’s University 2: Department of General Surgery, Takatsuki Hospital, Osaka
Background According to the International Agency for Research on Cancer (IARC) affiliated by WHO, patients newly diagnosed cancer in 2012 were reached to 14 million people. This number is expected to increase up to 22 million people In the next 20 years. However, the nutritional management of cancer patients has not been studied to have an impact on their survival.
• If the weight loss is affecting survival days, weight loss prevention and extending survival days can be expected with evidence-based nutritional support. • We, therefore, focused on changes of serum fatty acid in patients with cancer. • Furthermore, we would analyzed that Alb, and CRP as dailybased parameters, could be utilized for predictor for survival in patients with advanced GI-cancers.
Aim To investigate relationships among p Serum fatty acids / amino acids concentrations p Alb and CRP p Survival rate between subjects with and without weight loss during study period
Method Figure 1. Flow chart
a Liver dysfunction:each of AST,ALT,T-Bil > 1. 5 upper limit of normal range b Renal dysfunction:S-creatinine > 1. 5 upper limit of normal range
c Weight loss was defined 5% or more body weight (BW) loss between BW before operation.
Results Table 1. Subject characteristics Median (25%ile, 75%ile)
Method 1 Comparing individual data between two groups Table 2. Comparison result It was performed using Mann–Whitney test.
Method 2. Survival curve Survival function Cumulative survival P=0. 319 Without Weight lossweight absence loss presence With weight Figure 2. Survival curve Survival days loss
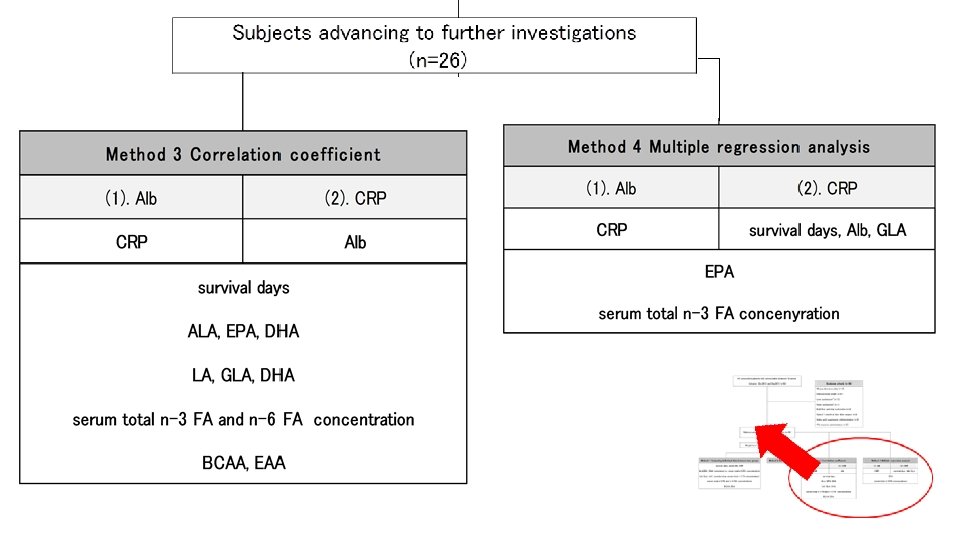
Method 3. Correlation coefficient Table 3. Factors relate with Alb Table 4. Factors relate with CRP
Method 4. Multiple regression analysis Table 4. Multiple regression analysis of Alb Table 5. Multiple regression analysis of CRP
Limitations • Retrospective study might produce non-randomized subjects’ bias • Subjects’ number must be too small to draw the definitive conclusion • It is not known whether causation or association that the decrease of serum n-3 fatty acids concentration and inflammation shown by CRP and hypoalbuminemia. Further investigation is needed.
Conclusion This study could show that 1. An inverse correlation between serum n-3 fatty acids concentration and CRP in patients with advanced GIcancers 2. Serum n-3 fatty acids concentration might be a predictor of survival in these patients