Statistical Fundamentals Using Microsoft Excel for Univariate and
- Slides: 9
Statistical Fundamentals: Using Microsoft Excel for Univariate and Bivariate Analysis Alfred P. Rovai One-Sample t-Test Power. Point Prepared by Alfred P. Rovai Microsoft® Excel® Screen Prints Courtesy of Microsoft Corporation. Presentation © 2013 by Alfred P. Rovai
One-Sample t-Test • The One-Sample t-Test, also known as the Single-Sample t. Test, is a parametric procedure that compares a calculated sample mean to a known population mean or a previously reported value in order to determine if the difference is statistically significant. For example, an educational researcher might want to determine if the mean sense of classroom community score among university students enrolled in fully online programs differs significantly from the hypothesized population score of 30. • Excel data entry for the one-Sample t-Test is accomplished by entering the value for each case in a single column of an Excel spreadsheet. Copyright 2013 by Alfred P. Rovai
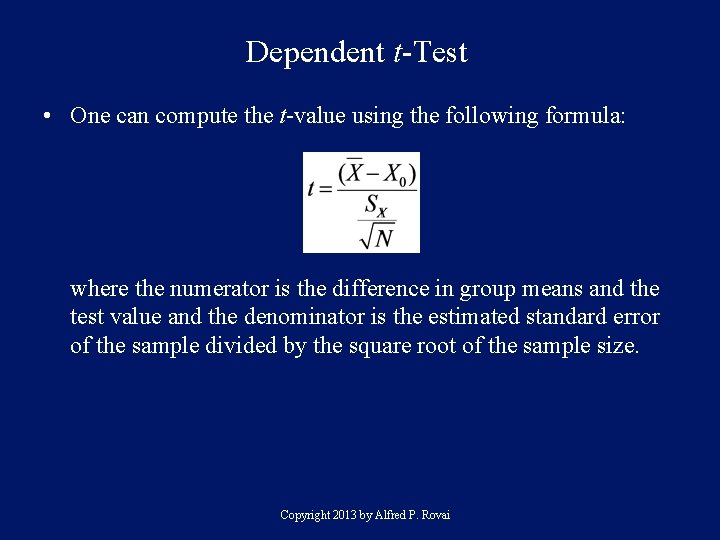
Dependent t-Test • One can compute the t-value using the following formula: where the numerator is the difference in group means and the test value and the denominator is the estimated standard error of the sample divided by the square root of the sample size. Copyright 2013 by Alfred P. Rovai
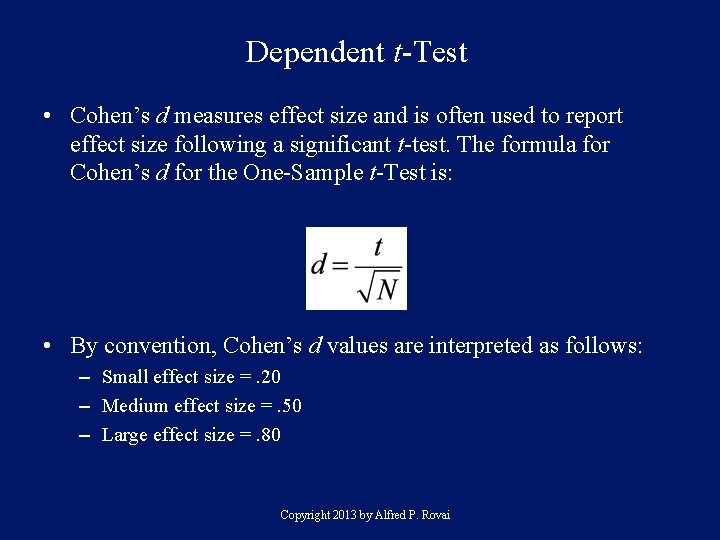
Dependent t-Test • Cohen’s d measures effect size and is often used to report effect size following a significant t-test. The formula for Cohen’s d for the One-Sample t-Test is: • By convention, Cohen’s d values are interpreted as follows: – Small effect size =. 20 – Medium effect size =. 50 – Large effect size =. 80 Copyright 2013 by Alfred P. Rovai
Key Assumptions & Requirements • Random selection of samples to allow for generalization of results to a target population. • Variables. One continuous DV measured on the interval or ratio scale. • Independence of observations (i. e. , measurements) are not acted on by an outside influence common to two or more measurements. • Normality. One DV normally distributed. • Sample size. The One-Sample t-Test is robust to minor violations of the assumption of normally distributed data with sample sizes > 30. Copyright 2013 by Alfred P. Rovai
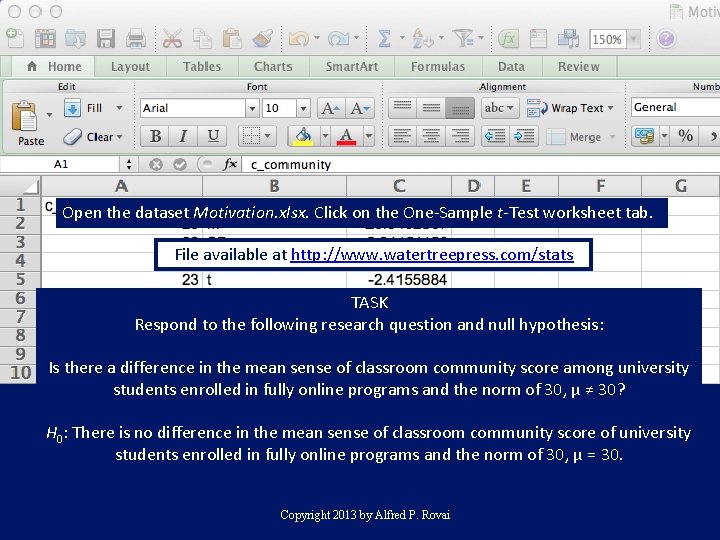
Open the dataset Motivation. xlsx. Click on the One-Sample t-Test worksheet tab. File available at http: //www. watertreepress. com/stats TASK Respond to the following research question and null hypothesis: Is there a difference in the mean sense of classroom community score among university students enrolled in fully online programs and the norm of 30, μ ≠ 30? H 0: There is no difference in the mean sense of classroom community score of university students enrolled in fully online programs and the norm of 30, μ = 30. Copyright 2013 by Alfred P. Rovai
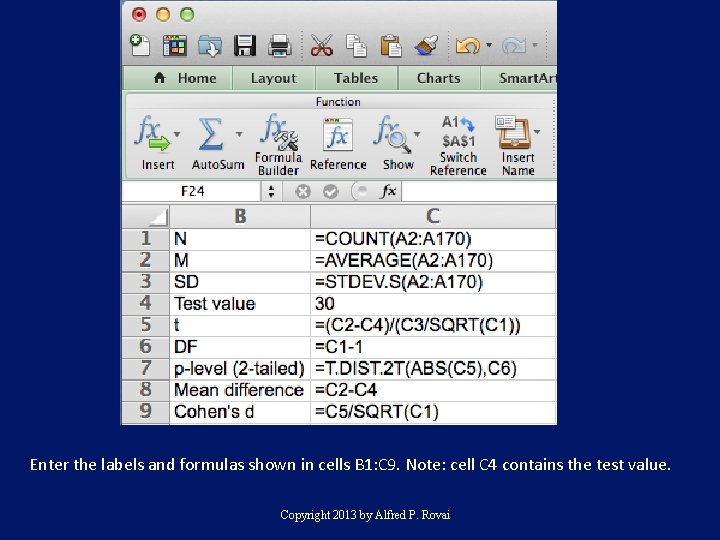
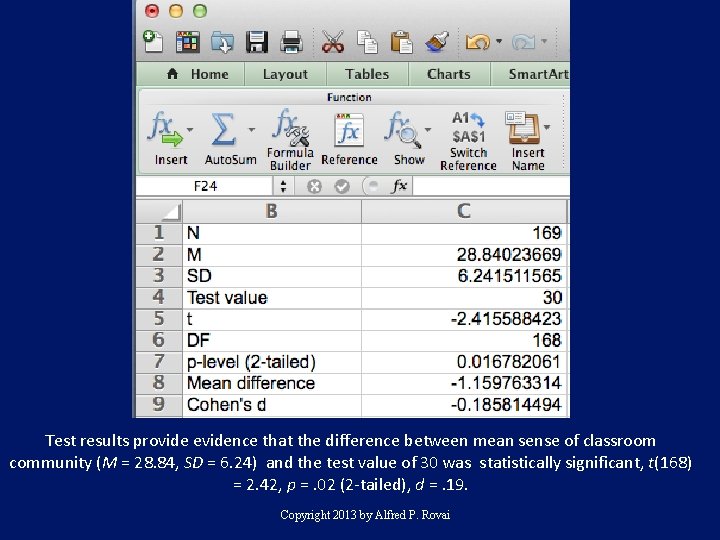
Enter the labels and formulas shown in cells B 1: C 9. Note: cell C 4 contains the test value. Copyright 2013 by Alfred P. Rovai
Test results provide evidence that the difference between mean sense of classroom community (M = 28. 84, SD = 6. 24) and the test value of 30 was statistically significant, t(168) = 2. 42, p =. 02 (2 -tailed), d =. 19. Copyright 2013 by Alfred P. Rovai
Dependent t-Test End of Presentation Copyright 2013 by Alfred P. Rovai