Sta 220 Statistics Mr Smith Room 310 Class

- Slides: 35
Sta 220 - Statistics Mr. Smith Room 310 Class #19
Section 6 -3 and 6 -4 Notes
6 -3: Test of Hypothesis about a Population Mean: Normal (z) Statistic
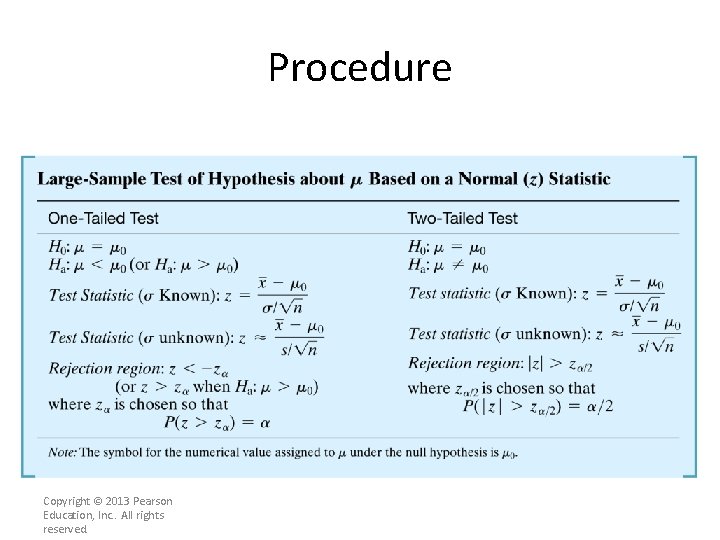
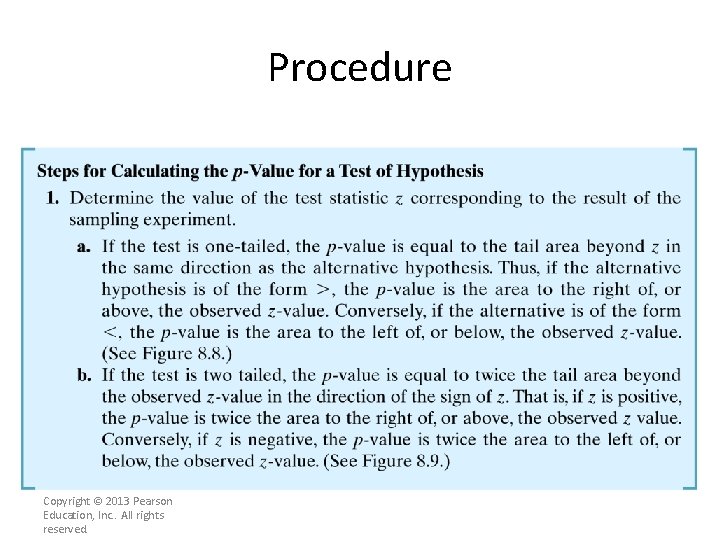
Procedure Copyright © 2013 Pearson Education, Inc. . All rights reserved.
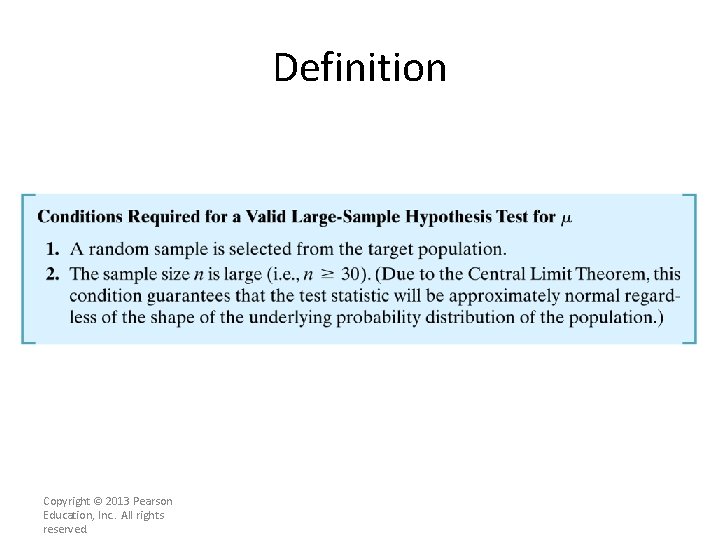
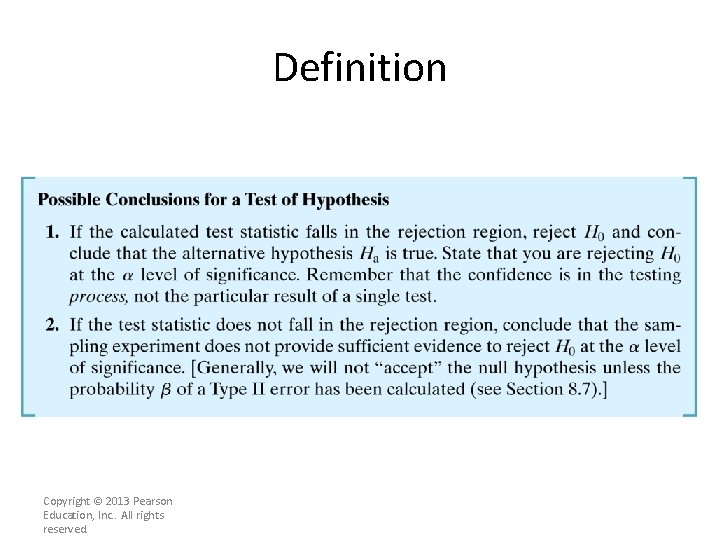
Definition Copyright © 2013 Pearson Education, Inc. . All rights reserved.
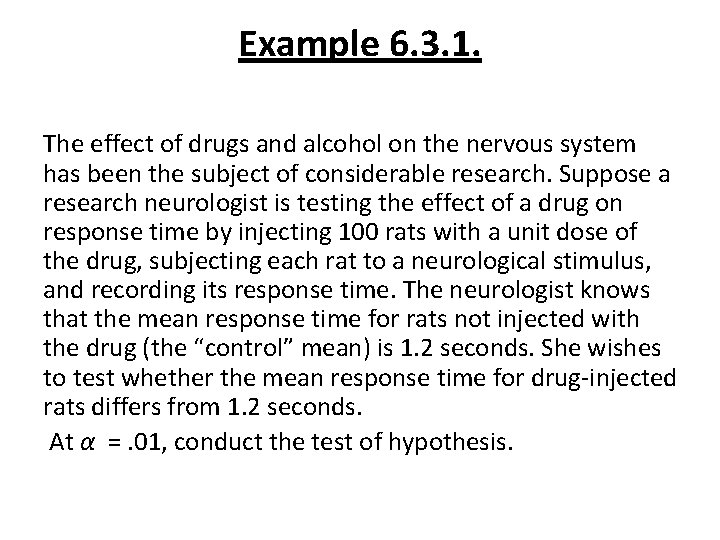
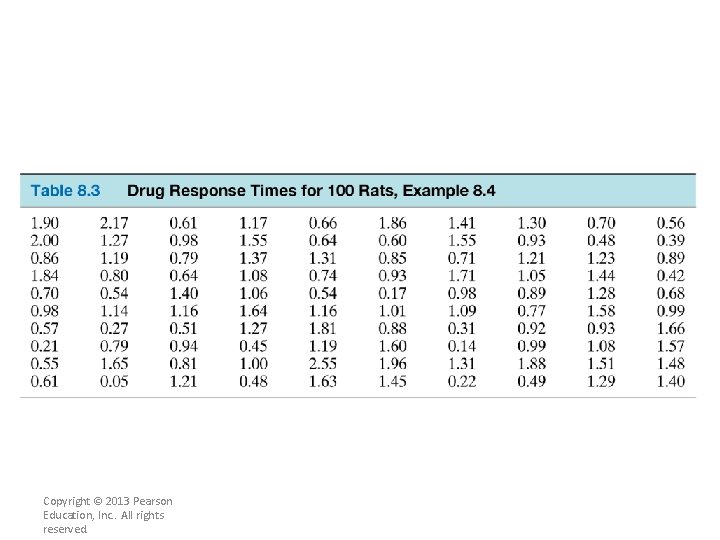
Example 6. 3. 1. The effect of drugs and alcohol on the nervous system has been the subject of considerable research. Suppose a research neurologist is testing the effect of a drug on response time by injecting 100 rats with a unit dose of the drug, subjecting each rat to a neurological stimulus, and recording its response time. The neurologist knows that the mean response time for rats not injected with the drug (the “control” mean) is 1. 2 seconds. She wishes to test whether the mean response time for drug-injected rats differs from 1. 2 seconds. At α =. 01, conduct the test of hypothesis.
Copyright © 2013 Pearson Education, Inc. . All rights reserved.
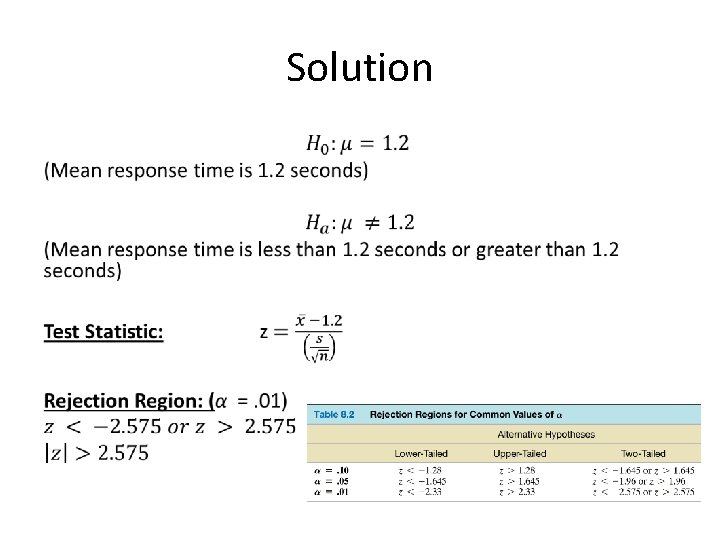
Solution •
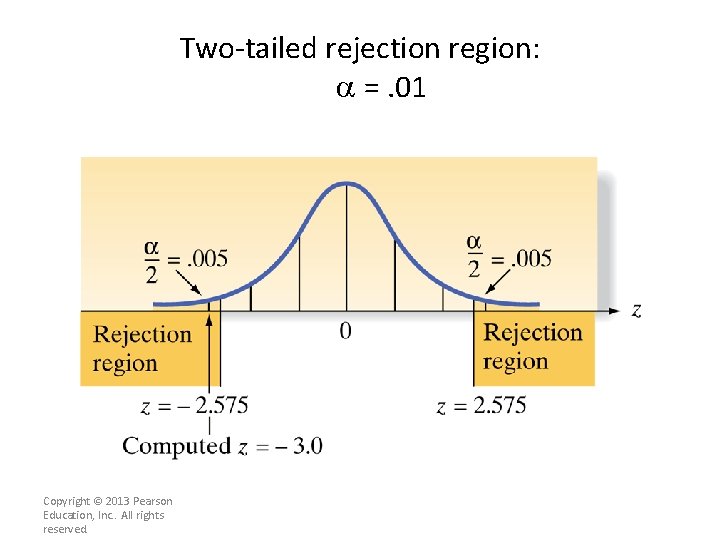
Two-tailed rejection region: a =. 01 Copyright © 2013 Pearson Education, Inc. . All rights reserved.
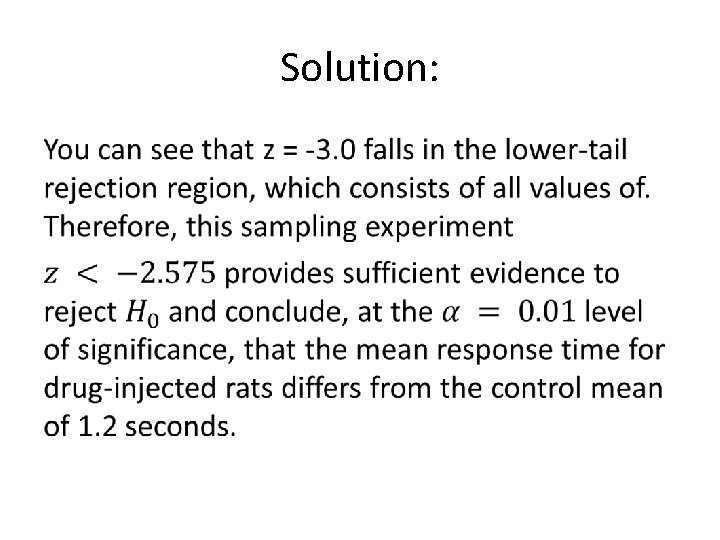
Solution: •
Definition Copyright © 2013 Pearson Education, Inc. . All rights reserved.
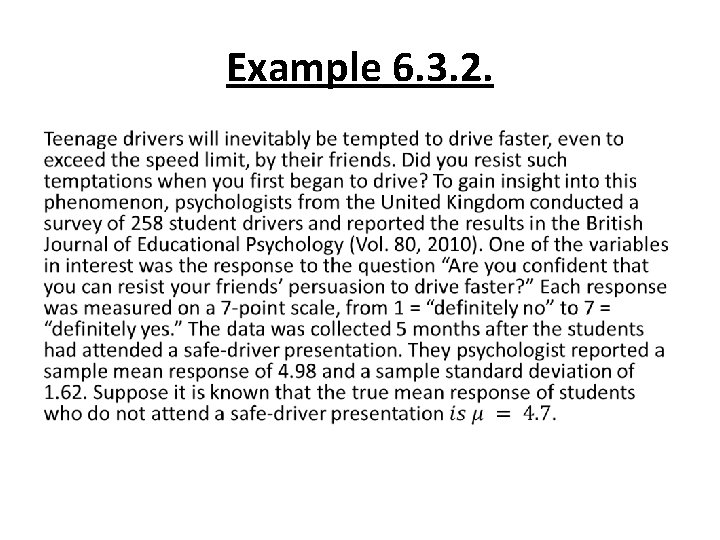
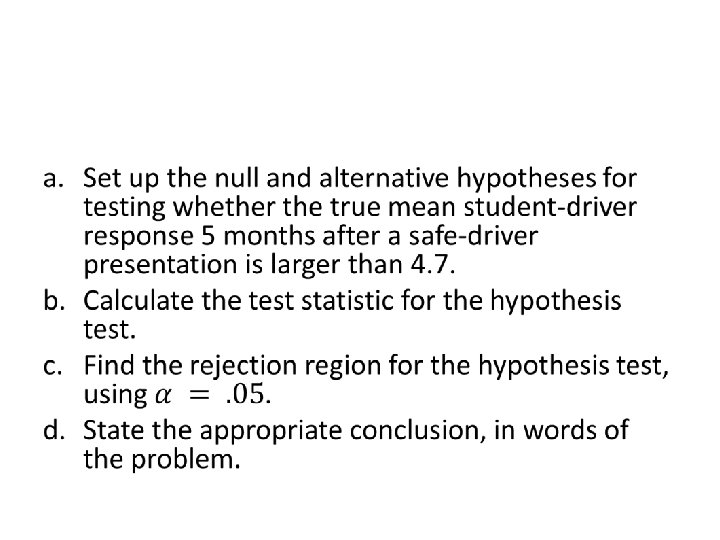
Example 6. 3. 2. •
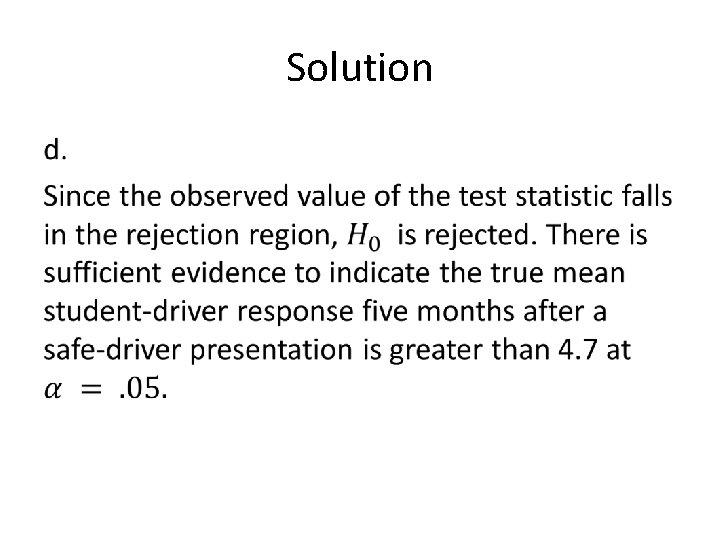
Solution •
6. 4: Observed Significance Levels: p-Values
Copyright © 2013 Pearson Education, Inc. . All rights reserved.
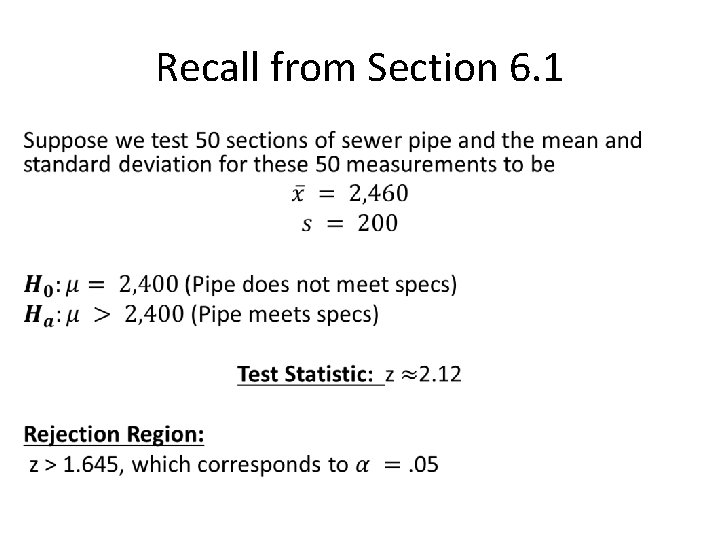
Recall from Section 6. 1 •
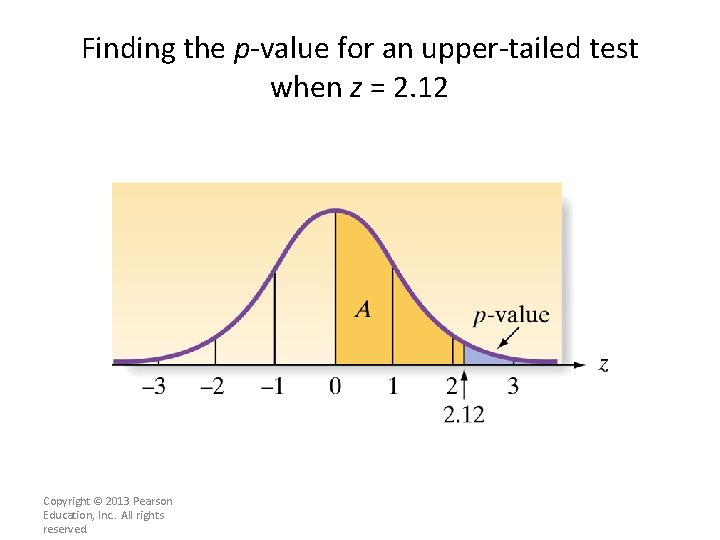
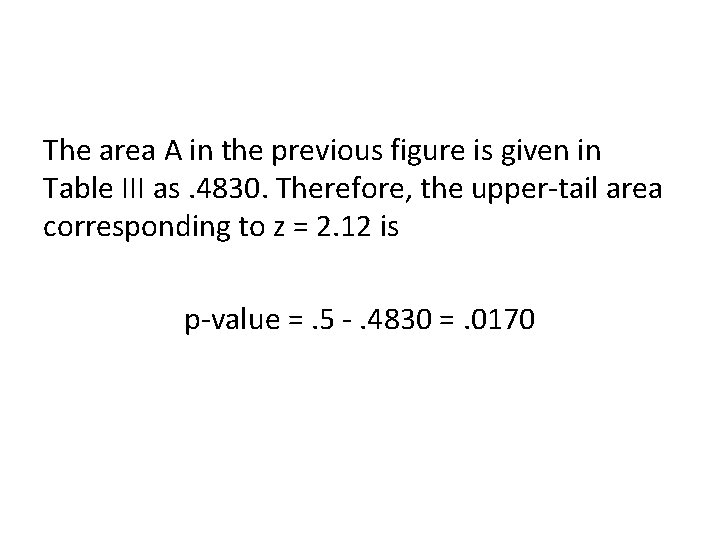
Finding the p-value for an upper-tailed test when z = 2. 12 Copyright © 2013 Pearson Education, Inc. . All rights reserved.
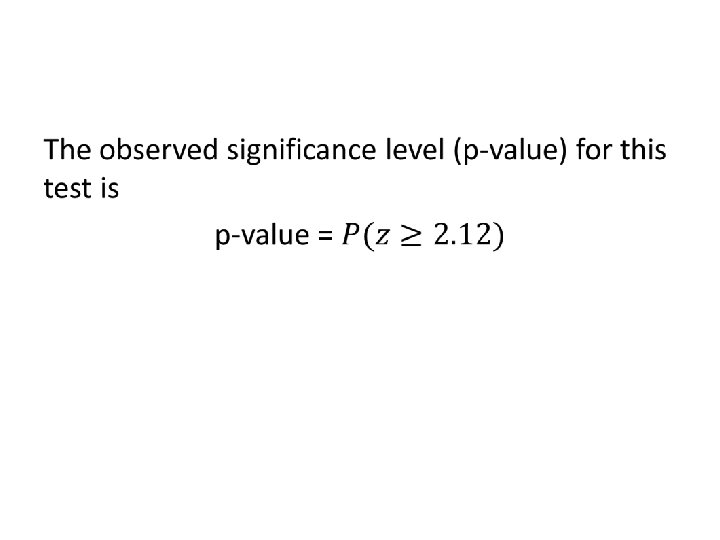
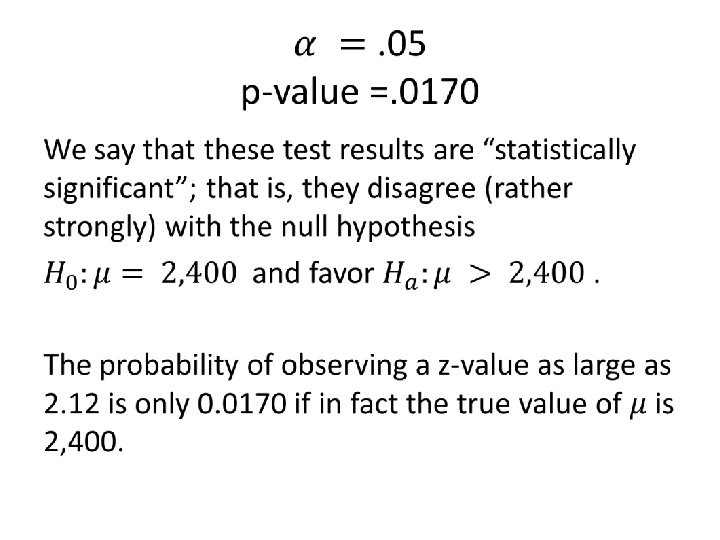
The area A in the previous figure is given in Table III as. 4830. Therefore, the upper-tail area corresponding to z = 2. 12 is p-value =. 5 -. 4830 =. 0170
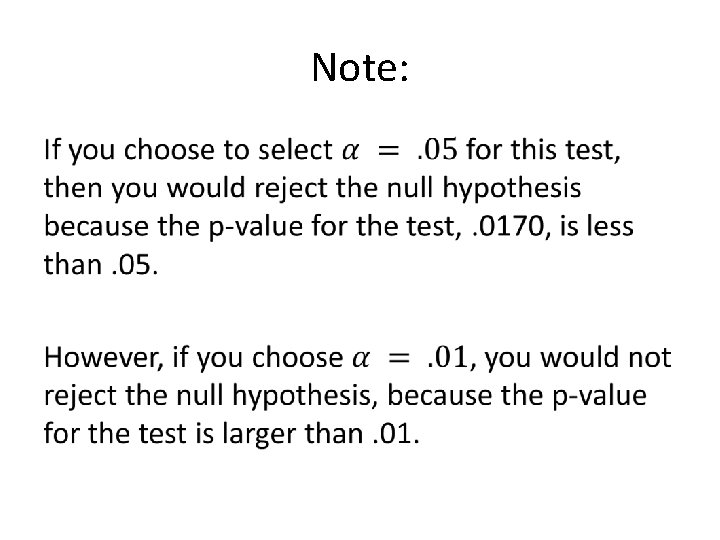
Note: •
Procedure Copyright © 2013 Pearson Education, Inc. . All rights reserved.
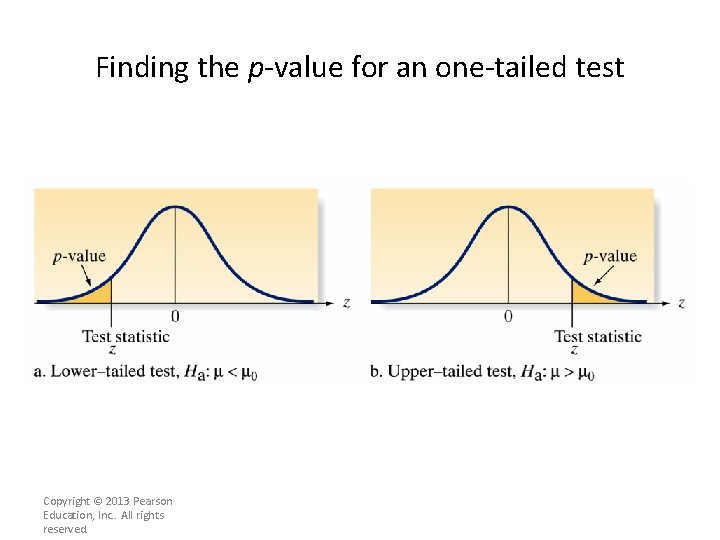
Finding the p-value for an one-tailed test Copyright © 2013 Pearson Education, Inc. . All rights reserved.
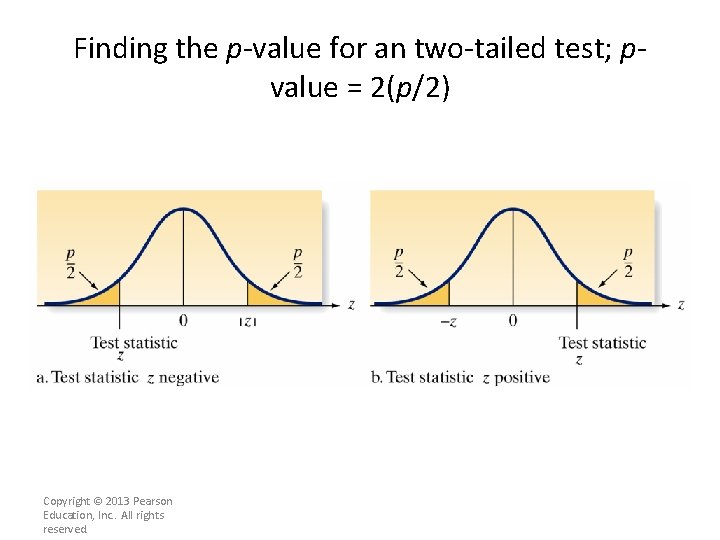
Finding the p-value for an two-tailed test; pvalue = 2(p/2) Copyright © 2013 Pearson Education, Inc. . All rights reserved.
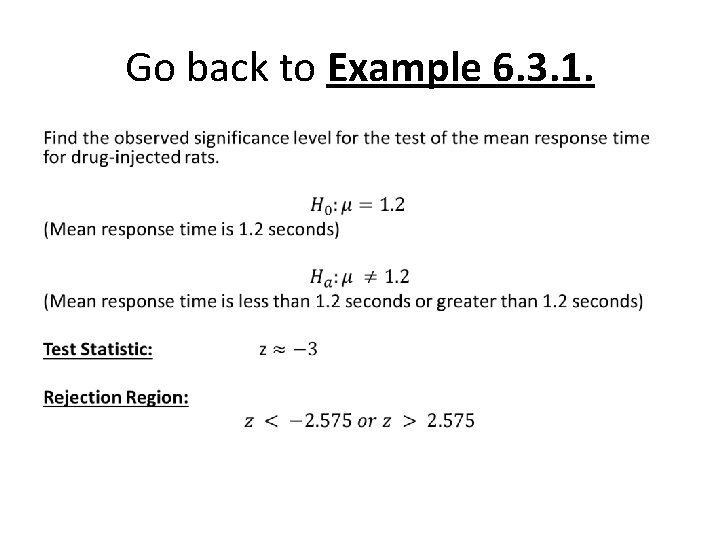
Go back to Example 6. 3. 1. •
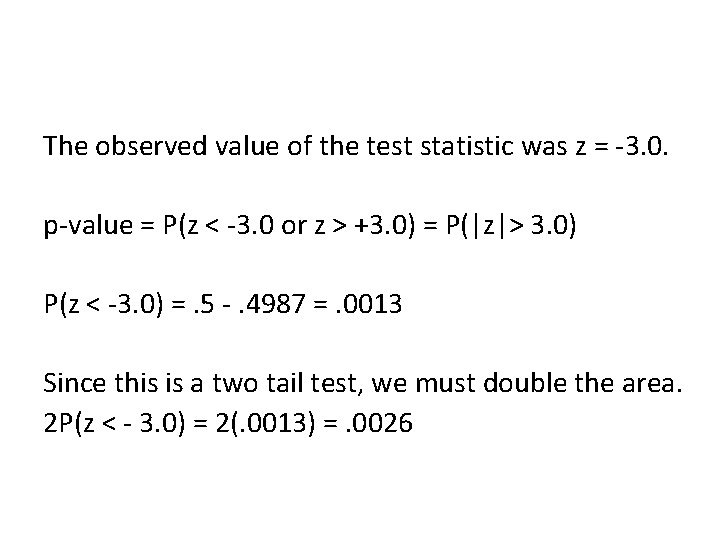
The observed value of the test statistic was z = -3. 0. p-value = P(z < -3. 0 or z > +3. 0) = P(|z|> 3. 0) P(z < -3. 0) =. 5 -. 4987 =. 0013 Since this is a two tail test, we must double the area. 2 P(z < - 3. 0) = 2(. 0013) =. 0026
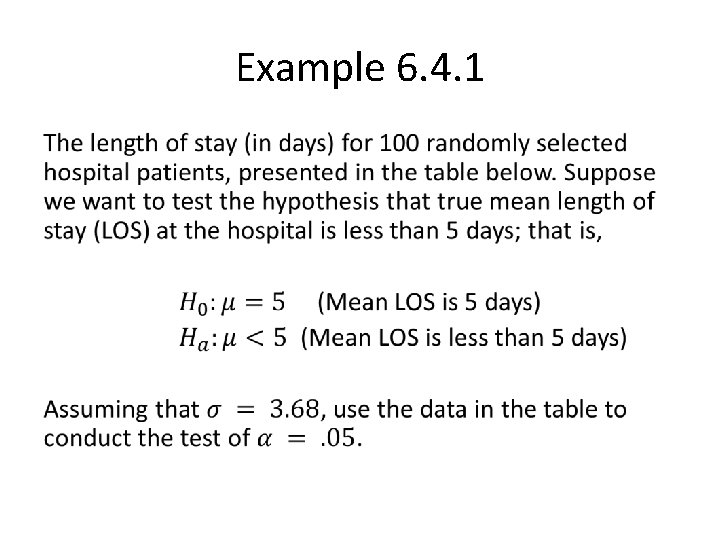
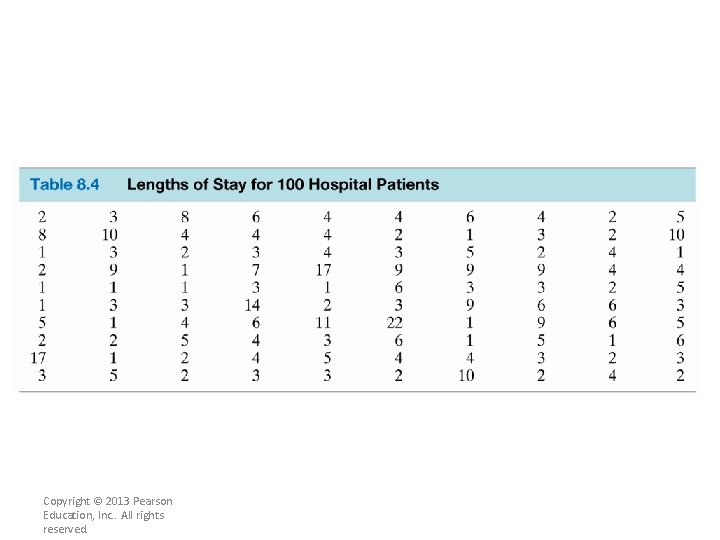
Example 6. 4. 1 •
Copyright © 2013 Pearson Education, Inc. . All rights reserved.
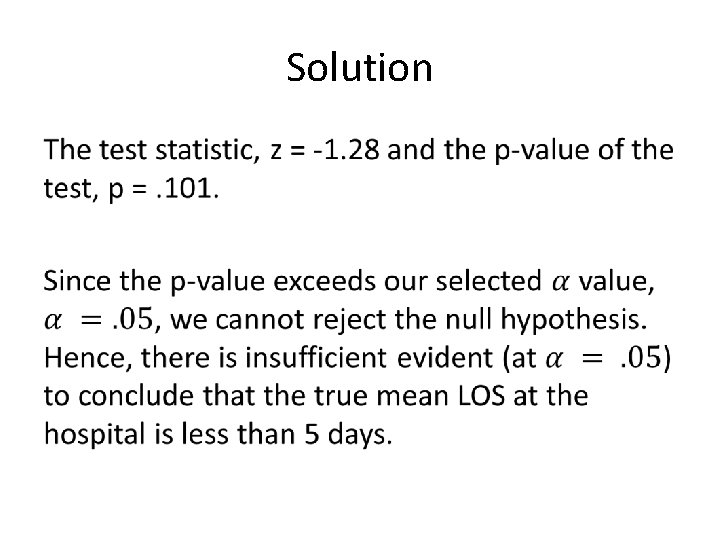
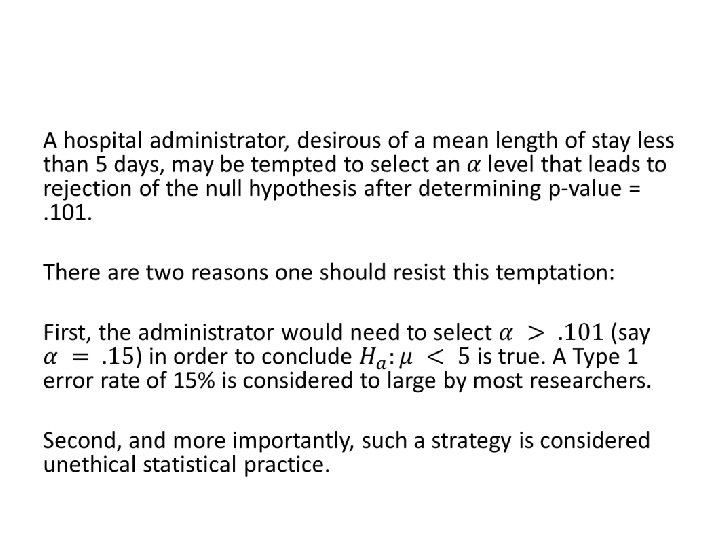
Solution •
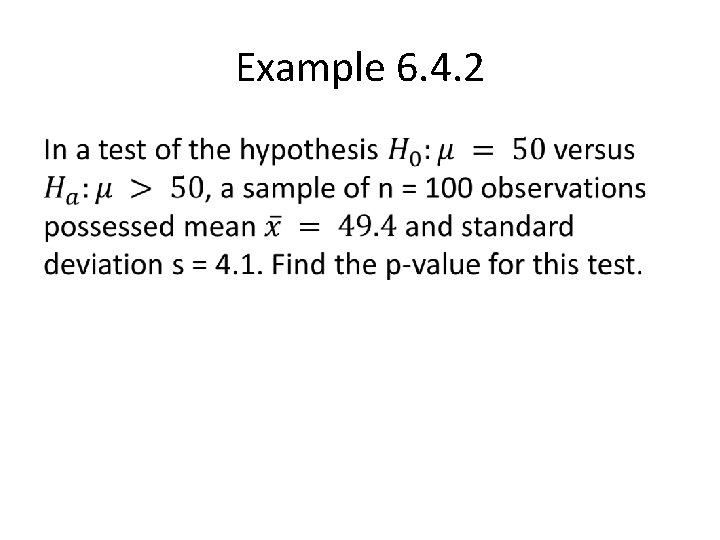
Example 6. 4. 2 •
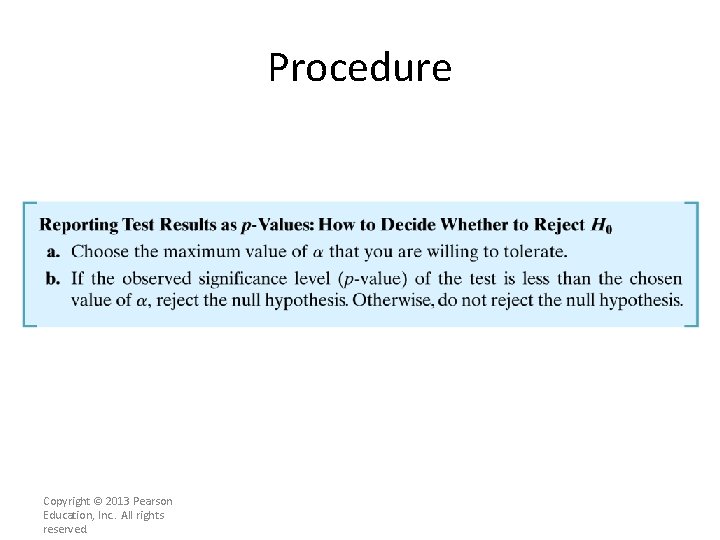
Procedure Copyright © 2013 Pearson Education, Inc. . All rights reserved.