second Semester chapter four Turning Moment Diagrams and

- Slides: 15
second Semester chapter four Turning Moment Diagrams and Flywheel Dr. Adil ABed Nayeeif 2019 -2020
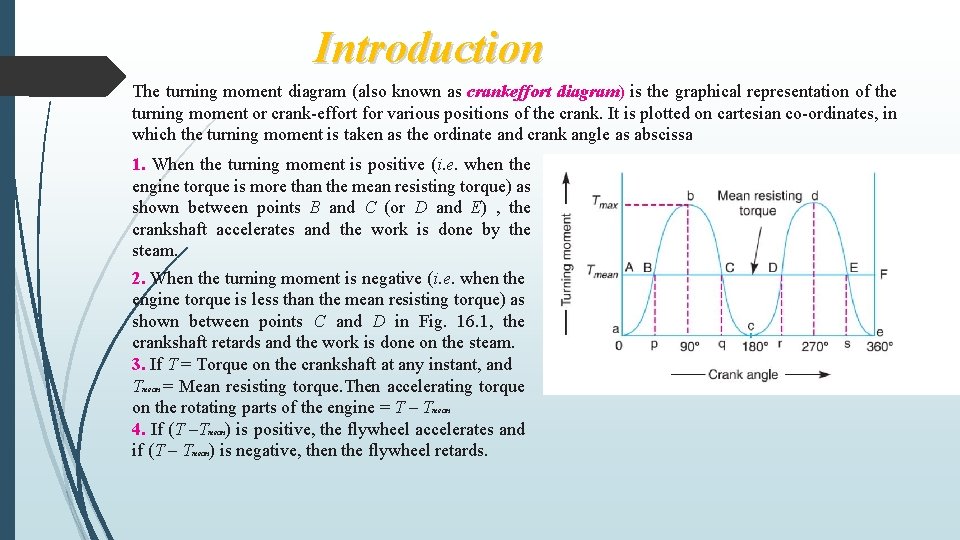
Introduction The turning moment diagram (also known as crankeffort diagram) is the graphical representation of the turning moment or crank-effort for various positions of the crank. It is plotted on cartesian co-ordinates, in which the turning moment is taken as the ordinate and crank angle as abscissa 1. When the turning moment is positive (i. e. when the engine torque is more than the mean resisting torque) as shown between points B and C (or D and E) , the crankshaft accelerates and the work is done by the steam. 2. When the turning moment is negative (i. e. when the engine torque is less than the mean resisting torque) as shown between points C and D in Fig. 16. 1, the crankshaft retards and the work is done on the steam. 3. If T = Torque on the crankshaft at any instant, and Tmean = Mean resisting torque. Then accelerating torque on the rotating parts of the engine = T – Tmean 4. If (T –Tmean) is positive, the flywheel accelerates and if (T – Tmean) is negative, then the flywheel retards.
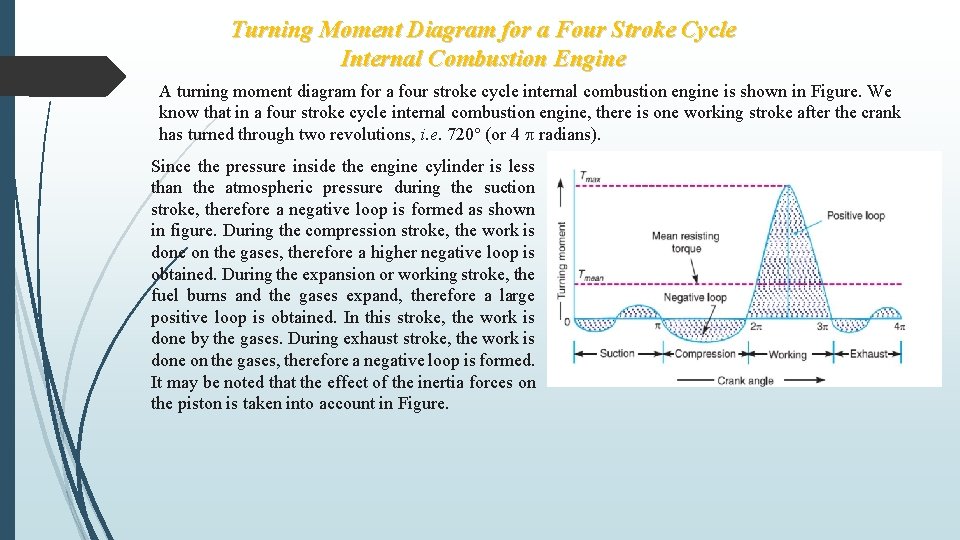
Turning Moment Diagram for a Four Stroke Cycle Internal Combustion Engine A turning moment diagram for a four stroke cycle internal combustion engine is shown in Figure. We know that in a four stroke cycle internal combustion engine, there is one working stroke after the crank has turned through two revolutions, i. e. 720° (or 4 radians). Since the pressure inside the engine cylinder is less than the atmospheric pressure during the suction stroke, therefore a negative loop is formed as shown in figure. During the compression stroke, the work is done on the gases, therefore a higher negative loop is obtained. During the expansion or working stroke, the fuel burns and the gases expand, therefore a large positive loop is obtained. In this stroke, the work is done by the gases. During exhaust stroke, the work is done on the gases, therefore a negative loop is formed. It may be noted that the effect of the inertia forces on the piston is taken into account in Figure.
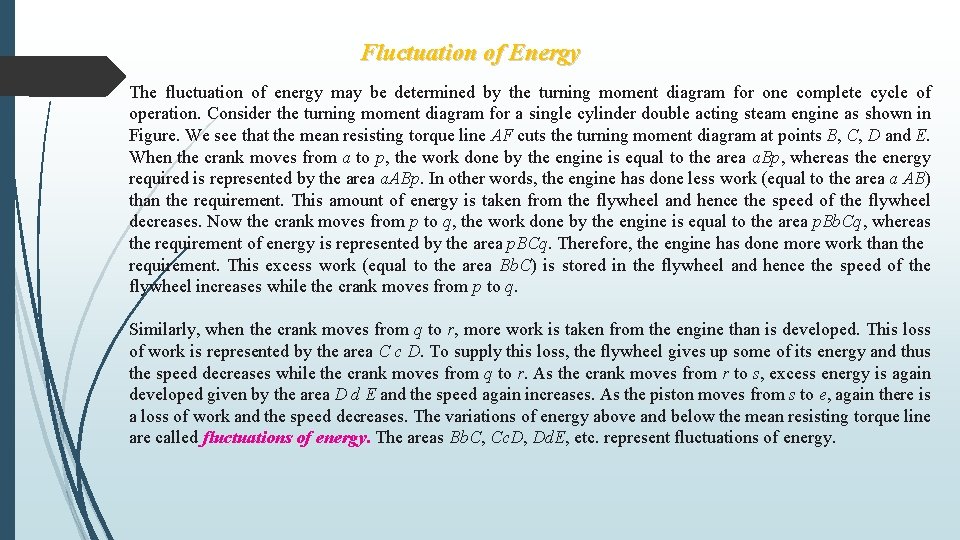
Fluctuation of Energy The fluctuation of energy may be determined by the turning moment diagram for one complete cycle of operation. Consider the turning moment diagram for a single cylinder double acting steam engine as shown in Figure. We see that the mean resisting torque line AF cuts the turning moment diagram at points B, C, D and E. When the crank moves from a to p, the work done by the engine is equal to the area a. Bp, whereas the energy required is represented by the area a. ABp. In other words, the engine has done less work (equal to the area a AB) than the requirement. This amount of energy is taken from the flywheel and hence the speed of the flywheel decreases. Now the crank moves from p to q, the work done by the engine is equal to the area p. Bb. Cq, whereas the requirement of energy is represented by the area p. BCq. Therefore, the engine has done more work than the requirement. This excess work (equal to the area Bb. C) is stored in the flywheel and hence the speed of the flywheel increases while the crank moves from p to q. Similarly, when the crank moves from q to r, more work is taken from the engine than is developed. This loss of work is represented by the area C c D. To supply this loss, the flywheel gives up some of its energy and thus the speed decreases while the crank moves from q to r. As the crank moves from r to s, excess energy is again developed given by the area D d E and the speed again increases. As the piston moves from s to e, again there is a loss of work and the speed decreases. The variations of energy above and below the mean resisting torque line are called fluctuations of energy. The areas Bb. C, Cc. D, Dd. E, etc. represent fluctuations of energy.
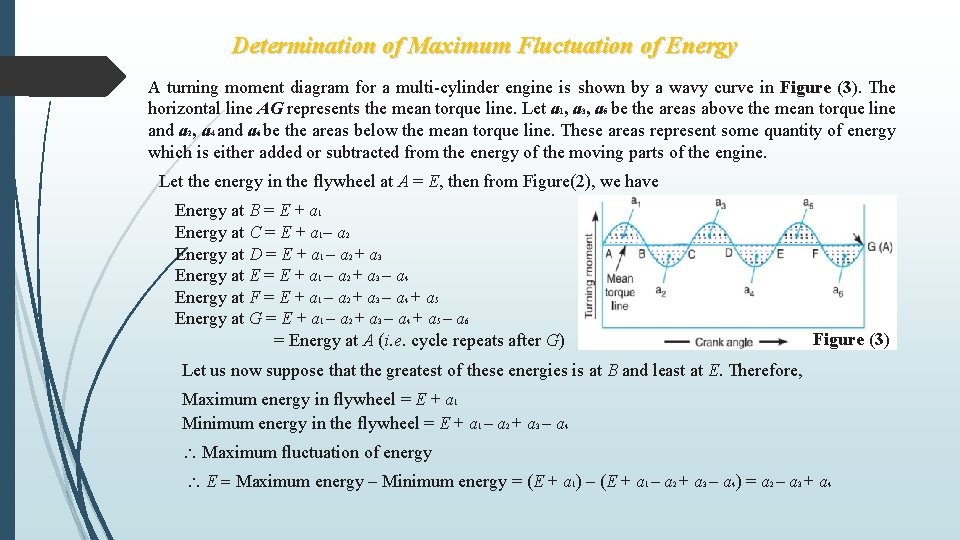
Determination of Maximum Fluctuation of Energy A turning moment diagram for a multi-cylinder engine is shown by a wavy curve in Figure (3). The horizontal line AG represents the mean torque line. Let a 1, a 3, a 5 be the areas above the mean torque line and a 2, a 4 and a 6 be the areas below the mean torque line. These areas represent some quantity of energy which is either added or subtracted from the energy of the moving parts of the engine. Let the energy in the flywheel at A = E, then from Figure(2), we have Energy at B = E + a 1 Energy at C = E + a 1– a 2 Energy at D = E + a 1 – a 2 + a 3 Energy at E = E + a 1 – a 2 + a 3 – a 4 Energy at F = E + a 1 – a 2 + a 3 – a 4 + a 5 Energy at G = E + a 1 – a 2 + a 3 – a 4 + a 5 – a 6 = Energy at A (i. e. cycle repeats after G) Figure (3) Let us now suppose that the greatest of these energies is at B and least at E. Therefore, Maximum energy in flywheel = E + a 1 Minimum energy in the flywheel = E + a 1 – a 2 + a 3 – a 4 Maximum fluctuation of energy E = Maximum energy – Minimum energy = (E + a 1) – (E + a 1 – a 2 + a 3 – a 4) = a 2 – a 3 + a 4
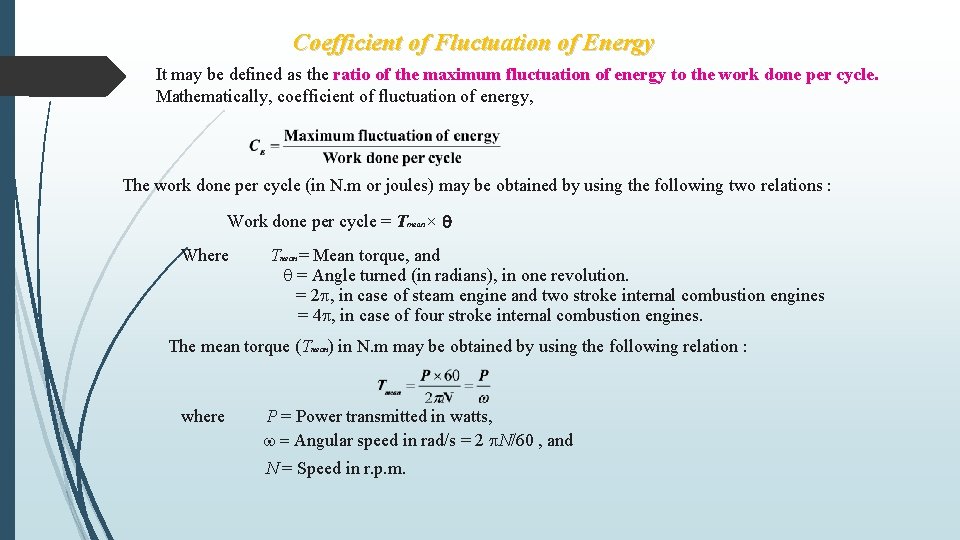
Coefficient of Fluctuation of Energy It may be defined as the ratio of the maximum fluctuation of energy to the work done per cycle. Mathematically, coefficient of fluctuation of energy, The work done per cycle (in N. m or joules) may be obtained by using the following two relations : Work done per cycle = Tmean × Where Tmean = Mean torque, and = Angle turned (in radians), in one revolution. = 2 , in case of steam engine and two stroke internal combustion engines = 4 , in case of four stroke internal combustion engines. The mean torque (Tmean) in N. m may be obtained by using the following relation : where P = Power transmitted in watts, = Angular speed in rad/s = 2 N/60 , and N = Speed in r. p. m.
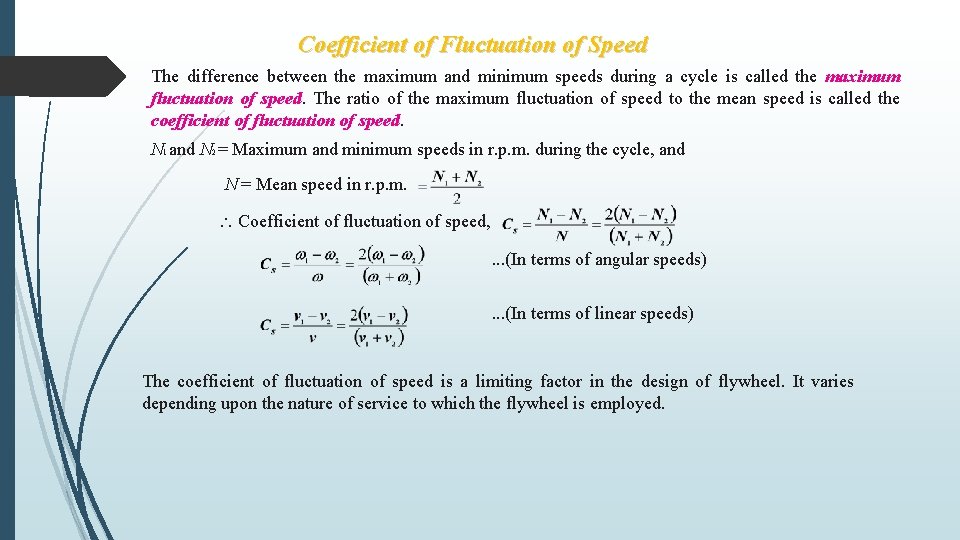
Coefficient of Fluctuation of Speed The difference between the maximum and minimum speeds during a cycle is called the maximum fluctuation of speed. The ratio of the maximum fluctuation of speed to the mean speed is called the coefficient of fluctuation of speed. N 1 and N 2 = Maximum and minimum speeds in r. p. m. during the cycle, and N = Mean speed in r. p. m. Coefficient of fluctuation of speed, . . . (In terms of angular speeds). . . (In terms of linear speeds) The coefficient of fluctuation of speed is a limiting factor in the design of flywheel. It varies depending upon the nature of service to which the flywheel is employed.
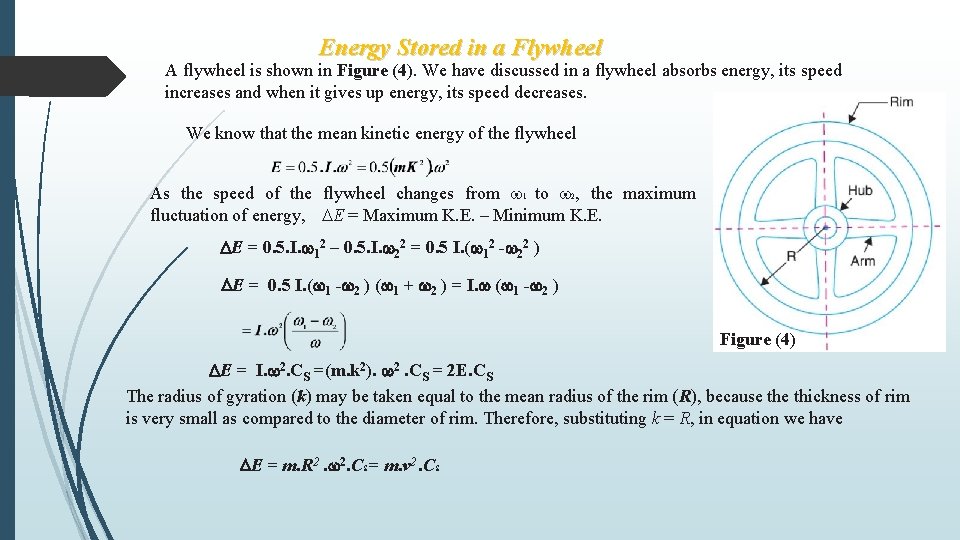
Energy Stored in a Flywheel A flywheel is shown in Figure (4). We have discussed in a flywheel absorbs energy, its speed increases and when it gives up energy, its speed decreases. We know that the mean kinetic energy of the flywheel As the speed of the flywheel changes from 1 to 2, the maximum fluctuation of energy, E = Maximum K. E. – Minimum K. E. E = 0. 5. I. 12 – 0. 5. I. 22 = 0. 5 I. ( 12 - 22 ) E = 0. 5 I. ( 1 - 2 ) ( 1 + 2 ) = I. ( 1 - 2 ) Figure (4) E = I. 2. CS =(m. k 2). 2. CS = 2 E. CS The radius of gyration (k) may be taken equal to the mean radius of the rim (R), because thickness of rim is very small as compared to the diameter of rim. Therefore, substituting k = R, in equation we have E = m. R 2. 2. CS = m. v 2. CS
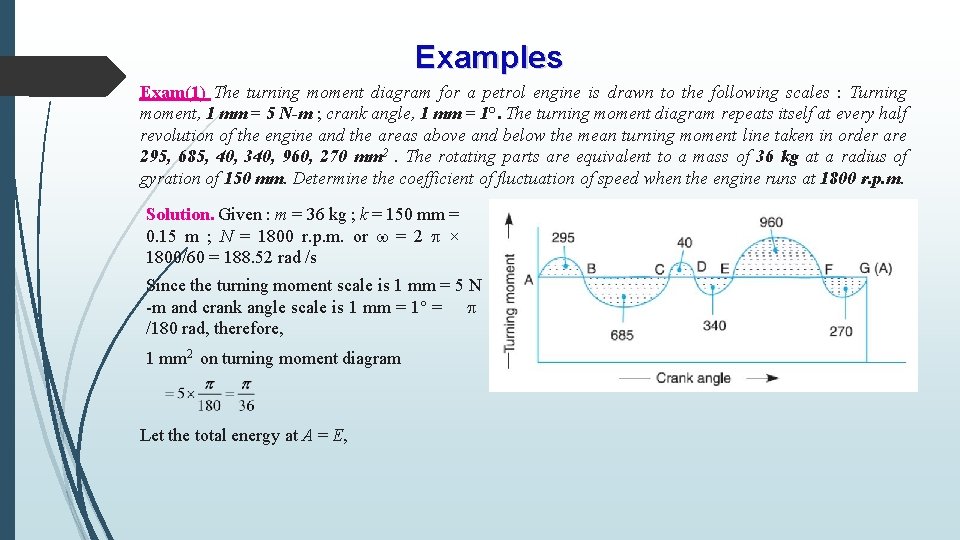
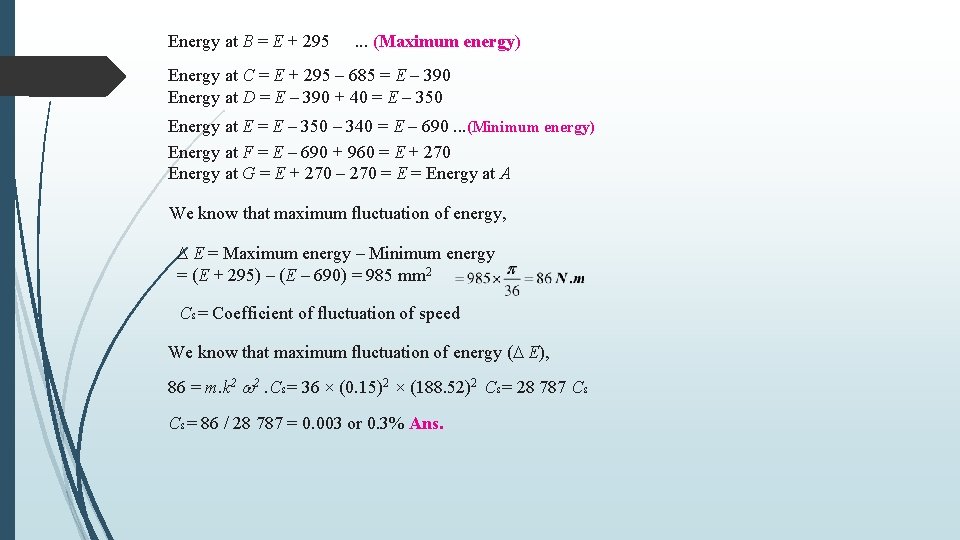
Examples Exam(1) The turning moment diagram for a petrol engine is drawn to the following scales : Turning moment, 1 mm = 5 N-m ; crank angle, 1 mm = 1°. The turning moment diagram repeats itself at every half revolution of the engine and the areas above and below the mean turning moment line taken in order are 295, 685, 40, 340, 960, 270 mm 2. The rotating parts are equivalent to a mass of 36 kg at a radius of gyration of 150 mm. Determine the coefficient of fluctuation of speed when the engine runs at 1800 r. p. m. Solution. Given : m = 36 kg ; k = 150 mm = 0. 15 m ; N = 1800 r. p. m. or = 2 × 1800/60 = 188. 52 rad /s Since the turning moment scale is 1 mm = 5 N -m and crank angle scale is 1 mm = 1° = /180 rad, therefore, 1 mm 2 on turning moment diagram Let the total energy at A = E,
Energy at B = E + 295 . . . (Maximum energy) Energy at C = E + 295 – 685 = E – 390 Energy at D = E – 390 + 40 = E – 350 Energy at E = E – 350 – 340 = E – 690. . . (Minimum energy) Energy at F = E – 690 + 960 = E + 270 Energy at G = E + 270 – 270 = Energy at A We know that maximum fluctuation of energy, E = Maximum energy – Minimum energy = (E + 295) – (E – 690) = 985 mm 2 CS = Coefficient of fluctuation of speed We know that maximum fluctuation of energy ( E), 86 = m. k 2 2. CS = 36 × (0. 15)2 × (188. 52)2 CS = 28 787 CS CS = 86 / 28 787 = 0. 003 or 0. 3% Ans.
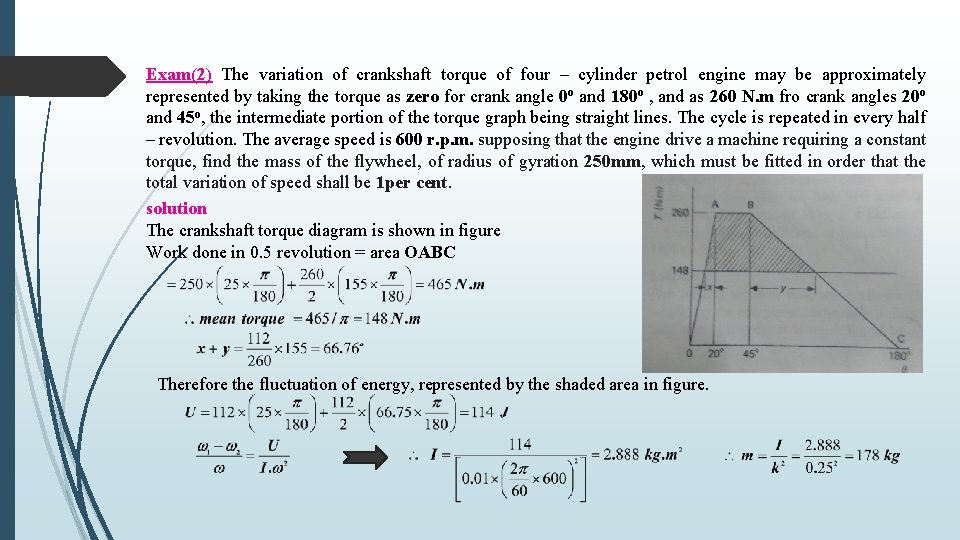
Exam(2) The variation of crankshaft torque of four – cylinder petrol engine may be approximately represented by taking the torque as zero for crank angle 0 o and 180 o , and as 260 N. m fro crank angles 20 o and 45 o, the intermediate portion of the torque graph being straight lines. The cycle is repeated in every half – revolution. The average speed is 600 r. p. m. supposing that the engine drive a machine requiring a constant torque, find the mass of the flywheel, of radius of gyration 250 mm, which must be fitted in order that the total variation of speed shall be 1 per cent. solution The crankshaft torque diagram is shown in figure Work done in 0. 5 revolution = area OABC Therefore the fluctuation of energy, represented by the shaded area in figure.
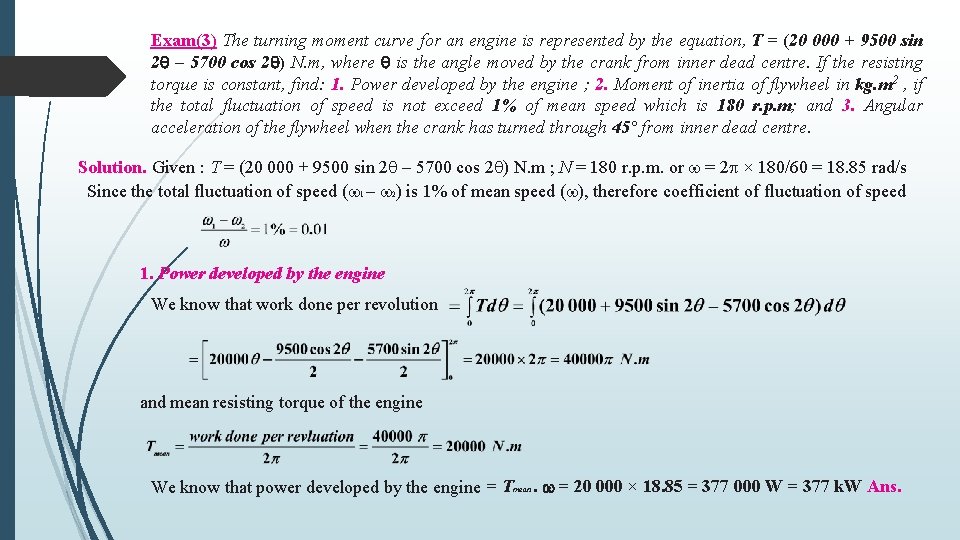
Exam(3) The turning moment curve for an engine is represented by the equation, T = (20 000 + 9500 sin 2 – 5700 cos 2 ) N. m, where is the angle moved by the crank from inner dead centre. If the resisting torque is constant, find: 1. Power developed by the engine ; 2. Moment of inertia of flywheel in kg. m 2 , if the total fluctuation of speed is not exceed 1% of mean speed which is 180 r. p. m; and 3. Angular acceleration of the flywheel when the crank has turned through 45° from inner dead centre. Solution. Given : T = (20 000 + 9500 sin 2 – 5700 cos 2 ) N. m ; N = 180 r. p. m. or = 2 × 180/60 = 18. 85 rad/s Since the total fluctuation of speed ( 1 – 2) is 1% of mean speed ( ), therefore coefficient of fluctuation of speed 1. Power developed by the engine We know that work done per revolution and mean resisting torque of the engine We know that power developed by the engine = Tmean. = 20 000 × 18. 85 = 377 000 W = 377 k. W Ans.
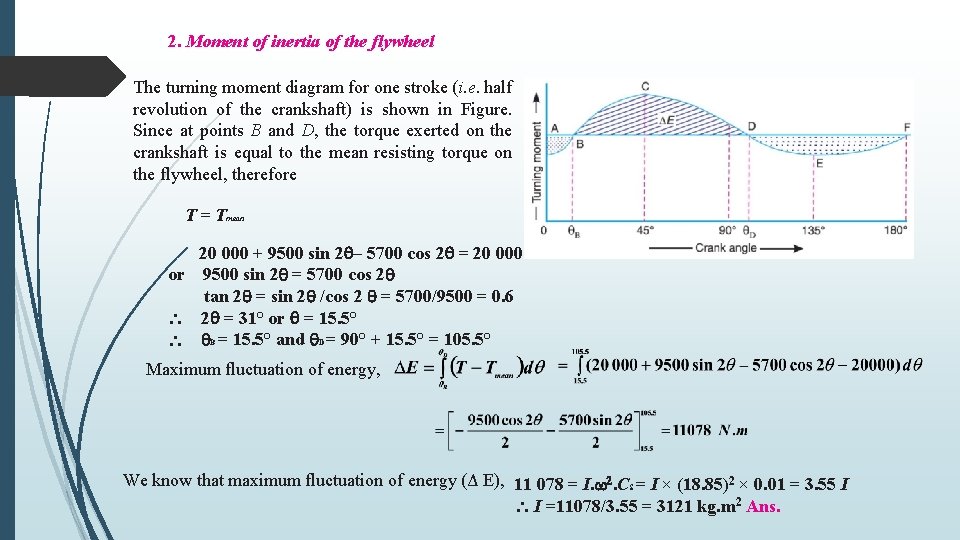
2. Moment of inertia of the flywheel The turning moment diagram for one stroke (i. e. half revolution of the crankshaft) is shown in Figure. Since at points B and D, the torque exerted on the crankshaft is equal to the mean resisting torque on the flywheel, therefore T = Tmean 20 000 + 9500 sin 2 – 5700 cos 2 = 20 000 or 9500 sin 2 = 5700 cos 2 tan 2 = sin 2 /cos 2 = 5700/9500 = 0. 6 2 = 31° or = 15. 5° B = 15. 5° and D = 90° + 15. 5° = 105. 5° Maximum fluctuation of energy, We know that maximum fluctuation of energy (Δ E), 11 078 = I. 2. CS = I × (18. 85)2 × 0. 01 = 3. 55 I I =11078/3. 55 = 3121 kg. m 2 Ans.
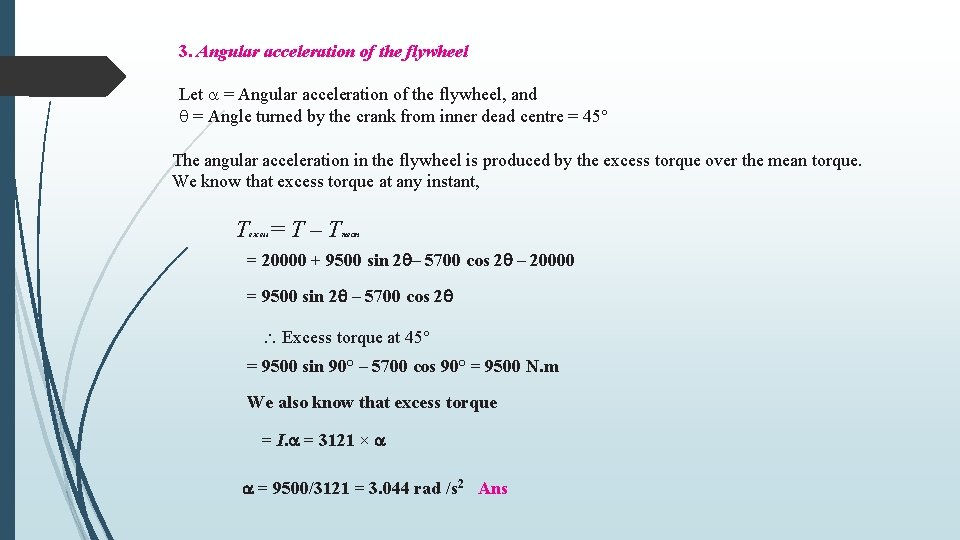
3. Angular acceleration of the flywheel Let = Angular acceleration of the flywheel, and = Angle turned by the crank from inner dead centre = 45° The angular acceleration in the flywheel is produced by the excess torque over the mean torque. We know that excess torque at any instant, T =T–T excess mean = 20000 + 9500 sin 2 – 5700 cos 2 – 20000 = 9500 sin 2 – 5700 cos 2 Excess torque at 45° = 9500 sin 90° – 5700 cos 90° = 9500 N. m We also know that excess torque = I. = 3121 × = 9500/3121 = 3. 044 rad /s 2 Ans
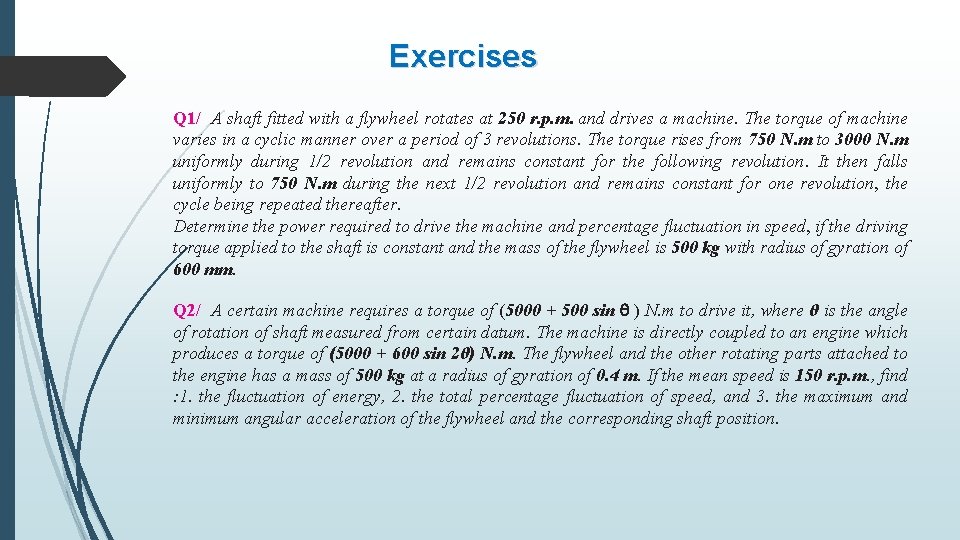
Exercises Q 1/ A shaft fitted with a flywheel rotates at 250 r. p. m. and drives a machine. The torque of machine varies in a cyclic manner over a period of 3 revolutions. The torque rises from 750 N. m to 3000 N. m uniformly during 1/2 revolution and remains constant for the following revolution. It then falls uniformly to 750 N. m during the next 1/2 revolution and remains constant for one revolution, the cycle being repeated thereafter. Determine the power required to drive the machine and percentage fluctuation in speed, if the driving torque applied to the shaft is constant and the mass of the flywheel is 500 kg with radius of gyration of 600 mm. Q 2/ A certain machine requires a torque of (5000 + 500 sin ) N. m to drive it, where θ is the angle of rotation of shaft measured from certain datum. The machine is directly coupled to an engine which produces a torque of (5000 + 600 sin 2θ) N. m. The flywheel and the other rotating parts attached to the engine has a mass of 500 kg at a radius of gyration of 0. 4 m. If the mean speed is 150 r. p. m. , find : 1. the fluctuation of energy, 2. the total percentage fluctuation of speed, and 3. the maximum and minimum angular acceleration of the flywheel and the corresponding shaft position.