SECOND FIELD CAMPAIGN ICELAND L Holko J I


 Snow density")
, scales")
 Estonia, Lithuania USGS, USA Metallic, mechanical balance scales")

, Slovakia Electronic spring scales")
 snow, Slovakia Not used in")
")


 Smaller variability over the")


 Snow depth variabiability was the")

 indicate that although there are differences, values at")


 to organize one more field")
- Slides: 27
SECOND FIELD CAMPAIGN ICELAND L. Holko, J. I. López-Moreno, L. Leppännen, P. Dagsson Waldhauserova COST meeting Smolenice, 21 September 2017
Organization Two sites: n Hellisheiði POWER PLANT n Bláfjöll SKI AREA 95 cm/350 mm 50 cm/125 mm
Organization n n Trench about 20 m long (two at POWER PLANT) Snow density profile measured first Then, snow depth and water equivalent were measured by different snow samplers 5 measurements (close to each other) on the left and right sides of the trench (experts, novices)
Snow samplers n The same principle, but different tubes (dimensions, material, cutters), scales
GGI (State Hydrological Institute ) Estonia, Lithuania USGS, USA Metallic, mechanical balance scales
FMI, Finland Plastic? Mechanical balance scales Snow. Hydro, Spain, plexiglass Electronic strain gauge scales
ETH_SLF, Switzerland Metallic, Mechanical spring scales Glass fiber (CHMI), Slovakia Electronic spring scales
IF PAS, Poland, spring scales Snow/Ice, Italy Hard (artificial) snow, Slovakia Not used in intercomparison measurements
Results (147 measurements)
Precision- accuracy This can be used if we know the true value
Precision – accuracy - errors n n n Snow depth and density (and consequently SWE) have some natural variability even at small scales Because we do not know the true values, it is not possible to determine the device/observer induced error Variability over the entire trench was calculated; CVs for SWE given by individual devices were calculated only for at least 4 measurements
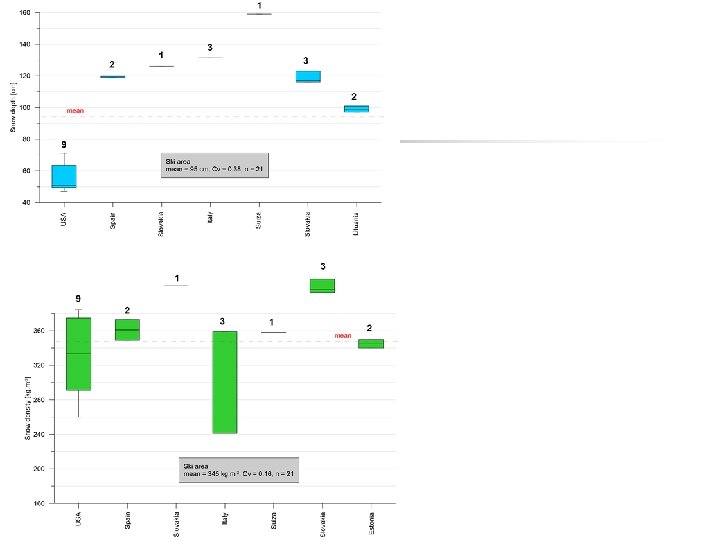
Results – snow depth n (number of replications above graphs) Smaller variability over the trench, small ranges (10%), a few measurements (with “many” replications) were “off”
50, 47, 57, 66, 53 Results – snow depth 59, 48, 44, 41, 53 37, 40, 43, 55, 45 n Large variability at many points, two measurements seem to be “off”
Results – snow depth n Significantly less measurements and replications, large variability
Results – snow density n One measurement seems to be off, snow density around the middle of the trench was smaller
Speculation Let us assume that: n snow depth is measured with higher accuracy than snow density n Snow density has smaller natural variability than snow depth n Then n Would the difference between CV of SD and snow density indicate variability induced by the observer? n 0. 08 vs 0. 13 => 5%
Results – snow density n n Snow density at NORTH had smaller variability than snow depth 0. 12 vs 0. 10 ? ? ?
Results – snow density n Most measurements quite similar, but very few replications (with one exception)
Results – snow water equivalent n SWE measured by different devices/people was within ± 10%
Results – snow water equivalent n SWE measured by different devices/people was within ± 10%
Source of “errors” n n (reason of high Cv) Snow depth variabiability was the main cause of high SWE variability (CV>0. 10) in trench NORTH. Interestingly, at SOUTH it was snow density.
Various combinations n n Interplay of individual measurements of snow depth and density also resulted in CV of SWE higher than CVs of snow depth and density (e. g. FMI, Slovakia in NORTH and Estonia_student, USA and Slovakia in SOUTH). Once it also happened that CV of SWE was smaller than CVs of snow depth and density (Estonia in NORTH).
Results n Statistics (ANOVA, descriptive statistics) indicate that although there are differences, values at SOUTH and NORTH came from the same population
Conclusions n n Variability of SWE values measured even in relatively homogenous snowpack is about 10% More measurements are needed during more complicated snow conditions (e. g. at SKI area)
Conclusions
Conclusions n Is it possible (does it make sense) to organize one more field intercomparison with deeper snowpack (e. g. about 1 m), maybe with less devices, but more measurements?