Schistosoma mansoni and HIV1 infection Is there any

")
 are infected with HIV-1 infection,")


 CPR APR Female")


 was 14. 78%: -")


 HIV-1 + S. mansoni co-infected (n=28) F-test P-values t")


- Slides: 32
Schistosoma mansoni and HIV-1 infection: Is there any association? Humphrey D. Mazigo, Ph. D
Global adult prevalence of HIV and schistosomiasis (Bastinduy et al. , 2014)
INTRODUCTION • Globally, 35. 3 M (≥ 15 years) are infected with HIV-1 infection, of these, 23. 5 M (68%) live in SSA (UNAIDS. , 2013) • Globally, 779 M in 76 countries are at risk for schistosomiasis and 207 M are infected, 90% live in sub-Saharan Africa (Steinmann et al. , 2006; Hotez et al. , 2007)
Global burden of diseases • The DALYs lost due to schistosomiasis are estimated at 4. 5 M • The DALYs lost due to HIV infection is >80 M • Combined DALYs results into significant morbidities and mortalities Hotez et al. , 2006; 2014
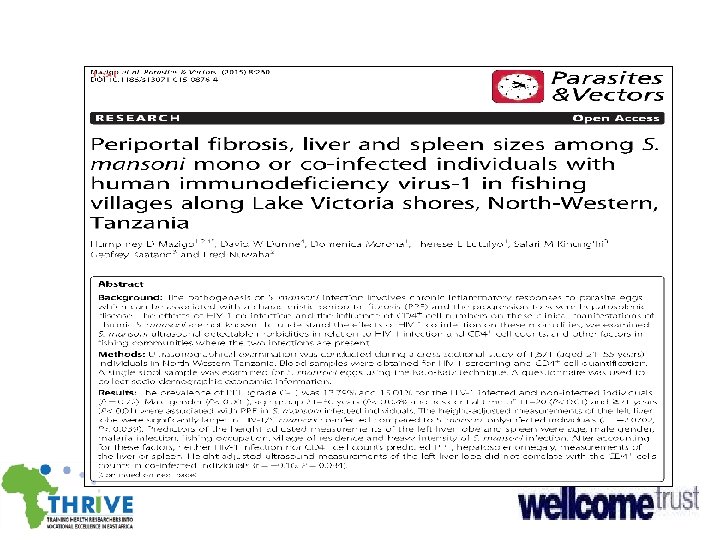
Schistosomiasis in Tanzania • Two spp S. mansoni and S. haematobium are endemic and widely spread in country • S. mansoni is wide spread along the large water bodies • S. haematobium is mainly in small water bodies • National prevalence: 52% but varies between regions • Health effect of S. mansoni infection: Periportal fibrosis, hepatomegaly, splenomegaly and hepatosplenomegaly and death associatted with portal hypertension, oesophageal varices and hemetemesis Mazigo et al. , 2012; Rollinson et al. , 2012
Life cycle of Schistosomiasis
HIV-1 in Tanzania • National prevalence is 5. 2% and varies between regions • Age: 15 – 49 yrs – 5% • Sex: Female 6% and males 4% • Residential: Urban 7% vs rural 4% • Fishing villages along the Lake Victoria shores marked as highly risk groups THMIS: 2013/14
HIV-1 and S. mansoni co-infections • Because of the overlap of HIV-1 and S. mansoni in SSA, half of 25 M HIV infected individuals may be co-infected (Secor 2000: Bentwich et al. , 2000) • Hypothesis: - co-infection of HIV-1 and S. mansoni may enhance virulence of each other within a co-infected host (Lawn 2001; Wolday 2002) • But, the role played by concurrent HIV-1 infection as accelerating factor for S. mansoni infection, related morbidities and PZQ treatment outcome remain a topic of further studies
HIV-1 and S. mansoni co-infections u The effects of HIV-1 on schistosomiasis u CD 4+ T cell reductions by HIV-1: - Alters eggs excretion efficiency (Karanja et al. , 1997) - Decrease fibrogenesis, hence, severe hepatic morbidities (Mwinzi et al. , 2001) - Increases susceptible to re-infection with Schistosomes (Karanja et al. , 2002) - Low CD 4+ T cell counts are associated with reduced levels of eosinophils which are necessary for resistance to repeated schistosomal infections (Ganley et al. , 2006)
HIV-1 and S. mansoni co-infections The effects of schistosomiasis in HIV-1 • Infections with schistosomes cause chronic stimulation of the immune system with a strong bias towards Th 2 CD 4+ response (Pearce et al. , 1991). • Th 2 response to Schistosomes Ag down-regulates Th 1 -type responses which are necessary for efficient antiviral CD 8+ CTL prod. (Mc. Elroy et al. , 2005). • HIV replicates more rapidly in activated T cells with Schistosomes Ag and CD 4+ T cells lines are more easily affected than Th 1 (Lawn et al. , 1991). • In Ethiopia, a study of HIV-1 infected and uninfected, helminth infection was associated with increased T- cell activation (Kassu, 2003). • In HIV-uninfected indiv. increased T-cell activation make them more susceptible to HIV infection (Kassu, 2003).
Is S. mansoni associatted with HIV-1 infection
Is S. mansoni associatted with HIV-1 infection Odd of developing immunological failure were 4 times greater in patients with SM/HIV-1 co-infection
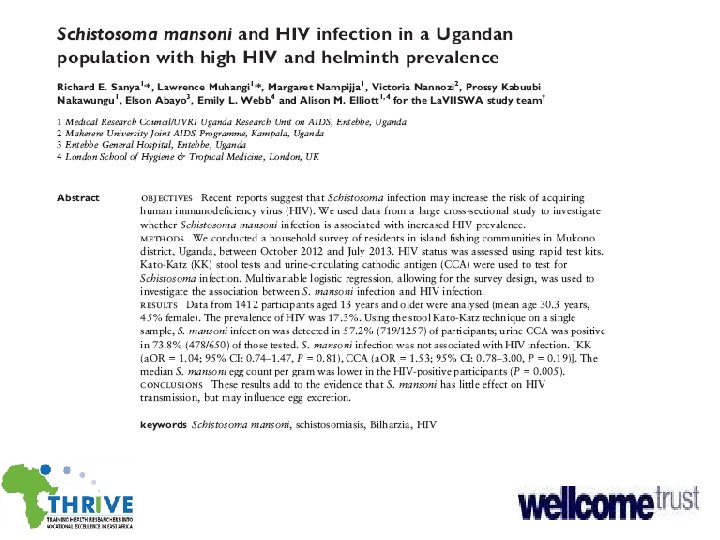
Is S. mansoni infection associated with HIV infection?
Does PZQ treatment have impact on HIV-1 markers?
Factors associated with S. mansoni infection Variable No. infected Prevalence (%) CPR APR Female 382 40. 29 1 1 Male 472 56. 14 1. 39(1. 26 -1. 54) 1. 27(1. 14 -1. 42) SME 129 44. 14 1 1 Peasants 561 45. 11 1. 02(0. 89 -1. 16) 1. 06(0. 86 -1. 24) Fishing 164 66. 28 1. 52(1. 42 -1. 59) 1. 27(1. 06 -1. 53) Igombe 176 40. 42 1 1 Igala 141 55. 47 1. 37(1, 31 -1. 44) 1. 31(1. 12 -1. 52) Kayenze 351 54. 24 1. 34(1. 24 -1. 44) 1. 32(1. 15 -1. 51) Sangabuye 186 41. 24 1. 02(0. 88 -1. 78) 1. 06(0. 89 -1. 25) Negative 804 48. 12 1 1 Positive 50 39. 52 0. 92(0. 78 -1. 09) 1. 01(0. 84 -1. 21) Sex Occupation Village HIV-1
Factors associated with intensities of S. mansoni infection q Intensity of S. mansoni infection was not associated with HIV-1 infection (AOR = 0. 84, 95% CI; 0. 56 – 1. 25) • The intensity of S. mansoni infection was associated with : q Male gender (AOR = 1. 65, 95% CI; 1. 32 -2. 08, P<0. 0001) q Young ages (21– 30 yrs; AOR = 1. 68, 95% CI; 1. 14 -2. 48, P<0. 01) q Involvement in fishing activities (AOR = 1. 62, 95%CI; 1. 10 -2. 41, P<0. 01) q Being illiterate (AOR = 1. 33, 95% CI; 1. 07 – 1. 66, P<0. 014) q Living in the study villages. - Igala – (AOR=1. 71, 95%CI; 1. 23 -2. 40) - Kayenze – (AOR=1. 62, 95%CI; 1. 23 -2. 13) - Sangabuye – (AOR=1. 38, 95%CI; 1. 001 -1. 89)
Association between immune status and S. mansoni infections
Prevalence of PPF § The overall prevalence PPF (grades C-F) was 14. 78%: - 29. 55% were grade C, 52. 63% (130/247) D, 14. 17% (35/247) E and 3. 64% (9/247) were grade F § In relation to S. mansoni infection, of the individuals detected with PPF, 52. 23% (129/247) had detectable eggs § PPF prevalence did not differ by prevalence (P=0. 10) and infection intensities of S. mansoni based on egg count (epg) (P=0. 11)
Results q In relation to HIV-1 infection, 13. 79% and 15. 01% of the HIV-1 infected and uninfected individuals had PPF (P=0. 72) q HIV-1 infected: n=4 had grade C, n = 8 had grade D and n = 4 had grade E-F Factors associated with PPF: - q Male gender (AOR = 2. 27, P< 0. 001), q Age group 21– 30 years (AOR = 2. 45, P< 0. 028) q Residential time, 11– 20 years (AOR = 3. 52, P< 0. 01) and ≥ 21 yrs (AOR =2. 66, P< 0. 01)
Comparison of the height adjusted mean deviations of organs in relation to infection with S. mansoni and HIV-1 infection status In relation to HIV-1 serostatus Organomegaly HIV-1 negative infected with S. mansoni (N= 790) deviations from mean (95%CI) HIV-1 positive co- F-ratio P-values infected with S. mansoni (N= 50) deviations from mean (95%CI) 2. 23 (2. 11 – 2. 36) 2. 79 (2. 23 – 3. 37) -2. 0702 0. 039 1. 21 (1. 08 – 1. 34) 1. 57 (1. 14 – 2. 00) -1. 3664 0. 17 1. 04 (0. 97 – 1. 12) 0. 92 (0. 69 – 1. 16) 0. 8072 0. 42 Liver Left liver lobe size Spleen size Portal vein Diameter Portal vein size
Correlation between left liver lobe sizes and CD 4+ in co-infected individuals The no correlation was observed (r=-0. 16, P=0. 084)
Predictors of left liver lobe hepatomegaly, splenomegaly and hepatosplenomegaly • Left liver lobe measurements: - the age of the study participants (P<0. 038), malaria infection (P<0. 038) and intensities of S. mansoni infection (P<0. 01). HIV-1 infection was not (P=0. 069) • Spleen measurements: - being male (P<0. 002), fishing occupation (P<0. 05), village of residence (living in Kayenze village, P<0. 039 and Igala village, P<0. 005), being infected with malaria parasite (P<0. 018) and HIV-1 infection (P<0. 05) • Hepatosplenomegaly: - village of residence (living at Sangabuye village, AOR=2. 09, P<0. 022, Kayenze village, AOR=1. 83, P<0. 04: Igala, AOR=2. 49, P<0. 023) and being heavily infected with S. mansoni infection (AOR=1. 13, 95%CI; P<0. 041)
Objective 3 a
Parasitological cure rates in relation to HIV-1 serostatus • Overall parasitological cure rate: 61. 80% (n=343/555) • HIV-1 negative: 526 infected with S. mansoni at baseline, cure rate: 62. 19% (329/555) • HIV-1 + S. mansoni: - cure rate: 48. 28% (14/29) • No significance difference (P= 0. 12)
Parasitological cure rates in relation to CD 4+ cells counts • Co-infected with CD 4+ cell counts <350 cells/µL: cure rate 43. 75%(7/16) • Co-infected with CD 4+ cells counts ≥ 350 cells/µL: cure rate: 66. 67%(8/12).
Comparison of HIV-1 viral loads, CD 4 -Th 2 lymphocytes and effects of praziquantel treatment among adults infected or not with S. mansoni in fishing villages of North-Western Tanzania. Infectious Diseases of Poverty
Results Variables HIV-1 only (n=22) HIV-1 + S. mansoni co-infected (n=28) F-test P-values t =-4. 72553 0. 0001** t= - 2. 0892 0. 042** t= -0. 2714 0. 79 HIV-1 viral load (Mean log 10 RNA copies/ml of plasma) Baseline 3 month 6 month 5. 98 ± 3. 06 9. 21 ± 1. 91 (95%CI: 4. 79 – 7. 17) (95%CI: 8. 36 – 10. 06) 8. 19 ± 2. 17 9. 44 ± 1. 99 (95%CI: 7. 35 -9. 03) (95%CI: 8. 55 – 10. 32) 10. 49 ± 1. 29 10. 59 ± 1. 44 (95%CI: 9. 99 – 10. 99) (95%CI: 9. 96 – 11. 24)
Conclusion q S. mansoni-related PPF, liver and spleen enlargements occur in the study population and with similar grades observed among co-infected and in S. mansoni only infected individuals q HIV-1 infection or CD 4+ levels was not associated with increased risk of heavy intensity of S. mansoni infection or severe organomegally and had no effect on PZQ treatment outcomes q PZQ treatment had a significant effect on prevalence, intensity of infection and S. mansoni related morbidities but did not lead to any changes on CD 4+ cell counts and plasma viral loads q No association between S. mansoni and HIV-1 infection. Further study are needed
Asanteni