Rosillo Creek Flood monitoring and mapping in San
- Slides: 21
“Rosillo Creek Flood monitoring and mapping in San Antonio-Texas, an Emergency Management point of view” Part II (and what can we do about this for Onion Creek in Austin? ) Rodrigo Nicolau TERM PROJECT CE 394 K GIS for Water Resources
Model Integration Framework for Floodplain Mapping of Rosillo Creek • Starting where Silvana stopped: • The results obtained by the analysis and utilization of times series – Average depth – Accumulated volume Model system (all integrated): NEXRAD, Rainfall data Geospatial Data: City, county, SARA, others Calibration Data Allows: floodplain management, flood forecasting, Capital improvement planning
Model Integration Framework for Floodplain Mapping of Rosillo Creek • Model framework for Floodplain Mapping of Salado Creek (CRWR research project by Oscar Robayo and Prof. David Maidment) • Represent multi – model and GIS integration of the hydrologic and hydraulic components of the San Antonio Basin Modeling Project • Rosillo Creek as part of Salado Creek • GIS • Integrates graphic data and variety of info from databases • Management and display of info geo-referenced framework • Share of input/output data possible between different software/model (H&H) • Rosillo Creek • Spatial linkages • Stream networks, Water features Hydraulic & Hydrologic models • Arc. Hydro Allows HEC-RAS and HEC-HMS to interact
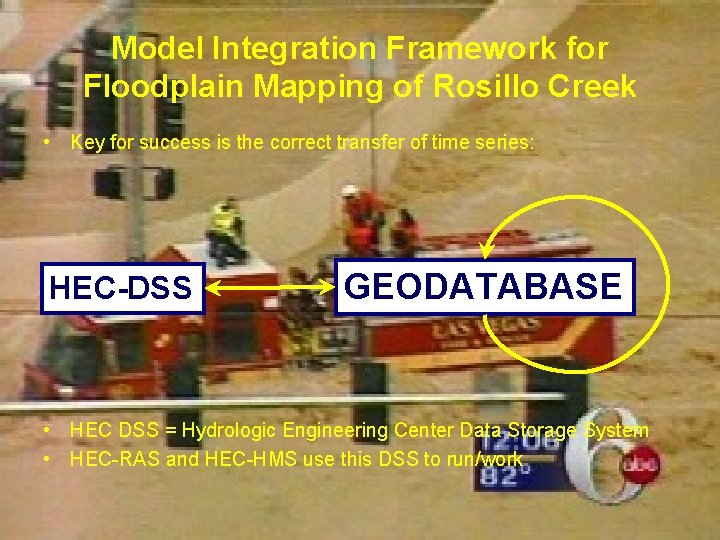
Model Integration Framework for Floodplain Mapping of Rosillo Creek • Key for success is the correct transfer of time series: HEC-DSS GEODATABASE • HEC DSS = Hydrologic Engineering Center Data Storage System • HEC-RAS and HEC-HMS use this DSS to run/work
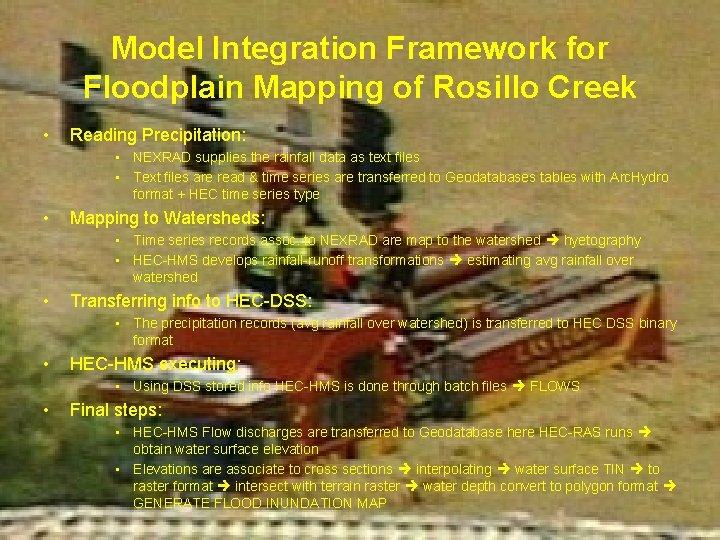
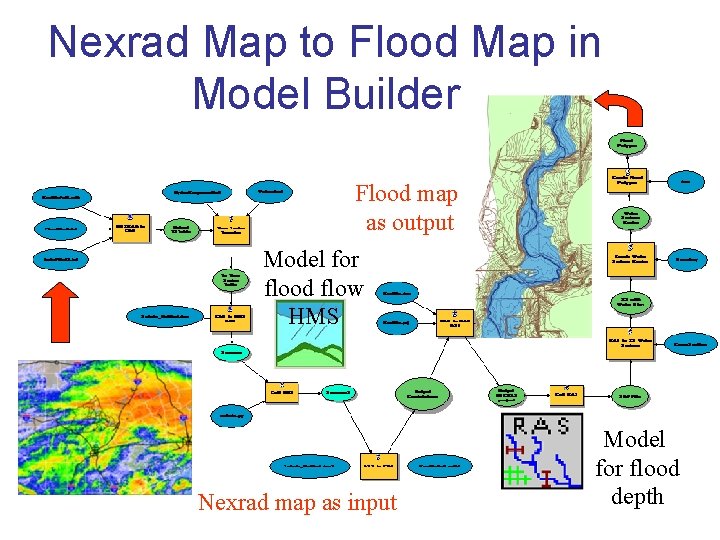
Model Integration Framework for Floodplain Mapping of Rosillo Creek • Reading Precipitation: • NEXRAD supplies the rainfall data as text files • Text files are read & time series are transferred to Geodatabases tables with Arc. Hydro format + HEC time series type • Mapping to Watersheds: • Time series records assoc. to NEXRAD are map to the watershed hyetography • HEC-HMS develops rainfall-runoff transformations estimating avg rainfall over watershed • Transferring info to HEC-DSS: • The precipitation records (avg rainfall over watershed) is transferred to HEC DSS binary format • HEC-HMS executing: • Using DSS stored info HEC-HMS is done through batch files FLOWS • Final steps: • HEC-HMS Flow discharges are transferred to Geodatabase here HEC-RAS runs obtain water surface elevation • Elevations are associate to cross sections interpolating water surface TIN to raster format intersect with terrain raster water depth convert to polygon format GENERATE FLOOD INUNDATION MAP
NEXRAD • NEXRAD stands for Next Generation Weather Radar • NEXRAD is also known as the WSR-88 D (Weather Surveillance Radar 1988 Doppler) • used to warn the people about dangerous weather and its location • 158 operational NEXRAD radar systems deployed throughout the United States and at selected overseas locations • Improves management and surveillance in severe weather and flash flood warnings, air traffic safety, flow control for air traffic and others • Main characteristic is ability to detect wind patterns in storms and provide real time rainfall amounts • Accurate detection of circulations associated with tornadoes and other severe weather phenomena increase advance warning helping save lives and protect property
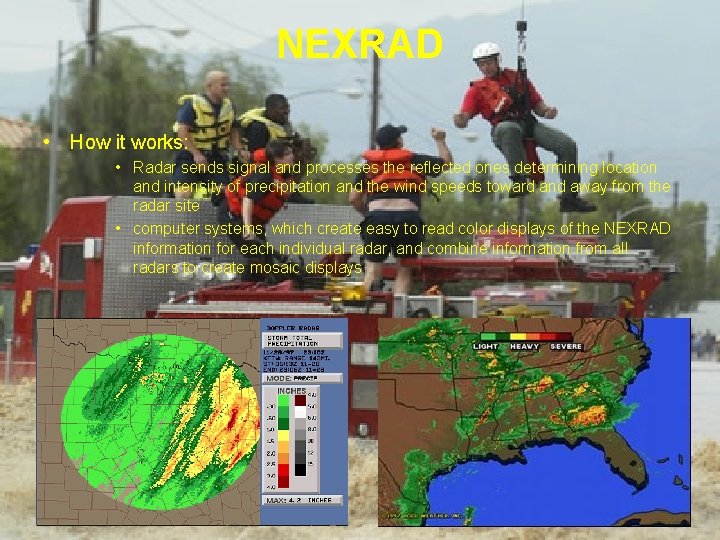
NEXRAD • How it works: • Radar sends signal and processes the reflected ones determining location and intensity of precipitation and the wind speeds toward and away from the radar site • computer systems, which create easy to read color displays of the NEXRAD information for each individual radar, and combine information from all radars to create mosaic displays
Nexrad Map to Flood Map in Model Builder FLO Flood map as output ODP LAIN MAP Model for flood flow HMS Nexrad map as input Model for flood depth
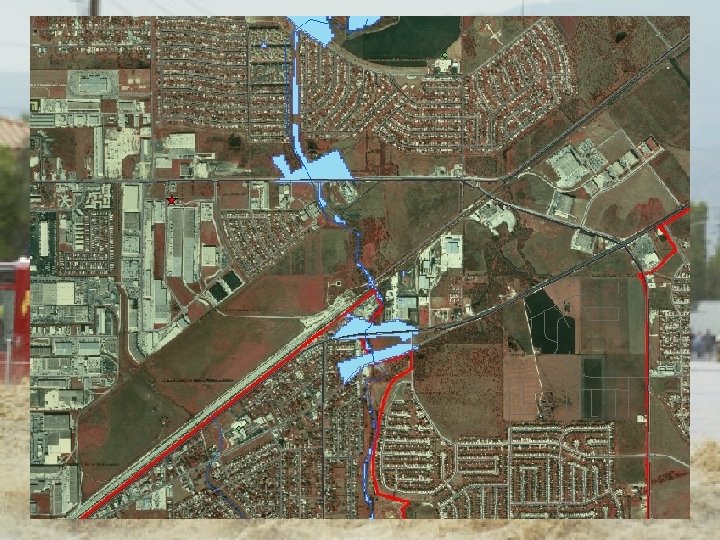
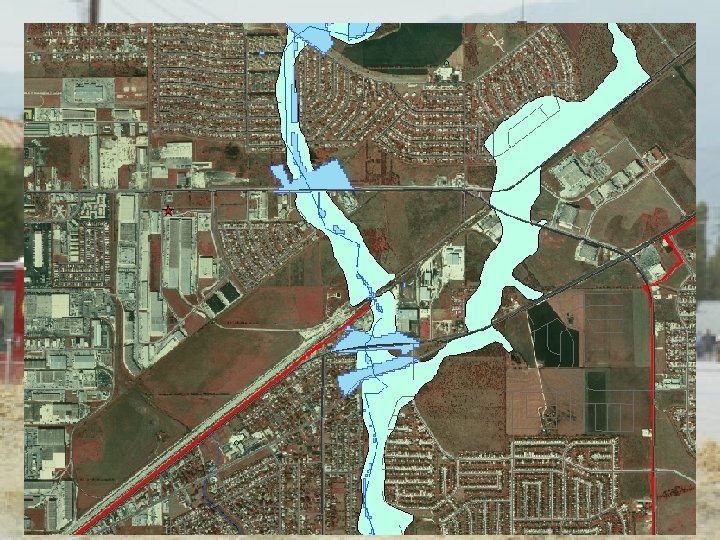
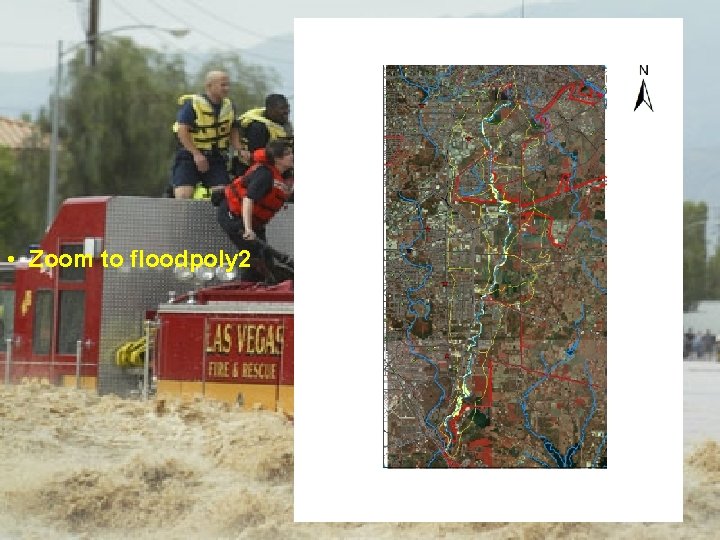
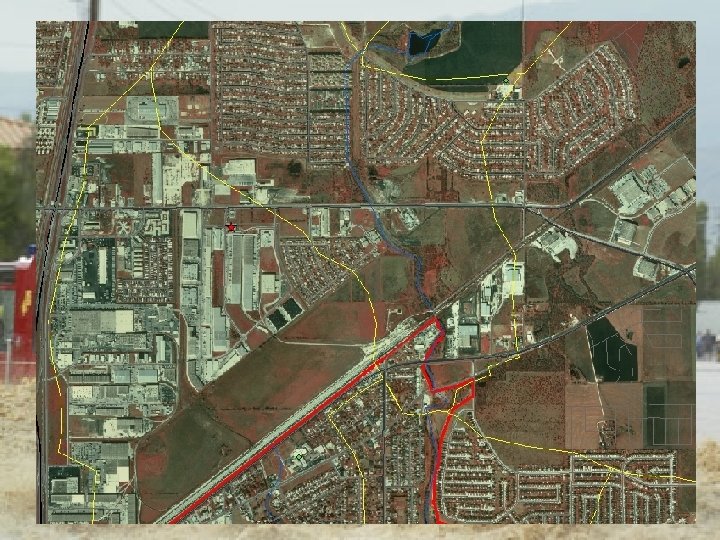
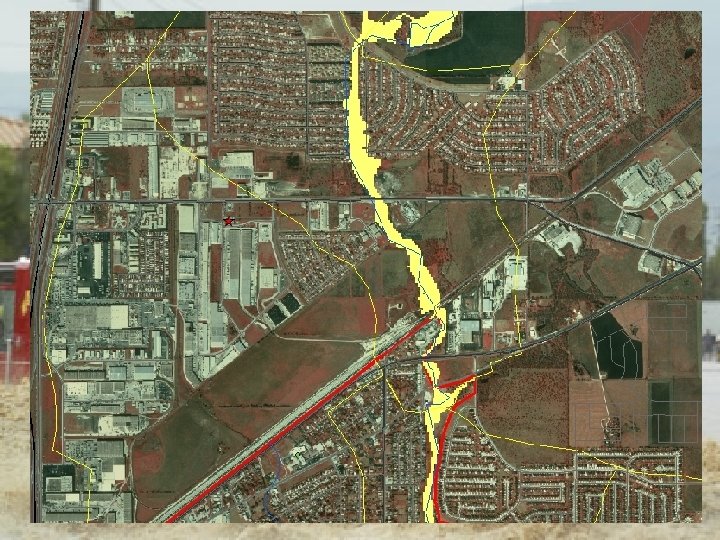
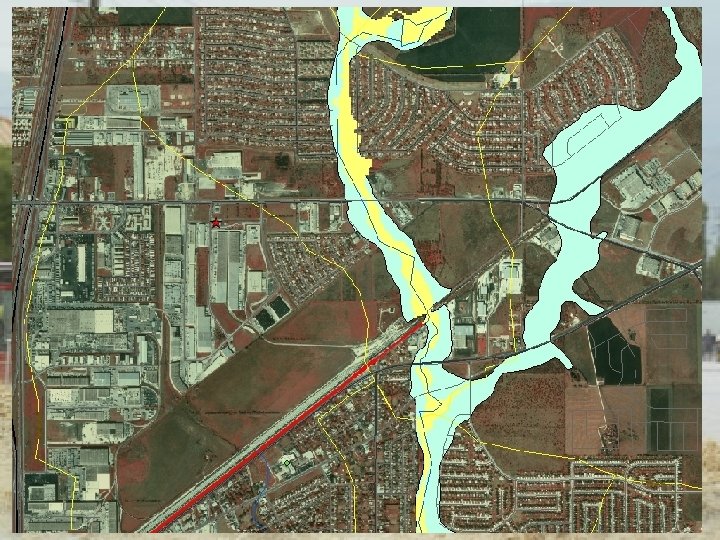
NEXRAD • The flood inundation polygons correspond to the following storm events: • Flood. Poly 1: 01 Jul 2002 at 0400 through 01 Jul 2002 at 2400 • Flood. Poly 2: 14 Jul 2002 at 1700 through 15 Jul 2002 at 1400
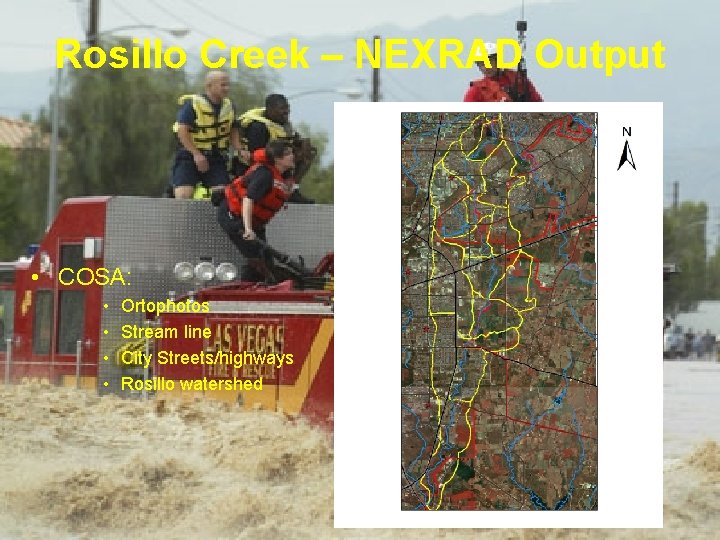
Rosillo Creek – NEXRAD Output • COSA: • • Ortophotos Stream line City Streets/highways Rosillo watershed
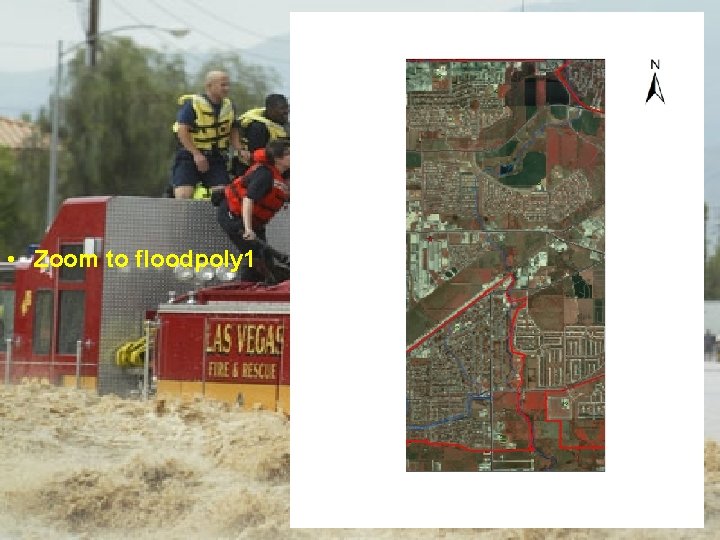
• Zoom to floodpoly 1
• Zoom to floodpoly 2
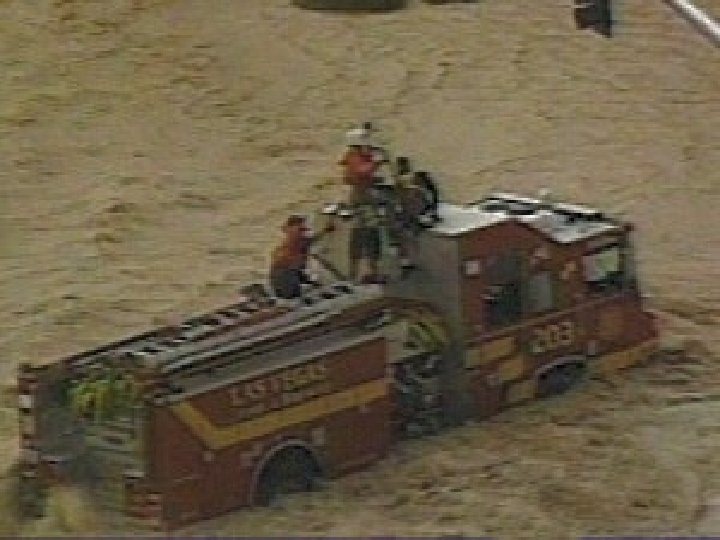
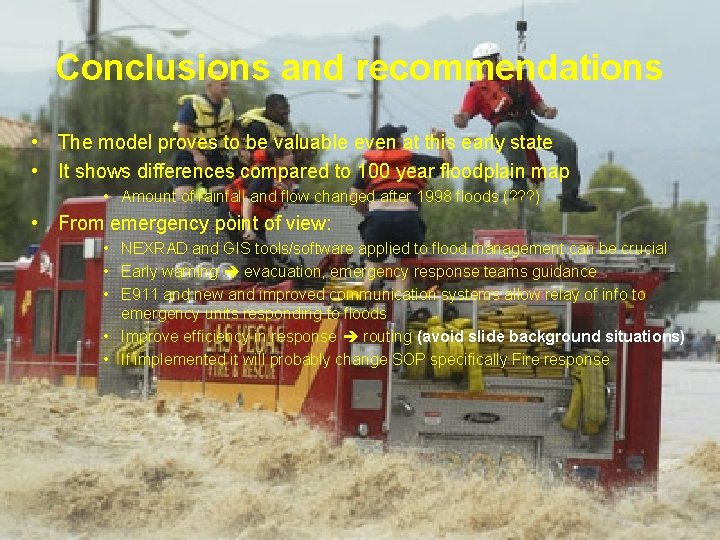
Conclusions and recommendations • The model proves to be valuable even at this early state • It shows differences compared to 100 year floodplain map • Amount of rainfall and flow changed after 1998 floods (? ? ? ) • From emergency point of view: • NEXRAD and GIS tools/software applied to flood management can be crucial • Early warning evacuation, emergency response teams guidance • E 911 and new and improved communication systems allow relay of info to emergency units responding to floods • Improve efficiency in response routing (avoid slide background situations) • If implemented it will probably change SOP specifically Fire response
FUTURE WORK • and what can we do about this for Onion Creek in Austin? • Flood mapping for Onion Creek • Recommendations to emergency response to floods according to mapping • Implement NEXRAD Map to FLOOD Map model by Austin OEM (? ? ? )
ACKNOWLEDGEMENTS • Professor David Maidment, UT • Oscar Robayo, UT • Ross Clark, COA Watershed Protection & Development Review Department • Christine Thies, Austin Fire Department GIS-Planning Office