Questions Questions Questions Math 2 Warm Up In


![Finding a Quadratic Model Regression Method 1) Turn on plot: Press [2 nd] [Y=].](https://slidetodoc.com/presentation_image/268dd2496e95d85410556a811fd422fe/image-34.jpg "Finding a Quadratic Model Regression Method 1) Turn on plot: Press [2 nd] [Y=].")
![Finding a Quadratic Model Regression Method 3) Enter data values: Press [STAT] then [ENTER]](https://slidetodoc.com/presentation_image/268dd2496e95d85410556a811fd422fe/image-35.jpg "Finding a Quadratic Model Regression Method 3) Enter data values: Press [STAT] then [ENTER]")
 Find quadratic equation to fit data: Press")


 (m/s)")


 and")


- Slides: 47
Questions?
Questions?
Questions?
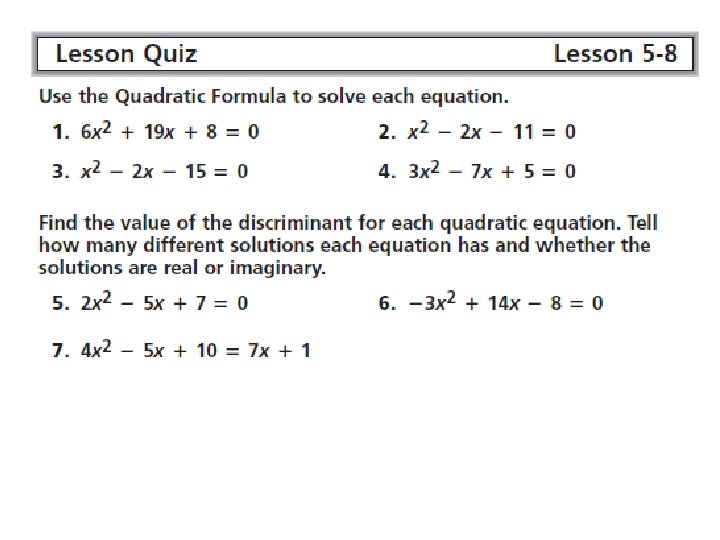
Math 2 Warm Up In the Algebra 2 Practice Workbook, Practice 5 -8 (p. 70) Solve: #50 -64 even, 24, 30, 39 Discriminant: #1, 4, 7, 49
Questions?
Unit 4: “Quadratic Functions” Solving Quadratic Equations: By Graphing Objective: To solve quadratic equations and systems of equations that contain at least one quadratic functions by graphing. v When the graph of a function intersects the x-axis, the y-value of the function is 0. v The solutions of the quadratic equation ax 2 + bx + c = 0 are the x-intercepts of the graph of y = ax 2 + bx + c. v The solutions are also called “zeros of the function” or “roots of the function”.
Solve Quadratic Equations by Graphing ax 2 + bx + c = 0 Solution
Solve Quadratic Equations by Graphing q Step 1: Quadratic equation must equal 0! ax 2 + bx + c = 0 q Step 2: Press [Y=]. Enter the quadratic function into Y 1. Enter 0 into Y 2. Press [Graph]. MAKE SURE BOTH X-INTERCEPTS ARE ON SCREEN! “ZOOM OUT” OR “ZOOM IN” IF NEEDED! q Step 3: Find the intersection of y = ax 2 + bx + c and y = 0. Press [2 nd] [Trace]. Select [5: Intersection]. First Curve? Press [Enter], Second Curve? Press [Enter], Guess? Using left and right arrows, move the cursor to one of the x-intercepts then press [Enter] a 3 rd time. q Step 4: Repeat Step 3 for the second x-intercept!
Solve by Graphing
Solve by Graphing
Solve by Graphing
Solve by Graphing
Solve by Graphing
Solve by Graphing*
Solve by Graphing*
Solve by Graphing*
Solve by Graphing*
Solve a System with a Quadratic Equation A system of equations is a set of two or more equations that use the same variables. A solution of a system of equations is the set of values for the variables that makes ALL the equations true. On a graph: the solutions of a system is any point (x, y) where ALL the graphs of the functions in the system intersect. Solutions
Solve a System with a Quadratic Equation
Solve a System with a Quadratic Equation
Solve a System with a Quadratic Equation
Solve a System with a Quadratic Equation
Solve a System with Quadratic Equations
Solve a System with Quadratic Equations
Solve a System with Quadratic Equations
Honors Math 2 Assignment In the Algebra 2 textbook, pp. 266 -268 #20 -31, 54 -56, 67 -69 Solve each quadratic equation or system by graphing on the calculator. Round answers to the nearest hundredth. TURN IN WHEN FINISHED!
Math 2 Assignment In the Algebra 2 textbook, pp. 266 -268 #20 -31, 54 -56, 67 -69 Solve each quadratic equation or system by graphing on the calculator. Round answers to the nearest hundredth. TURN IN WHEN FINISHED!
Math 2 Warm Up Part 1 Finish pp. 266 -268 #20 -31, 54 -56, 67 -69 Round answers to the nearest hundredth. Turn in TEST REVIEW FOLDER when finished. Part 2 In the Algebra 2 Practice Workbook, Practice 5 -5 (p. 64) #4, 14, 33, 45, 50, 57, 59, 68, 69, 70 Solve by Graphing! Round answers to nearest hundredth.
Questions?
Unit 4: “Quadratic Functions” Modeling Data with Quadratic Equations Objective: To model a set of data with a quadratic function. Graph: (-5, 6), (-4, 1), (-2, -3) (-1, -2), (0, 1) Graph: (-3, -4), (2, 1), (3, 8)
Finding a Quadratic Model Substitution Method •
Finding a Quadratic Model Regression Method 1) Turn on plot: Press [2 nd] [Y=]. Press [ENTER] to select Plot 1. Highlight “On”, Press [ENTER]. 2) Turn on diagnostic: Press [2 nd] [0] for catalog. Scroll down to Diagonstic. On. Press [ENTER] to select. Press [ENTER] again to activate.
Finding a Quadratic Model Regression Method 3) Enter data values: Press [STAT] then [ENTER] for EDIT menu, Enter x-values in L 1, Enter y-values in L 2. Clear Lists (if needed): Highlight L 1 or L 2 at top. Press [CLEAR], [ENTER]. 4) Graph a scatter plot: Press [ZOOM] Select [9: Zoom. Stat]
Finding a Quadratic Model Regression Method 5) Find quadratic equation to fit data: Press [STAT], over to CALC menu, Select [5: Quad. Reg] Press [ENTER] 4 times, then Calculate [ENTER]. Write quadratic equation using the values of a, b, and c rounded to the nearest thousandths (if needed). Write down the R 2 value!
• is a statistical measure of how close the data values are to the “fitted” regression model. • the value of R 2 is between 0 and 1 (0 ≤ R 2 ≤ 1). • If R 2 = 1, then ALL the data points “fit” the regression equation. • If R 2 = 0, then NONE of the data points “fit” the regression equation. v The higher the R 2 value, the better the regression equation “fits” the data.
Find a quadratic equation to model the values in the table. x -3 2 3 y -4 1 8
Find a quadratic equation to model the values in the table. x 2 3 4 y 3 13 29
Find a quadratic equation to model the values in the table. x -5 0 2 y -18 7 -9
Find a quadratic equation to model the values in the table. x -2 1 5 7 y 27 10 -6 8
Apply! The table shows data about Wavelength Wave Speed the wavelength (in meters) (m/s) and the wave speed (in meters 3 6 per second) of deep water ocean waves. 5 16 a) Find a quadratic equation to 7 31 model the data. 8 b) Find the wave speed of a deep water wave that has a wavelength of 6 meters. 40
Apply! The table at the right shows the height of a column of water (in millimeters) as it drains from its container. a) Find a quadratic equation to model the data. b) Find the water level at 25 seconds. c) Find the water level at 90 seconds. d) Find the water level at 3 minutes.
Apply! The table gives the number of millions of US cell phone subscribers since 1998. a) Find a quadratic equation to model the data. b) In what year will the numbers of subscribers exceed 170, 000? Year Subscribers (in millions) 1998 1999 2000 2001 2002 69 86 109 128 140
Apply! A study compared the speed Speed Fuel Economy (in miles per hour) and the (miles per hour) (miles per gal) average fuel economy (in mile 20 25. 5 per gallon) for a midsize car. 30 29. 1 The data is shown in the table at the right. 40 30. 0 a) Find a quadratic model to 50 30. 2 represent the data. 60 28. 8 70 25. 7 b) Find the speed that maximizes the fuel economy.
Honors Math 2 Assignment In the Algebra 2 textbook, pp. 237 -238 #16 -22, 30, 31, 38 Write down the R² value for each equation! TURN IN WHEN FINISHED!
Math 2 Assignment In the Algebra 2 textbook, pp. 237 -238 #16 -22, 30, 31, 38 Write down the R² value for each equation! TURN IN WHEN FINISHED!