PRINCIPLES OF MACROECONOMICS 2 e Chapter 6 The

- Slides: 34
PRINCIPLES OF MACROECONOMICS 2 e Chapter 6 The Macroeconomic Perspective Power. Point Image Slideshow
CH. 6 OUTLINE 6. 1: Measuring the Size of the Economy: Gross Domestic Product 6. 2: Adjusting Nominal Values to Real Values 6. 3: Tracking Real GDP over Time 6. 4: Comparing GDP among Countries 6. 5: How Well GDP Measures the Well-Being of Society
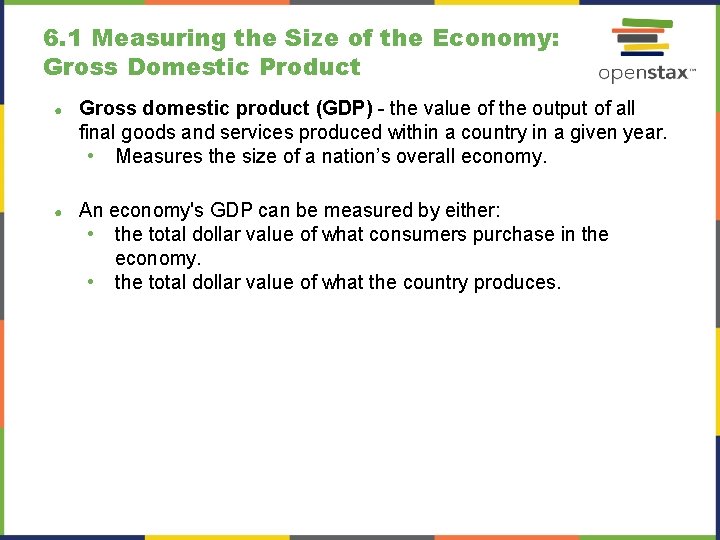
6. 1 Measuring the Size of the Economy: Gross Domestic Product ● Gross domestic product (GDP) - the value of the output of all final goods and services produced within a country in a given year. • Measures the size of a nation’s overall economy. ● An economy's GDP can be measured by either: • the total dollar value of what consumers purchase in the economy. • the total dollar value of what the country produces.
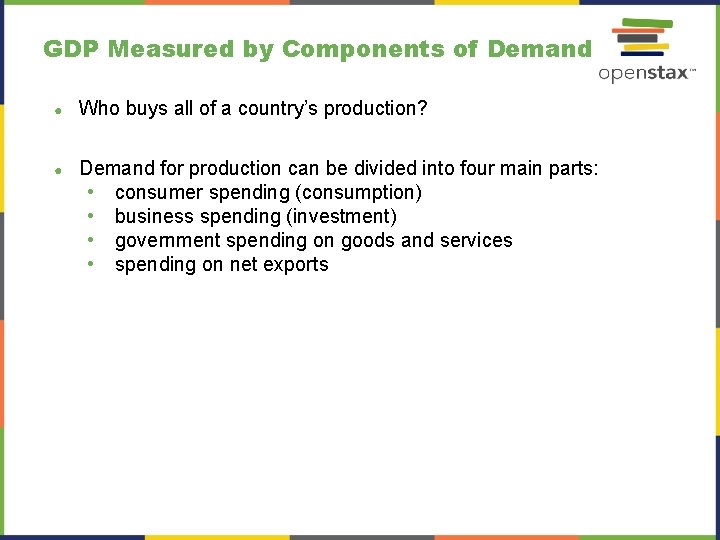
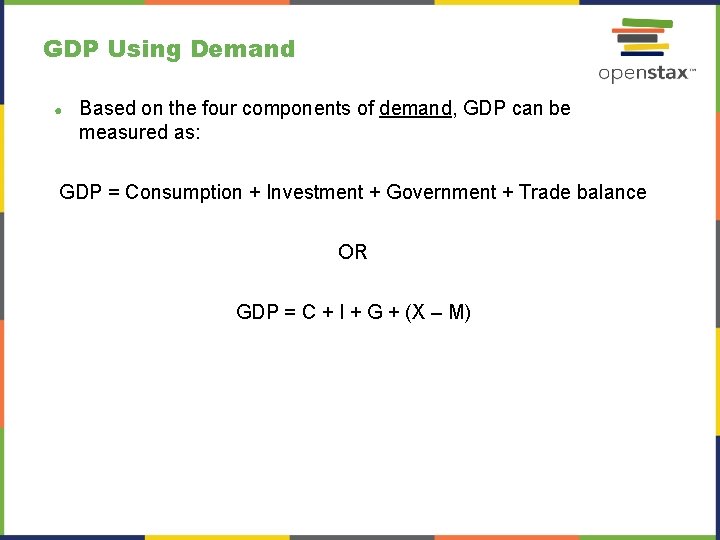
GDP Measured by Components of Demand ● Who buys all of a country’s production? ● Demand for production can be divided into four main parts: • consumer spending (consumption) • business spending (investment) • government spending on goods and services • spending on net exports
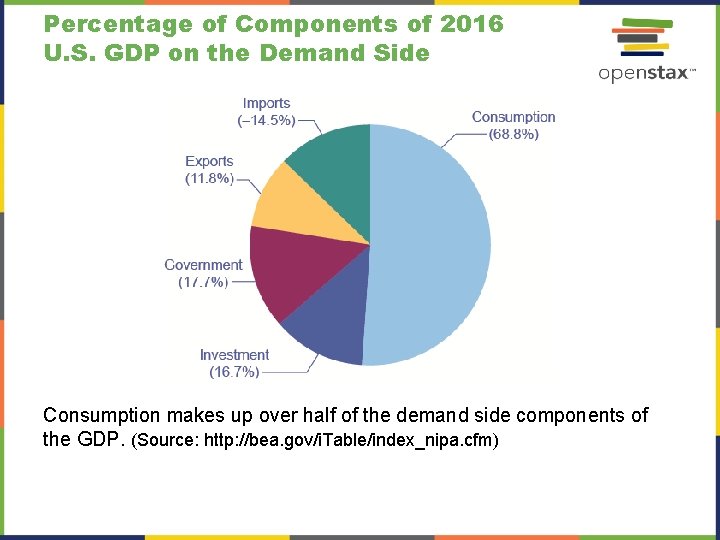
Percentage of Components of 2016 U. S. GDP on the Demand Side Consumption makes up over half of the demand side components of the GDP. (Source: http: //bea. gov/i. Table/index_nipa. cfm)
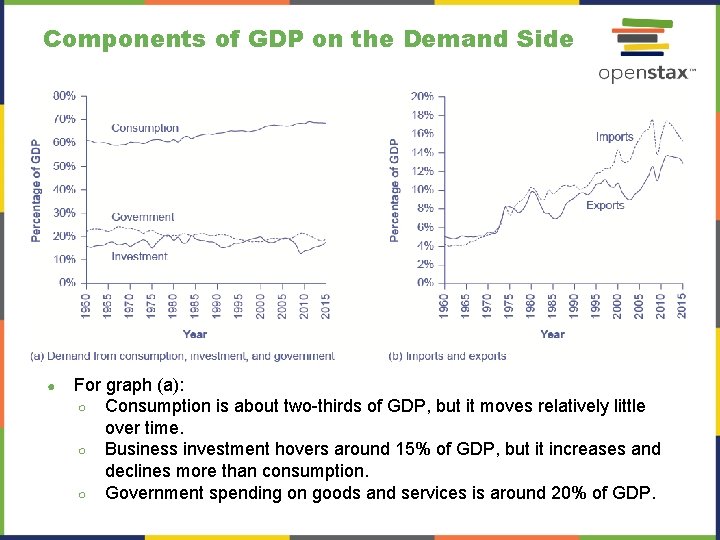
Components of GDP on the Demand Side ● For graph (a): ○ Consumption is about two-thirds of GDP, but it moves relatively little over time. ○ Business investment hovers around 15% of GDP, but it increases and declines more than consumption. ○ Government spending on goods and services is around 20% of GDP.
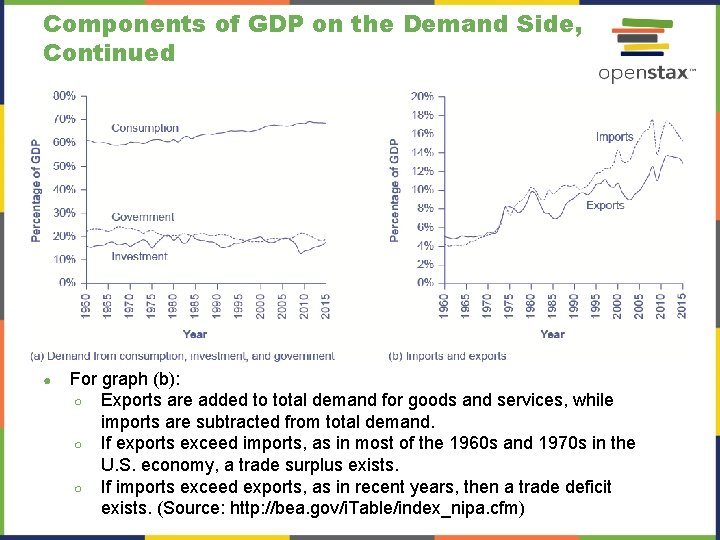
Components of GDP on the Demand Side, Continued ● For graph (b): ○ Exports are added to total demand for goods and services, while imports are subtracted from total demand. ○ If exports exceed imports, as in most of the 1960 s and 1970 s in the U. S. economy, a trade surplus exists. ○ If imports exceed exports, as in recent years, then a trade deficit exists. (Source: http: //bea. gov/i. Table/index_nipa. cfm)
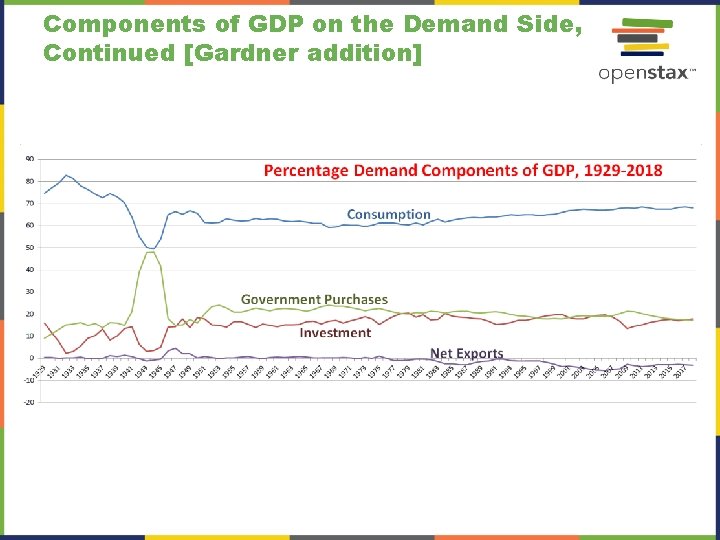
Components of GDP on the Demand Side, Continued [Gardner addition]
Net Export Component ● The GDP net export component, or trade balance, is equal to the dollar value of exports (X) minus the dollar value of imports (M). ● Trade balance - the gap between exports and imports. • Trade balance = (X – M) ● Trade surplus - when a country’s exports are larger than its imports; calculated as exports – imports. ● Trade deficit - when a country’s imports exceed exports; calculated as imports – exports.
GDP Using Demand ● Based on the four components of demand, GDP can be measured as: GDP = Consumption + Investment + Government + Trade balance OR GDP = C + I + G + (X – M)
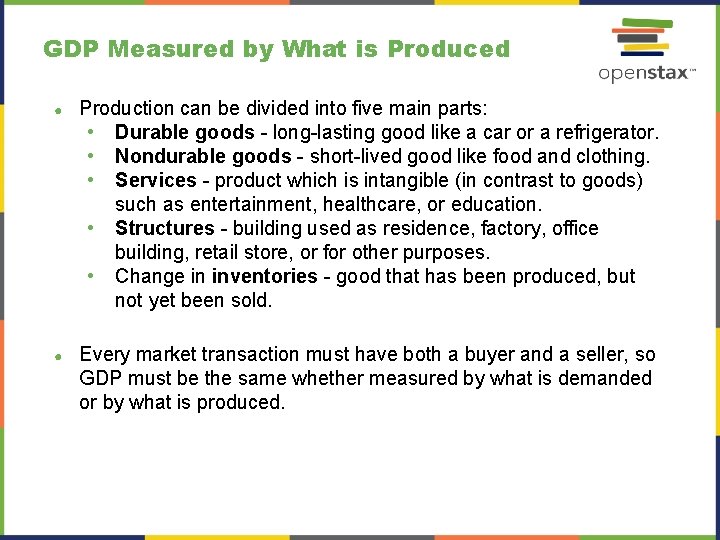
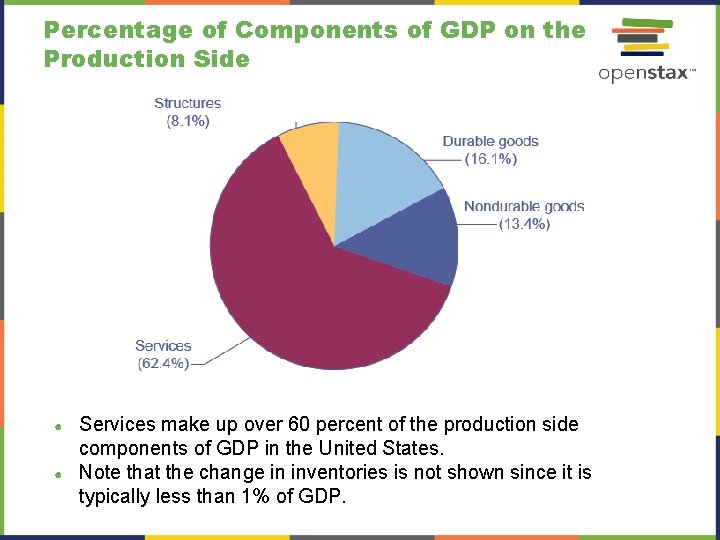
GDP Measured by What is Produced ● Production can be divided into five main parts: • Durable goods - long-lasting good like a car or a refrigerator. • Nondurable goods - short-lived good like food and clothing. • Services - product which is intangible (in contrast to goods) such as entertainment, healthcare, or education. • Structures - building used as residence, factory, office building, retail store, or for other purposes. • Change in inventories - good that has been produced, but not yet been sold. ● Every market transaction must have both a buyer and a seller, so GDP must be the same whether measured by what is demanded or by what is produced.
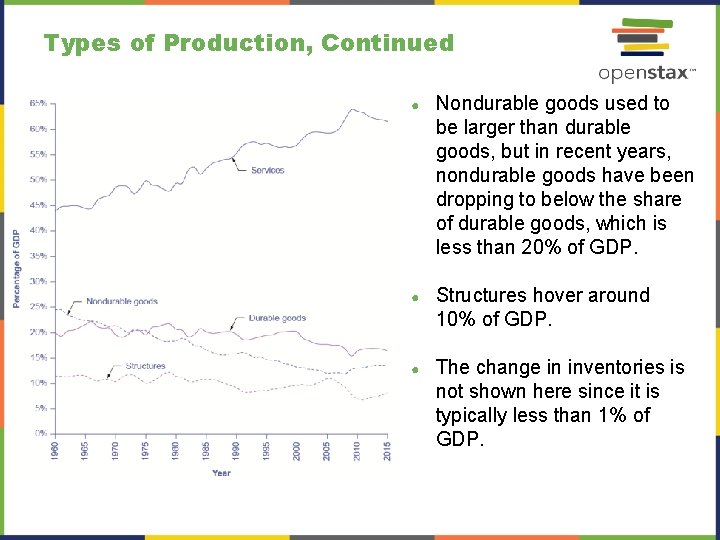
Percentage of Components of GDP on the Production Side ● ● Services make up over 60 percent of the production side components of GDP in the United States. Note that the change in inventories is not shown since it is typically less than 1% of GDP.
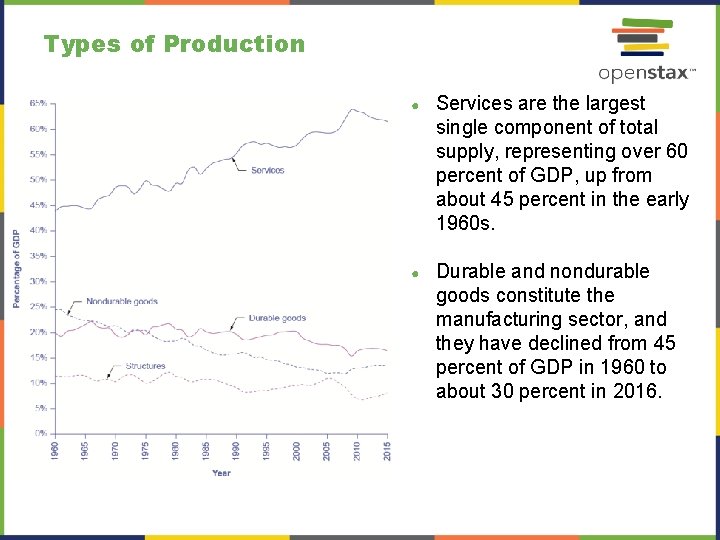
Types of Production ● Services are the largest single component of total supply, representing over 60 percent of GDP, up from about 45 percent in the early 1960 s. ● Durable and nondurable goods constitute the manufacturing sector, and they have declined from 45 percent of GDP in 1960 to about 30 percent in 2016.
Types of Production, Continued ● Nondurable goods used to be larger than durable goods, but in recent years, nondurable goods have been dropping to below the share of durable goods, which is less than 20% of GDP. ● Structures hover around 10% of GDP. ● The change in inventories is not shown here since it is typically less than 1% of GDP.
The Problem of Double Counting ● ● Final goods and services - output used directly for consumption, investment, government, and trade purposes. • Goods at the furthest stage of production at the end of a year. -vs. Intermediate goods - output provided to other businesses at an intermediate stage of production, not for final users. • Excluded from GDP calculation. ● Double counting - output that is counted more than once as it travels through the stages of production. • A potential mistake to avoid in measuring GDP. ● GDP is the dollar value of all final goods and services produced in the economy in a year.
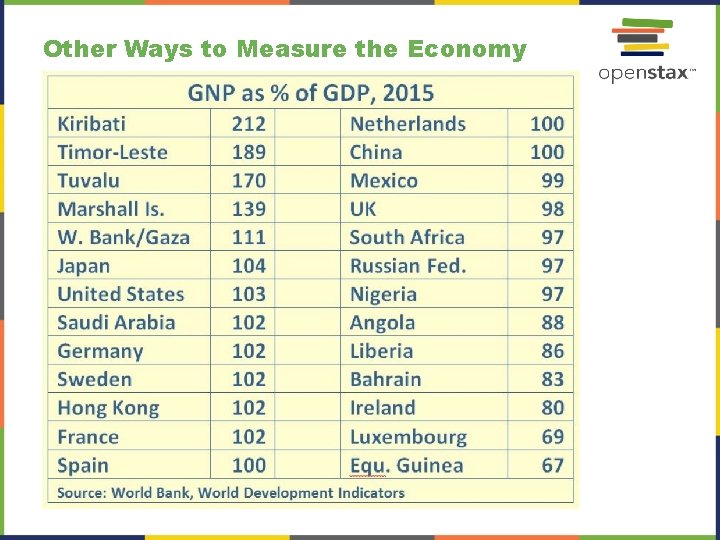
Other Ways to Measure the Economy ● Gross national product (GNP) - includes what is produced domestically and what is produced by domestic labor and business abroad in a year. (see next page) ● Net national product (NNP) - GNP minus the value of depreciation. ● Depreciation - the process by which capital ages over time and therefore loses its value. ● NNP can be further subdivided into national income - includes all income earned: wages, profits, rent, and profit income.
Other Ways to Measure the Economy
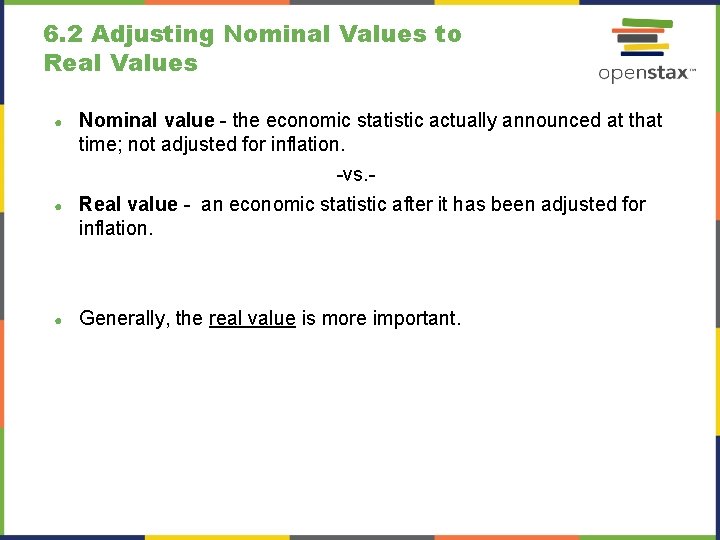
6. 2 Adjusting Nominal Values to Real Values ● Nominal value - the economic statistic actually announced at that time; not adjusted for inflation. ● -vs. Real value - an economic statistic after it has been adjusted for inflation. ● Generally, the real value is more important.
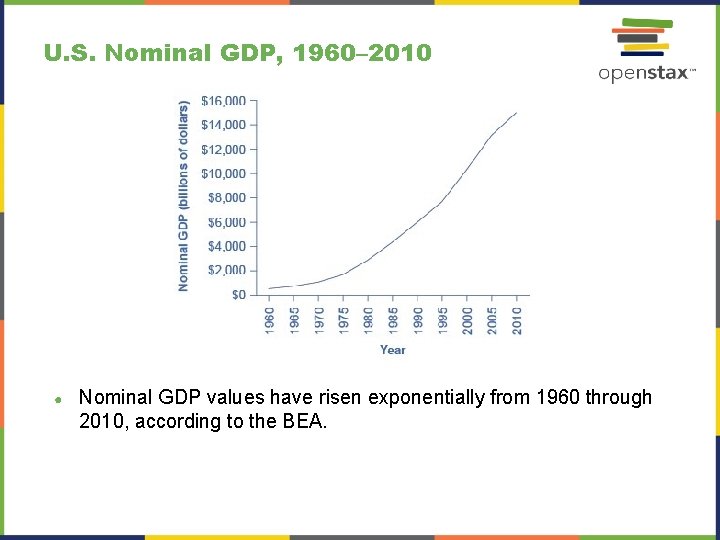
U. S. Nominal GDP, 1960– 2010 ● Nominal GDP values have risen exponentially from 1960 through 2010, according to the BEA.
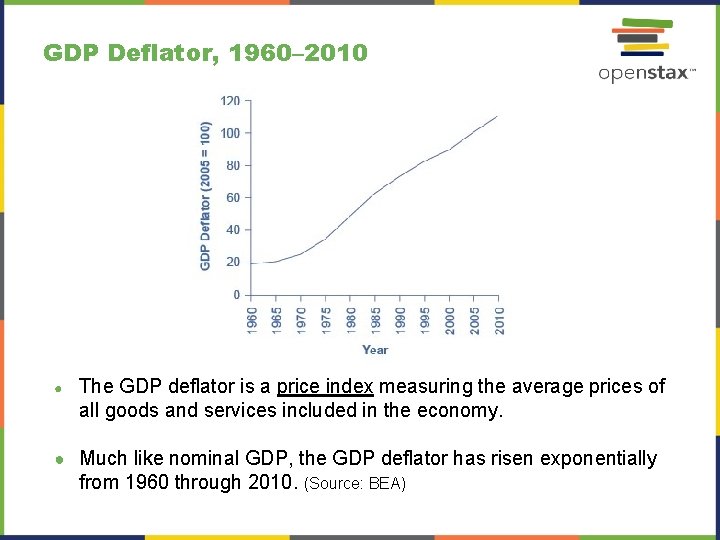
GDP Deflator, 1960– 2010 ● The GDP deflator is a price index measuring the average prices of all goods and services included in the economy. ● Much like nominal GDP, the GDP deflator has risen exponentially from 1960 through 2010. (Source: BEA)
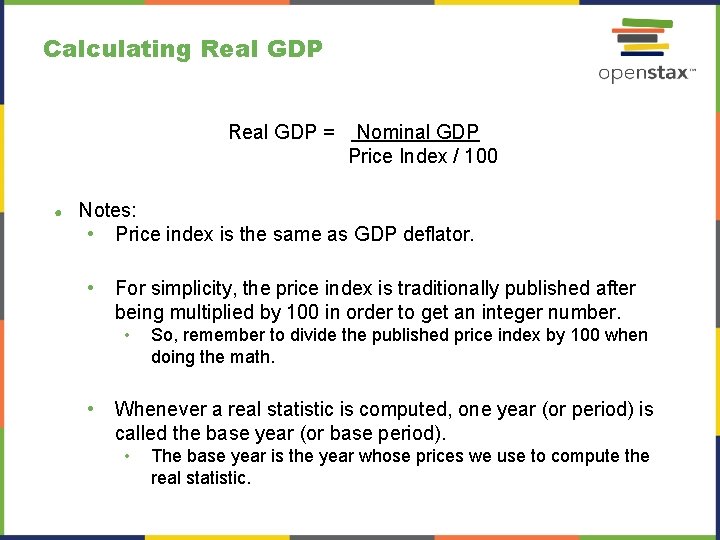
Calculating Real GDP = ● Nominal GDP Price Index / 100 Notes: • Price index is the same as GDP deflator. • For simplicity, the price index is traditionally published after being multiplied by 100 in order to get an integer number. • • So, remember to divide the published price index by 100 when doing the math. Whenever a real statistic is computed, one year (or period) is called the base year (or base period). • The base year is the year whose prices we use to compute the real statistic.
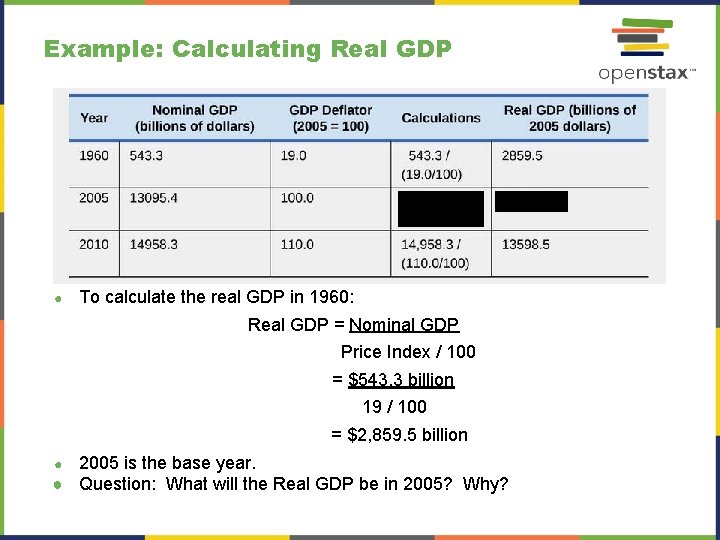
Example: Calculating Real GDP ● To calculate the real GDP in 1960: Real GDP = Nominal GDP Price Index / 100 = $543. 3 billion 19 / 100 = $2, 859. 5 billion 2005 is the base year. ● Question: What will the Real GDP be in 2005? Why? ●
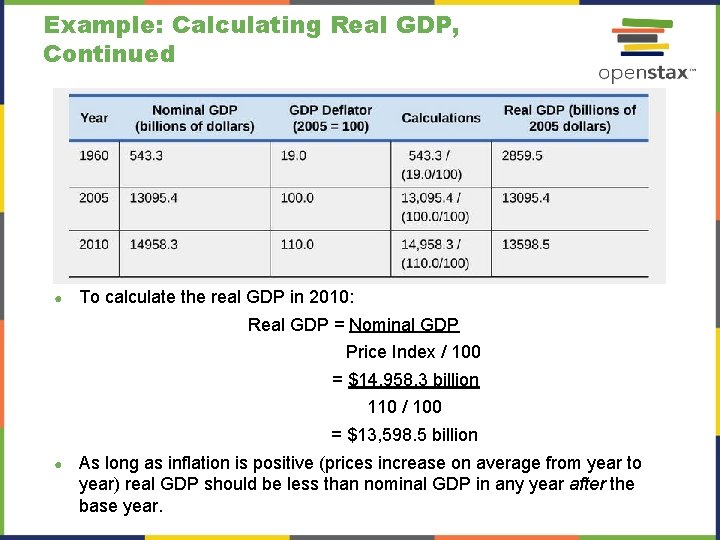
Example: Calculating Real GDP, Continued ● To calculate the real GDP in 2010: Real GDP = Nominal GDP Price Index / 100 = $14, 958. 3 billion 110 / 100 = $13, 598. 5 billion ● As long as inflation is positive (prices increase on average from year to year) real GDP should be less than nominal GDP in any year after the base year.
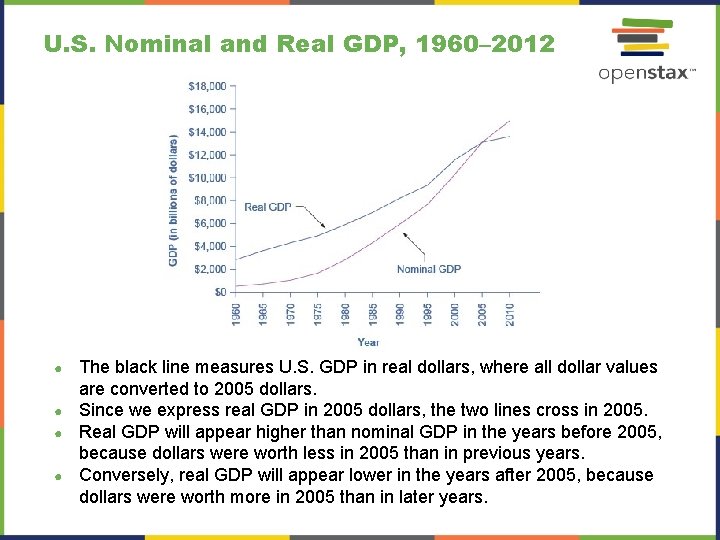
U. S. Nominal and Real GDP, 1960– 2012 The black line measures U. S. GDP in real dollars, where all dollar values are converted to 2005 dollars. ● Since we express real GDP in 2005 dollars, the two lines cross in 2005. ● Real GDP will appear higher than nominal GDP in the years before 2005, because dollars were worth less in 2005 than in previous years. ● Conversely, real GDP will appear lower in the years after 2005, because dollars were worth more in 2005 than in later years. ●
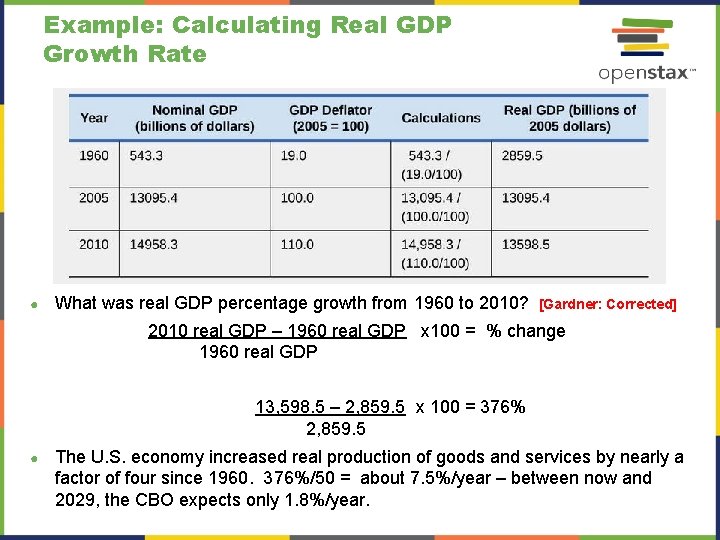
Example: Calculating Real GDP Growth Rate ● What was real GDP percentage growth from 1960 to 2010? [Gardner: Corrected] 2010 real GDP – 1960 real GDP x 100 = % change 1960 real GDP 13, 598. 5 – 2, 859. 5 x 100 = 376% 2, 859. 5 ● The U. S. economy increased real production of goods and services by nearly a factor of four since 1960. 376%/50 = about 7. 5%/year – between now and 2029, the CBO expects only 1. 8%/year.
6. 3 Tracking Real GDP over Time ● Governments report GDP growth as an annualized rate. • When analyzing growth in a quarter, the calculated growth in real GDP for the quarter is multiplied by four when it is reported (as if the economy were growing at that rate for a full year). ● Recession - a significant decline in national output/GDP. ● Depression - an especially lengthy and deep decline in output.
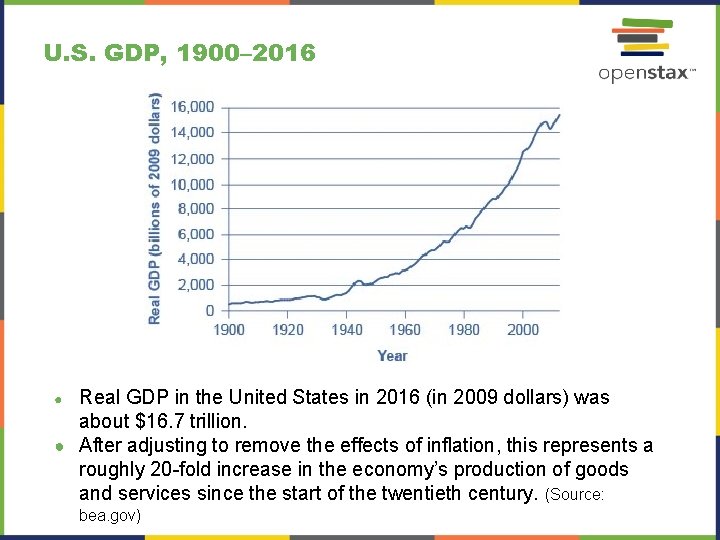
U. S. GDP, 1900– 2016 Real GDP in the United States in 2016 (in 2009 dollars) was about $16. 7 trillion. ● After adjusting to remove the effects of inflation, this represents a roughly 20 -fold increase in the economy’s production of goods and services since the start of the twentieth century. (Source: ● bea. gov)
Patterns of Recessions and Expansions ● Peak - during the business cycle, the highest point of output before a recession begins. ● Trough - during the business cycle, the lowest point of output in a recession, before a recovery begins. ● A recession lasts from peak to trough, and an economic upswing runs from trough to peak. ● Business cycle - the economy's relatively short-term movement in and out of recession ● “Official” dates are set by the National Bureau of Economic Research – look here
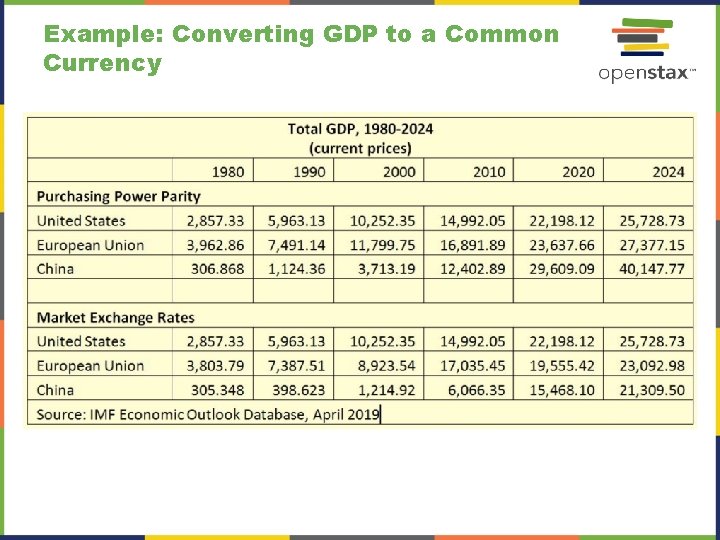
6. 4 Comparing GDP among Countries ● To compare the GDP of countries with different currencies, it is necessary to convert to a “common denominator” using an exchange rate. ● [Market] Exchange rate - the value or price of one currency in terms of another currency. Purchasing Power Parity Exchange Rate – a calculated, imaginary exchange rate that would allow an amount of money, say $100, buy the same collection of goods in another country and currency. The Big Mac Index of international prices is a simplified example. [Gardner additions] ● ●
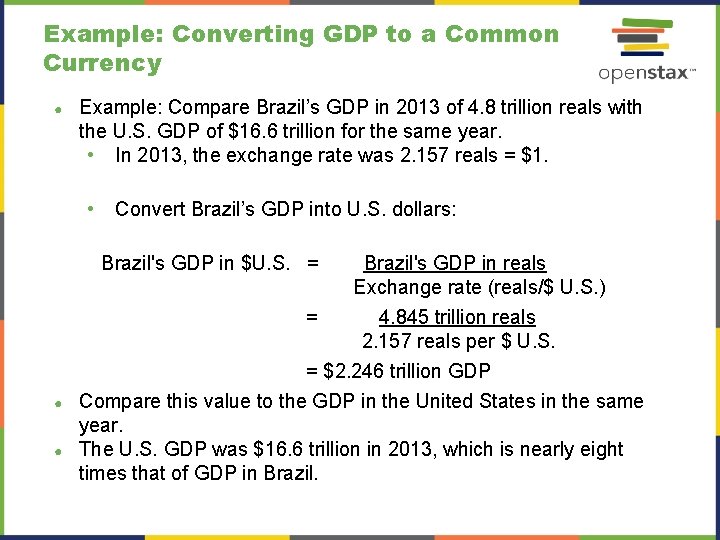
Example: Converting GDP to a Common Currency ● Example: Compare Brazil’s GDP in 2013 of 4. 8 trillion reals with the U. S. GDP of $16. 6 trillion for the same year. • In 2013, the exchange rate was 2. 157 reals = $1. • Convert Brazil’s GDP into U. S. dollars: Brazil's GDP in $U. S. = ● ● Brazil's GDP in reals Exchange rate (reals/$ U. S. ) = 4. 845 trillion reals 2. 157 reals per $ U. S. = $2. 246 trillion GDP Compare this value to the GDP in the United States in the same year. The U. S. GDP was $16. 6 trillion in 2013, which is nearly eight times that of GDP in Brazil.
Example: Converting GDP to a Common Currency
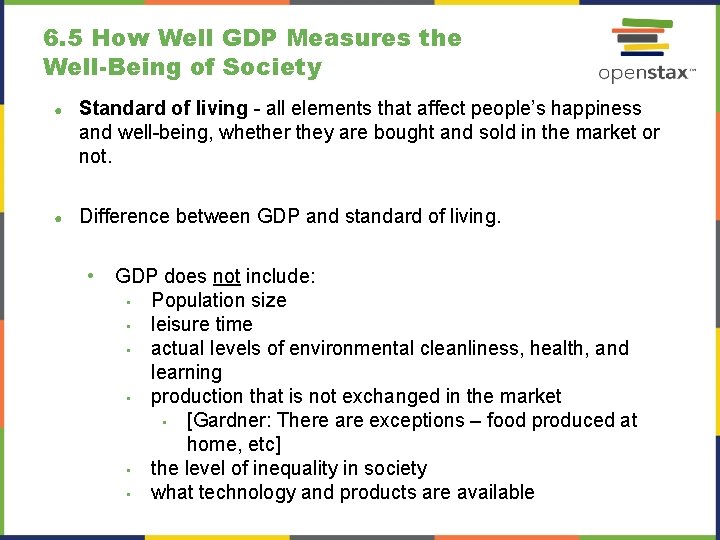
6. 5 How Well GDP Measures the Well-Being of Society ● Standard of living - all elements that affect people’s happiness and well-being, whether they are bought and sold in the market or not. ● Difference between GDP and standard of living. • GDP does not include: • Population size • leisure time • actual levels of environmental cleanliness, health, and learning • production that is not exchanged in the market • [Gardner: There are exceptions – food produced at home, etc] • the level of inequality in society • what technology and products are available
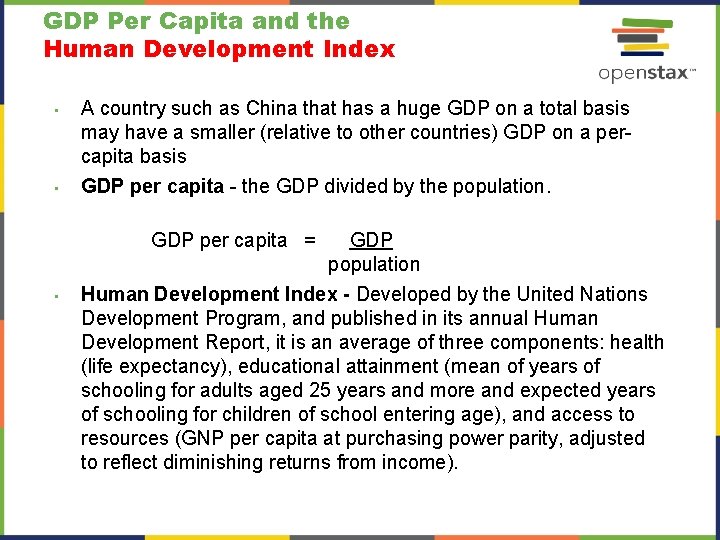
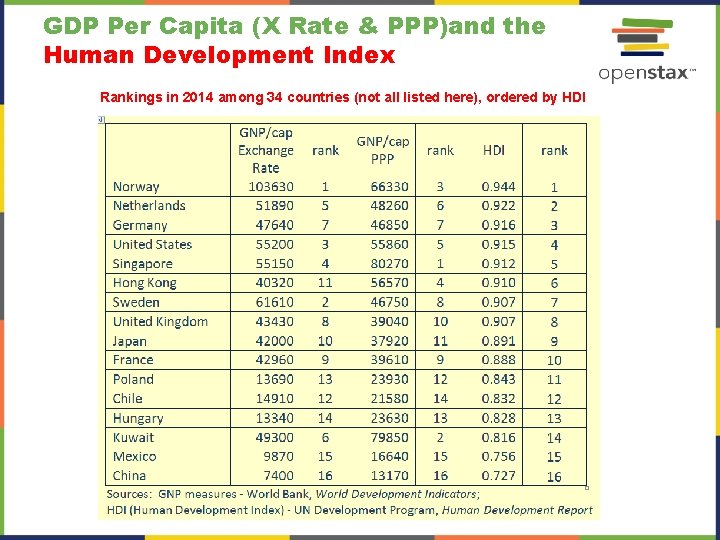
GDP Per Capita and the Human Development Index • • A country such as China that has a huge GDP on a total basis may have a smaller (relative to other countries) GDP on a percapita basis GDP per capita - the GDP divided by the population. GDP per capita = • GDP population Human Development Index - Developed by the United Nations Development Program, and published in its annual Human Development Report, it is an average of three components: health (life expectancy), educational attainment (mean of years of schooling for adults aged 25 years and more and expected years of schooling for children of school entering age), and access to resources (GNP per capita at purchasing power parity, adjusted to reflect diminishing returns from income).
GDP Per Capita (X Rate & PPP)and the Human Development Index Rankings in 2014 among 34 countries (not all listed here), ordered by HDI