Price Discovery Share An Order Invariant Measure of
- Slides: 28
Price Discovery Share: An Order Invariant Measure of Price Discovery with Application to Exchange-Traded Funds By Syed Galib Sultan University of Washington and Eric Zivot University of Washington
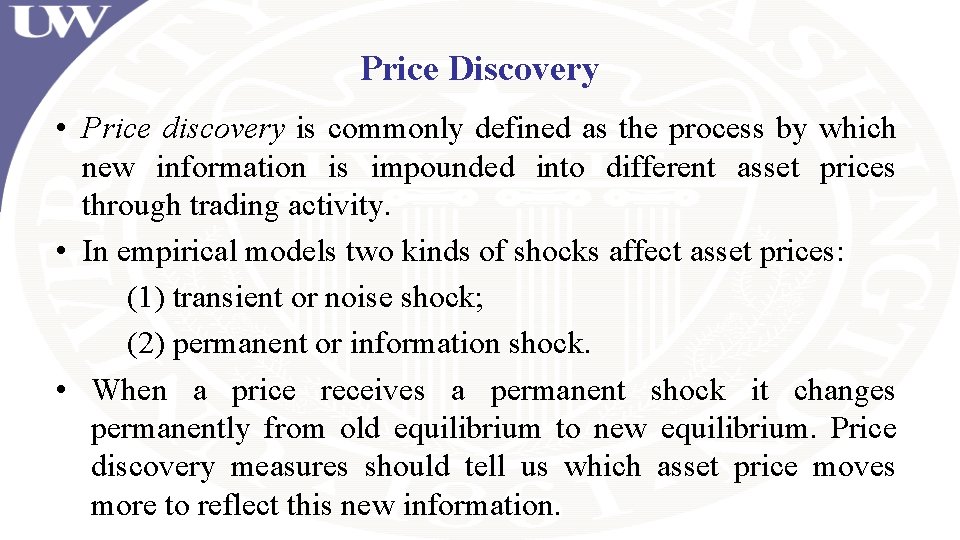
Price Discovery • Price discovery is commonly defined as the process by which new information is impounded into different asset prices through trading activity. • In empirical models two kinds of shocks affect asset prices: (1) transient or noise shock; (2) permanent or information shock. • When a price receives a permanent shock it changes permanently from old equilibrium to new equilibrium. Price discovery measures should tell us which asset price moves more to reflect this new information.
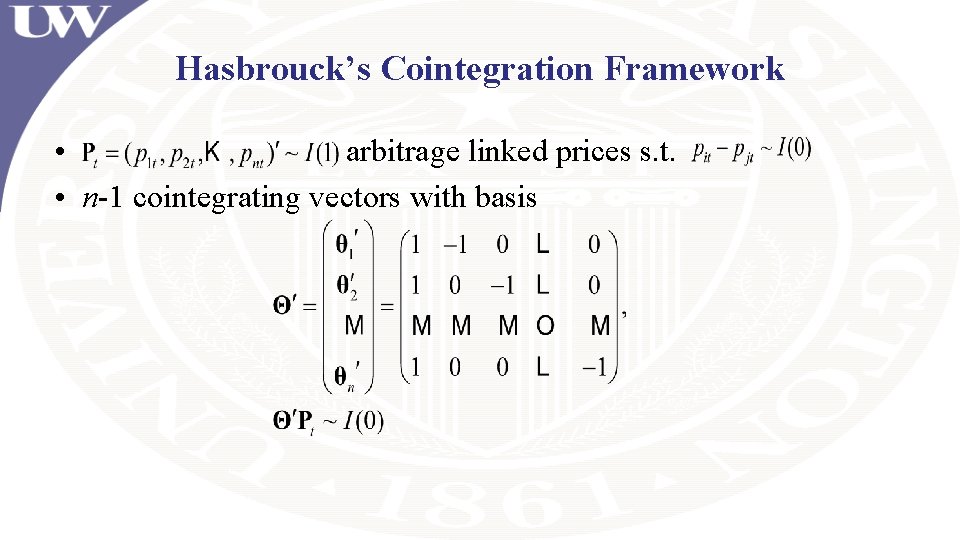
Hasbrouck’s Cointegration Framework • arbitrage linked prices s. t. • n-1 cointegrating vectors with basis
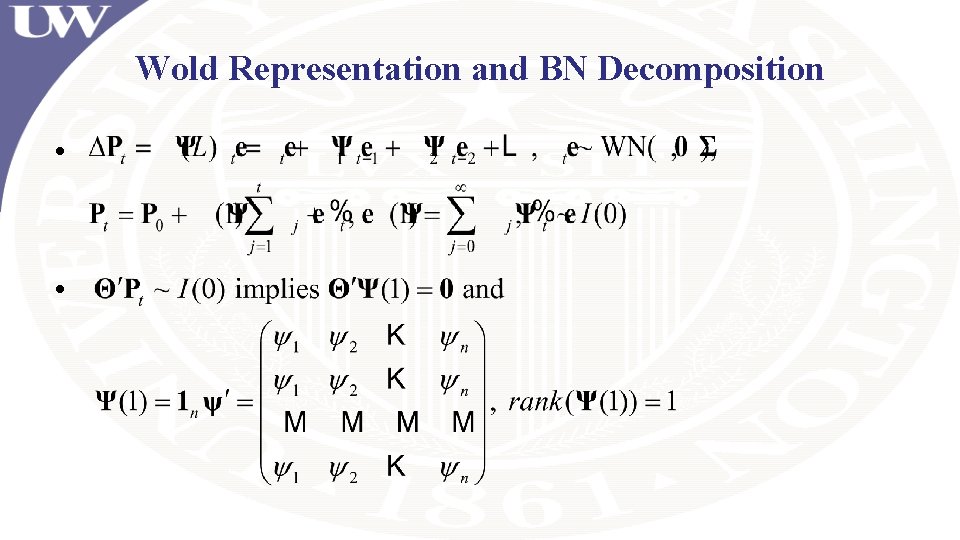
Wold Representation and BN Decomposition • •
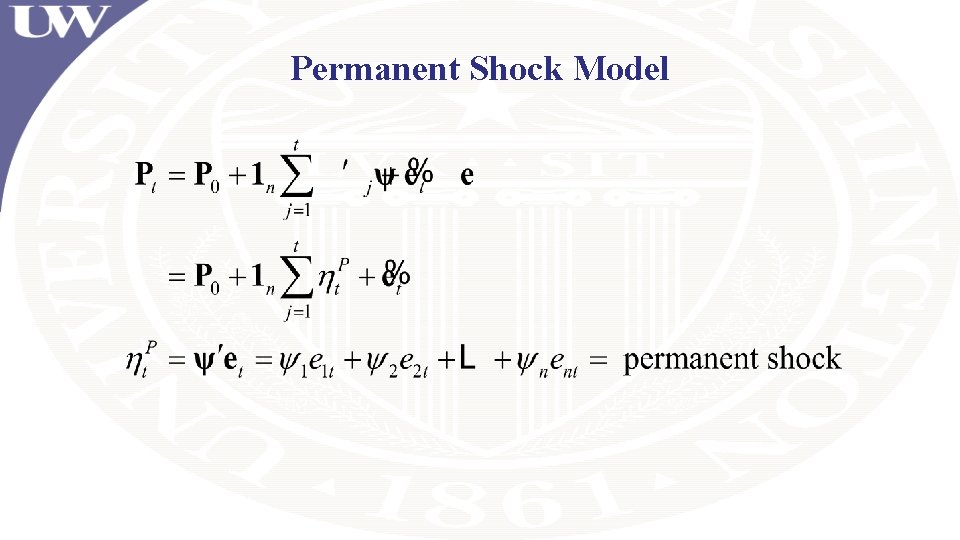
Permanent Shock Model
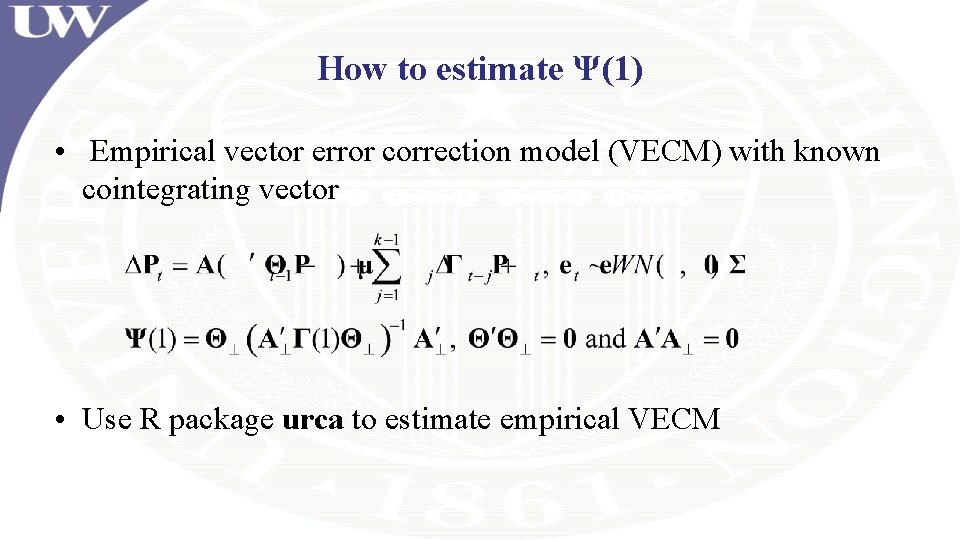
How to estimate Ψ(1) • Empirical vector error correction model (VECM) with known cointegrating vector • Use R package urca to estimate empirical VECM
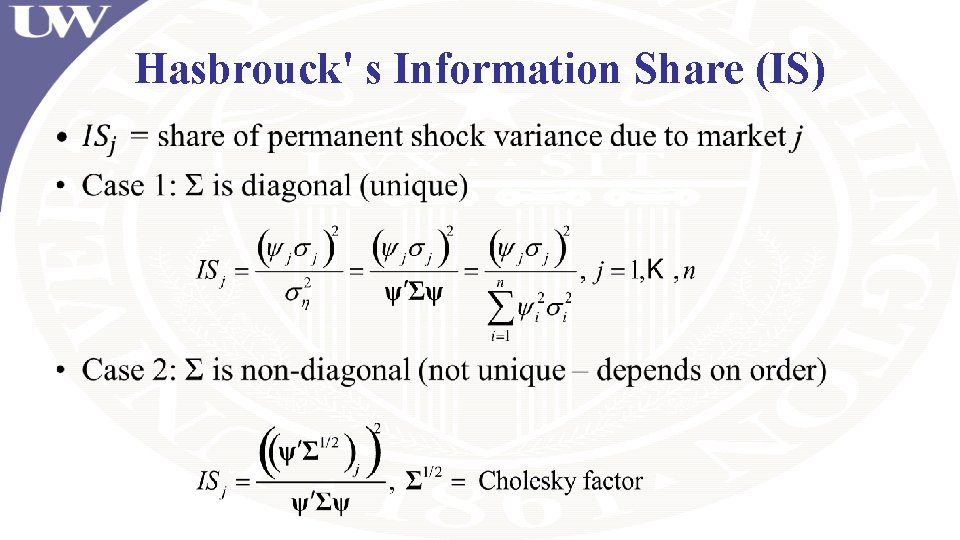
Hasbrouck' s Information Share (IS) •
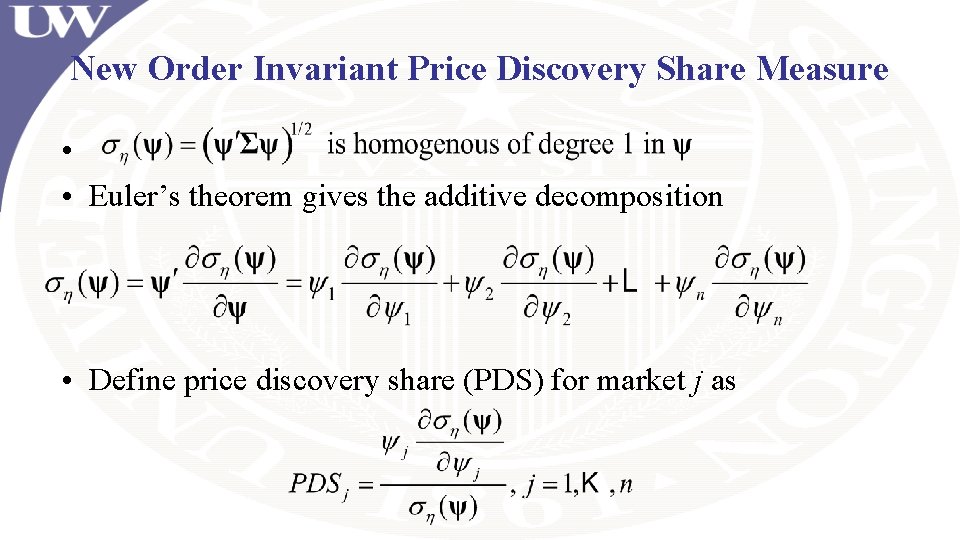
New Order Invariant Price Discovery Share Measure • • Euler’s theorem gives the additive decomposition • Define price discovery share (PDS) for market j as
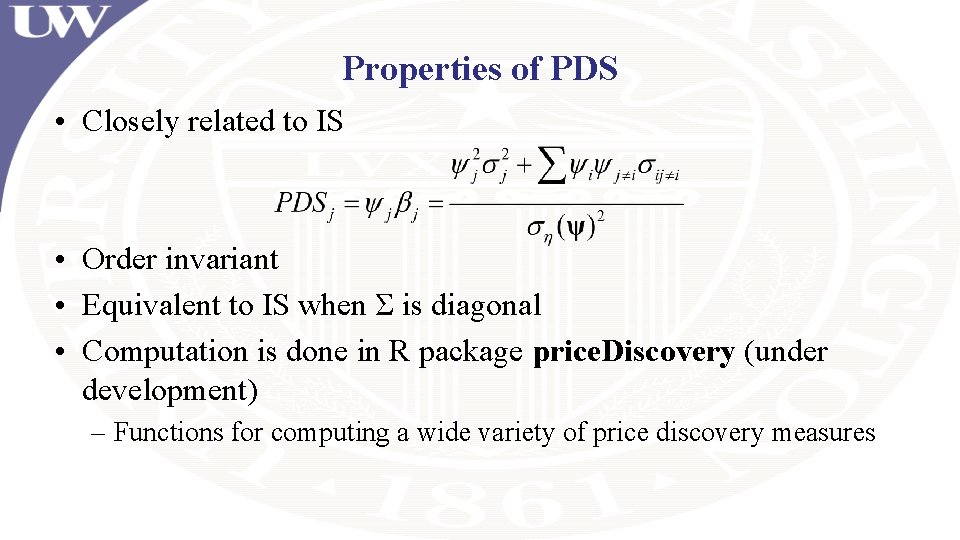
Properties of PDS • Closely related to IS • Order invariant • Equivalent to IS when Σ is diagonal • Computation is done in R package price. Discovery (under development) – Functions for computing a wide variety of price discovery measures
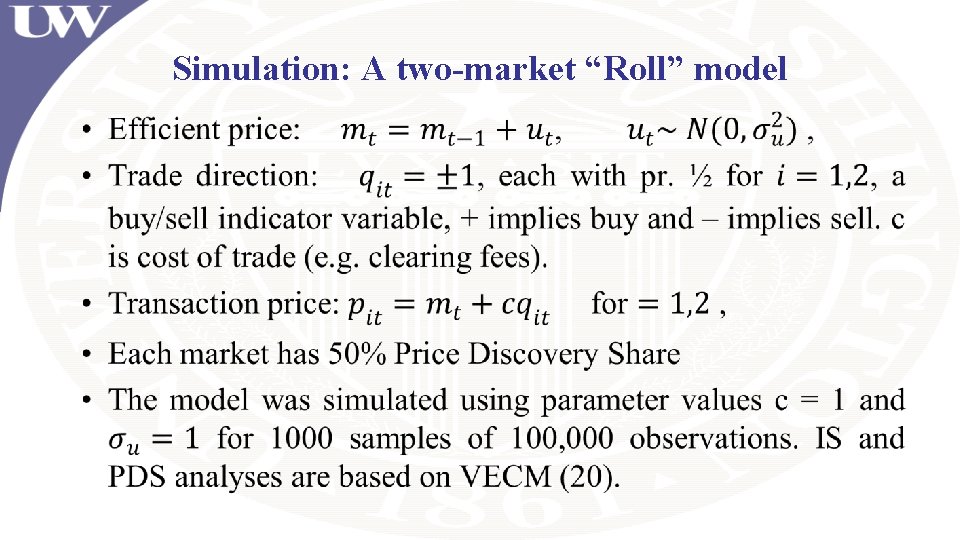
Simulation: A two-market “Roll” model •
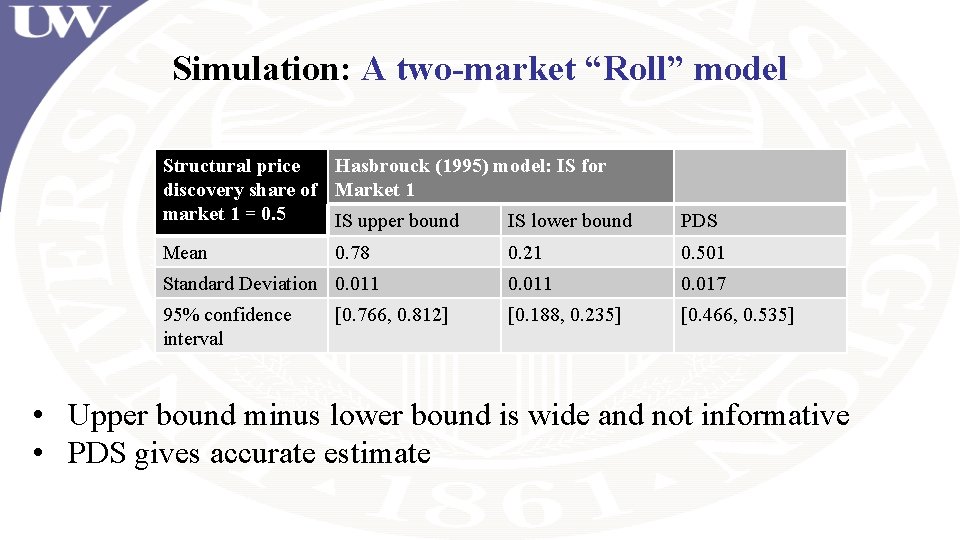
Simulation: A two-market “Roll” model Structural price Hasbrouck (1995) model: IS for discovery share of Market 1 market 1 = 0. 5 IS upper bound IS lower bound PDS Mean 0. 21 0. 501 Standard Deviation 0. 011 0. 017 95% confidence interval [0. 188, 0. 235] [0. 466, 0. 535] 0. 78 [0. 766, 0. 812] • Upper bound minus lower bound is wide and not informative • PDS gives accurate estimate
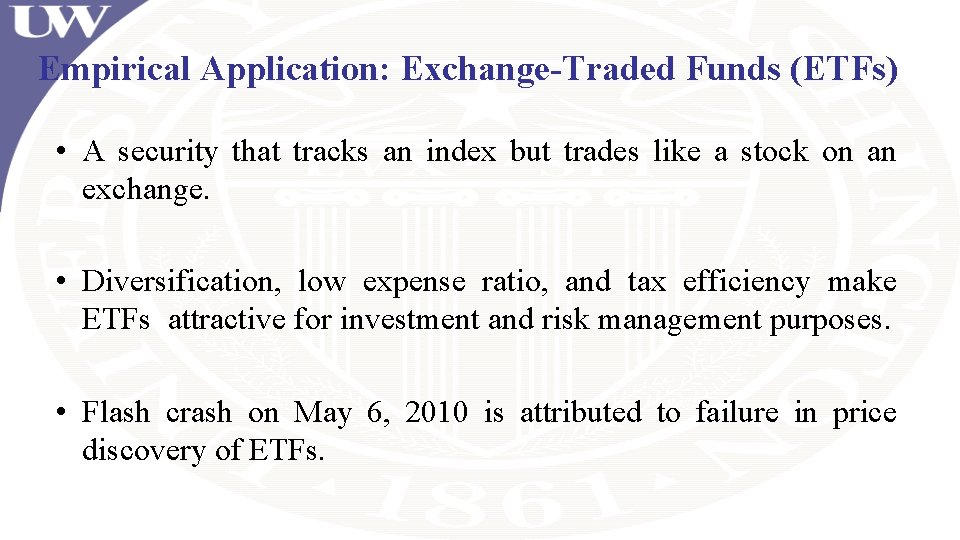
Empirical Application: Exchange-Traded Funds (ETFs) • A security that tracks an index but trades like a stock on an exchange. • Diversification, low expense ratio, and tax efficiency make ETFs attractive for investment and risk management purposes. • Flash crash on May 6, 2010 is attributed to failure in price discovery of ETFs.
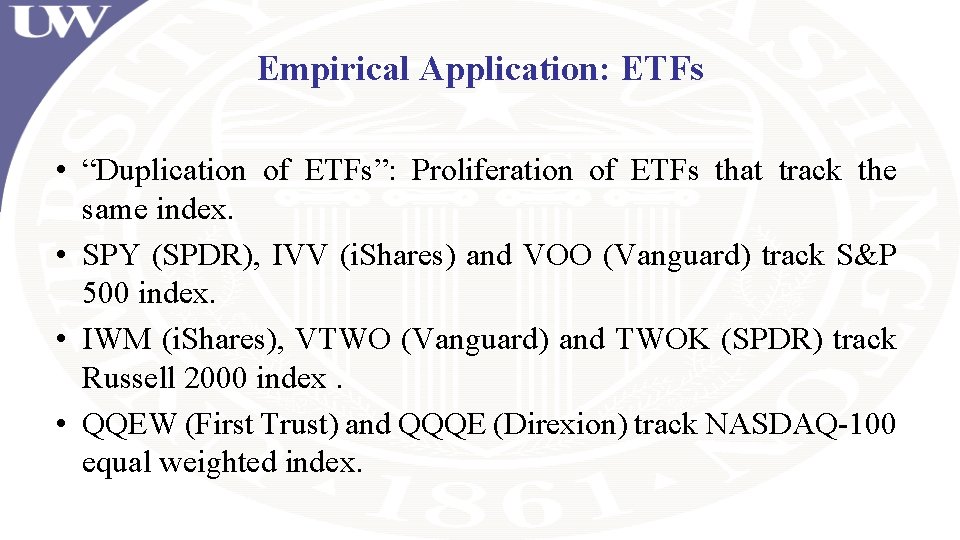
Empirical Application: ETFs • “Duplication of ETFs”: Proliferation of ETFs that track the same index. • SPY (SPDR), IVV (i. Shares) and VOO (Vanguard) track S&P 500 index. • IWM (i. Shares), VTWO (Vanguard) and TWOK (SPDR) track Russell 2000 index. • QQEW (First Trust) and QQQE (Direxion) track NASDAQ-100 equal weighted index.
Empirical Application: Questions of Interest • Does the proliferation of identical or closely related ETFs adversely affect the price discovery process? • Which ETF is the price leader/follower among identical ETFs in different markets and market conditions? • Which ETF price serves as a dominant source of information in S&P 500 ETF trading?
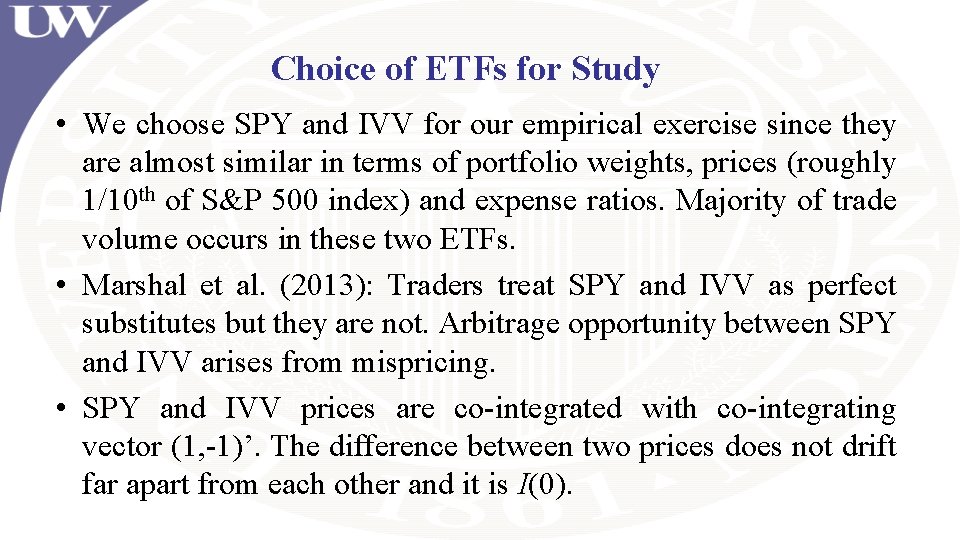
Choice of ETFs for Study • We choose SPY and IVV for our empirical exercise since they are almost similar in terms of portfolio weights, prices (roughly 1/10 th of S&P 500 index) and expense ratios. Majority of trade volume occurs in these two ETFs. • Marshal et al. (2013): Traders treat SPY and IVV as perfect substitutes but they are not. Arbitrage opportunity between SPY and IVV arises from mispricing. • SPY and IVV prices are co-integrated with co-integrating vector (1, -1)’. The difference between two prices does not drift far apart from each other and it is I(0).
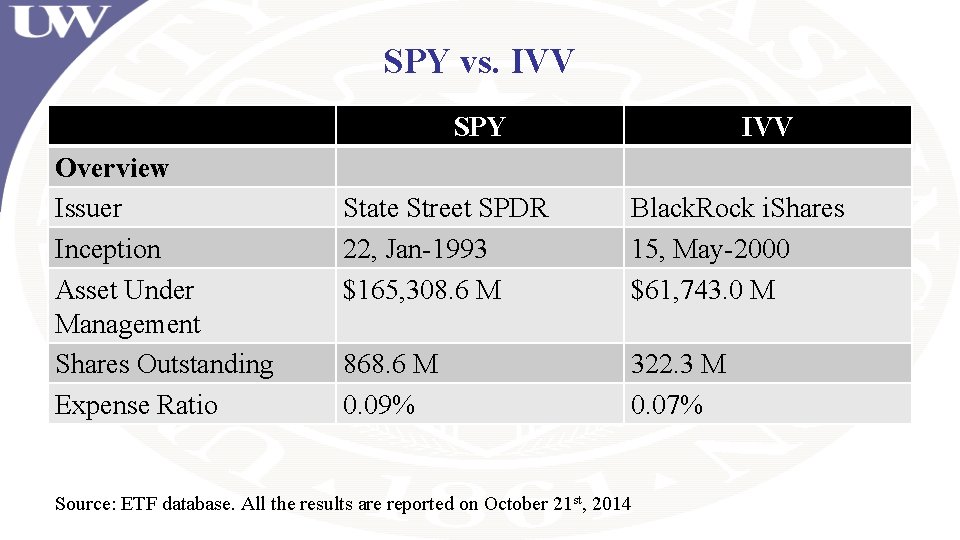
SPY vs. IVV SPY Overview Issuer Inception Asset Under Management Shares Outstanding Expense Ratio IVV State Street SPDR 22, Jan-1993 $165, 308. 6 M Black. Rock i. Shares 15, May-2000 $61, 743. 0 M 868. 6 M 0. 09% 322. 3 M 0. 07% Source: ETF database. All the results are reported on October 21 st, 2014
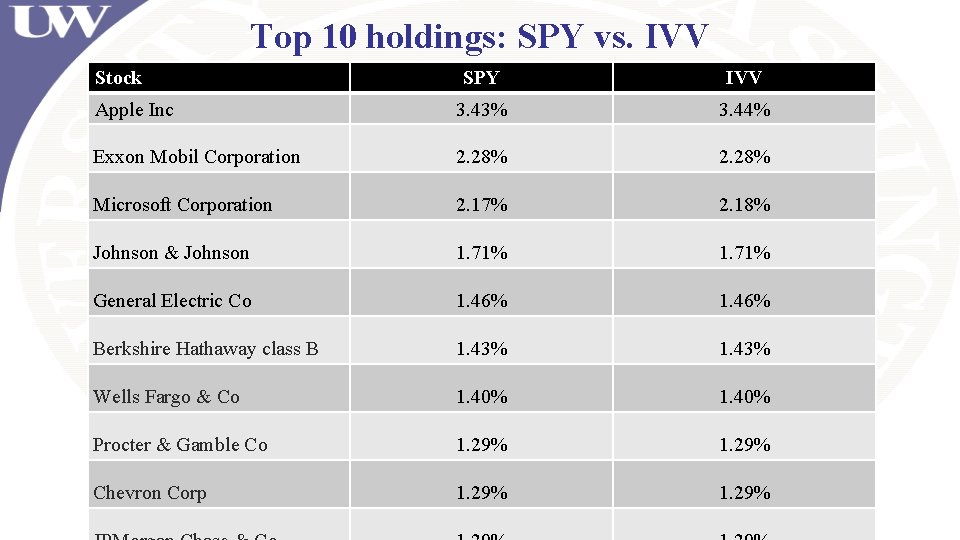
Top 10 holdings: SPY vs. IVV Stock SPY IVV Apple Inc 3. 43% 3. 44% Exxon Mobil Corporation 2. 28% Microsoft Corporation 2. 17% 2. 18% Johnson & Johnson 1. 71% General Electric Co 1. 46% Berkshire Hathaway class B 1. 43% Wells Fargo & Co 1. 40% Procter & Gamble Co 1. 29% Chevron Corp 1. 29%
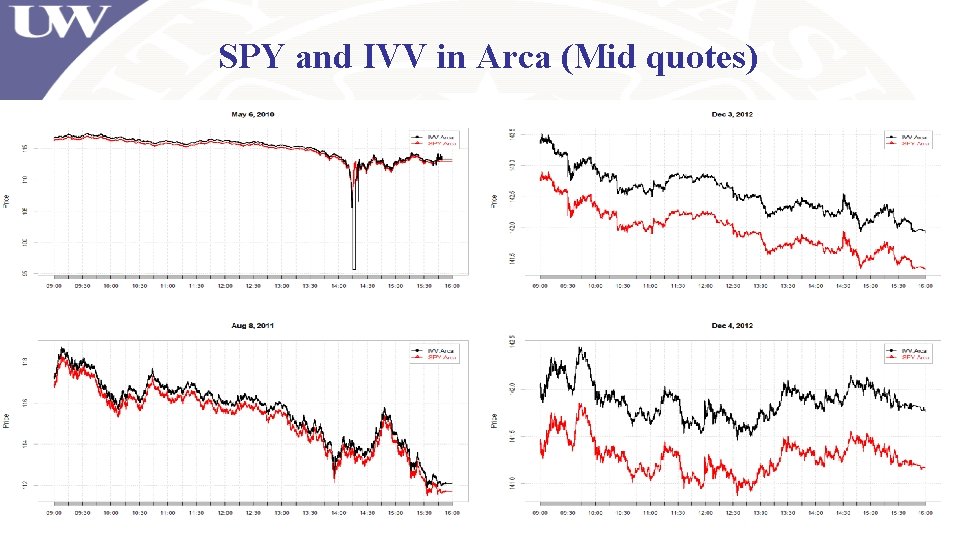
Empirical Application: Exchange-Traded Funds (ETFs) • Three snap-shots of data (mid-quotes every second in each day from 9: 30 am to 16: 30 pm - 25201 observations every day) • Normal Trading Period: Dec 3 rd - Dec 7 th , 2012 – low volatility • Abnormal Trading Period # 1: May 6 th, 2010. Flash Crash – High volatility • Abnormal Trading Period # 2: Aug 8 th, 2010. US lost its AAA credit rating – High volatility • Eight different stock exchanges: BATS, Nasdaq, Arca, EDGE A, CBOE, NSX, Boston, and Philadelphia.
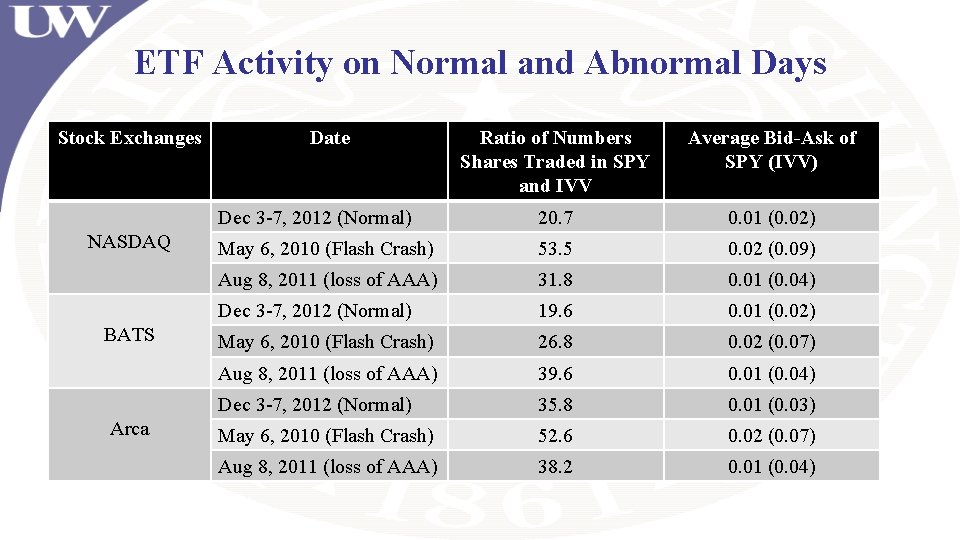
ETF Activity on Normal and Abnormal Days Stock Exchanges NASDAQ BATS Arca Date Ratio of Numbers Shares Traded in SPY and IVV Average Bid-Ask of SPY (IVV) Dec 3 -7, 2012 (Normal) 20. 7 0. 01 (0. 02) May 6, 2010 (Flash Crash) 53. 5 0. 02 (0. 09) Aug 8, 2011 (loss of AAA) 31. 8 0. 01 (0. 04) Dec 3 -7, 2012 (Normal) 19. 6 0. 01 (0. 02) May 6, 2010 (Flash Crash) 26. 8 0. 02 (0. 07) Aug 8, 2011 (loss of AAA) 39. 6 0. 01 (0. 04) Dec 3 -7, 2012 (Normal) 35. 8 0. 01 (0. 03) May 6, 2010 (Flash Crash) 52. 6 0. 02 (0. 07) Aug 8, 2011 (loss of AAA) 38. 2 0. 01 (0. 04)
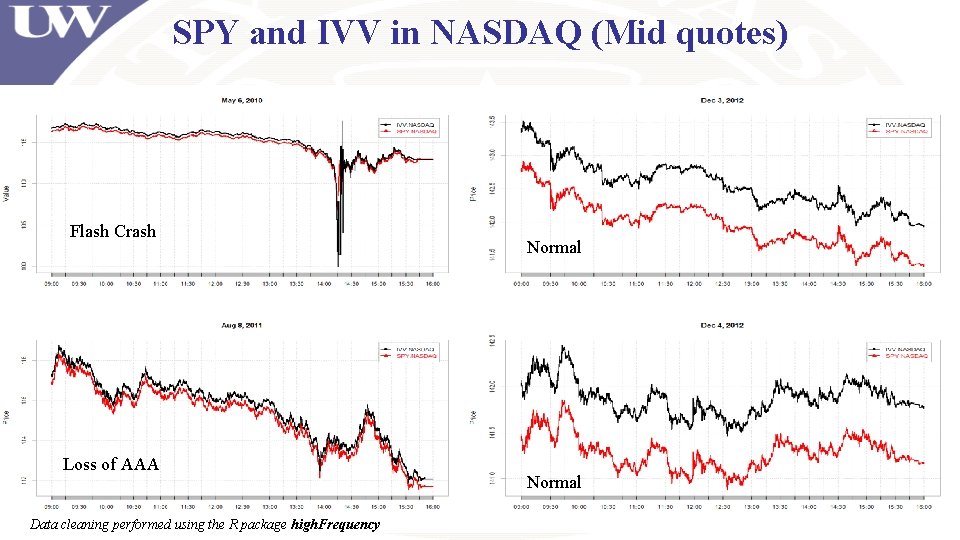
SPY and IVV in NASDAQ (Mid quotes) Flash Crash Loss of AAA Data cleaning performed using the R package high. Frequency Normal
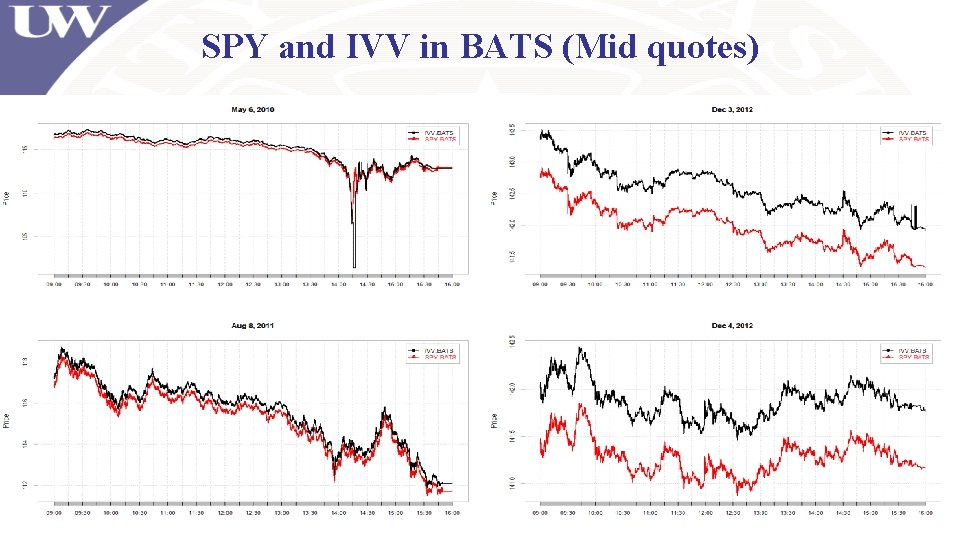
SPY and IVV in BATS (Mid quotes)
SPY and IVV in Arca (Mid quotes)
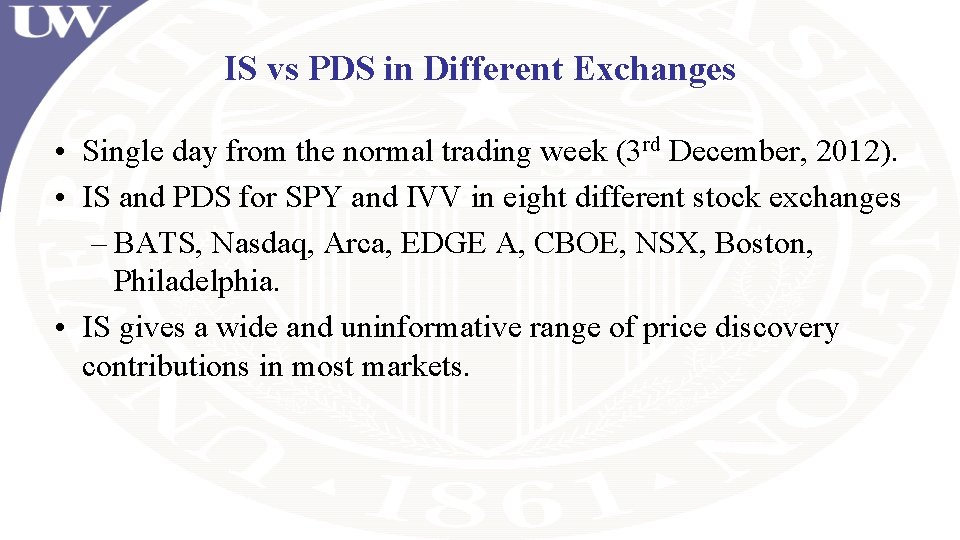
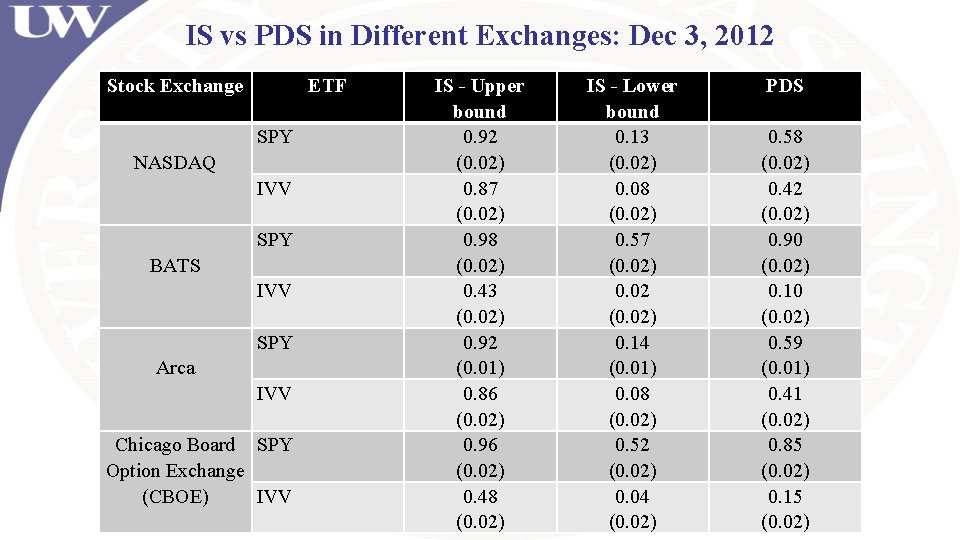
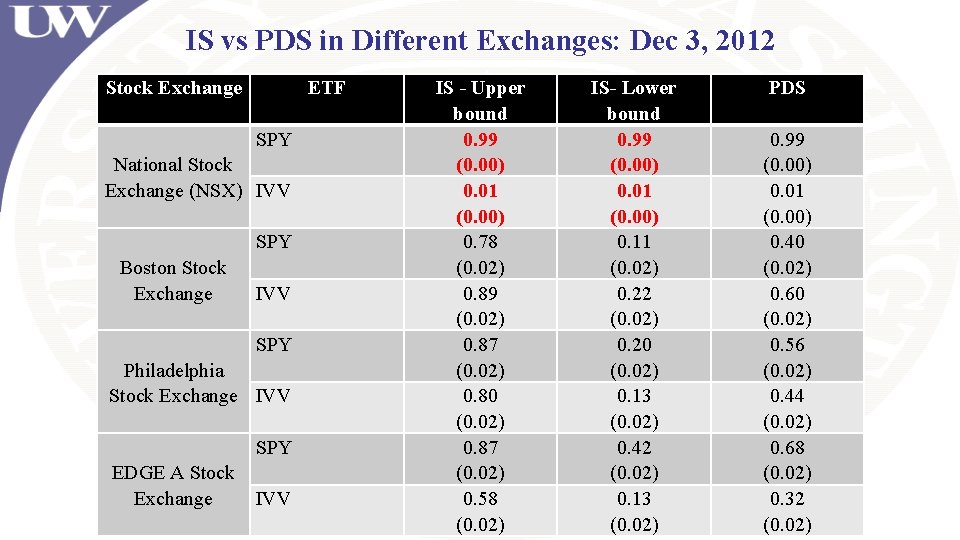
IS vs PDS in Different Exchanges • Single day from the normal trading week (3 rd December, 2012). • IS and PDS for SPY and IVV in eight different stock exchanges – BATS, Nasdaq, Arca, EDGE A, CBOE, NSX, Boston, Philadelphia. • IS gives a wide and uninformative range of price discovery contributions in most markets.
IS vs PDS in Different Exchanges: Dec 3, 2012 Stock Exchange SPY NASDAQ IVV SPY BATS IVV SPY Arca IVV Chicago Board SPY Option Exchange IVV (CBOE) ETF IS - Upper bound 0. 92 (0. 02) 0. 87 (0. 02) 0. 98 (0. 02) 0. 43 (0. 02) 0. 92 (0. 01) 0. 86 (0. 02) 0. 96 (0. 02) 0. 48 (0. 02) IS - Lower bound 0. 13 (0. 02) 0. 08 (0. 02) 0. 57 (0. 02) 0. 02 (0. 02) 0. 14 (0. 01) 0. 08 (0. 02) 0. 52 (0. 02) 0. 04 (0. 02) PDS 0. 58 (0. 02) 0. 42 (0. 02) 0. 90 (0. 02) 0. 10 (0. 02) 0. 59 (0. 01) 0. 41 (0. 02) 0. 85 (0. 02) 0. 15 (0. 02)
IS vs PDS in Different Exchanges: Dec 3, 2012 Stock Exchange SPY National Stock Exchange (NSX) IVV SPY Boston Stock Exchange IVV SPY Philadelphia Stock Exchange IVV SPY EDGE A Stock IVV Exchange ETF IS - Upper bound 0. 99 (0. 00) 0. 01 (0. 00) 0. 78 (0. 02) 0. 89 (0. 02) 0. 87 (0. 02) 0. 80 (0. 02) 0. 87 (0. 02) 0. 58 (0. 02) IS- Lower bound 0. 99 (0. 00) 0. 01 (0. 00) 0. 11 (0. 02) 0. 22 (0. 02) 0. 20 (0. 02) 0. 13 (0. 02) 0. 42 (0. 02) 0. 13 (0. 02) PDS 0. 99 (0. 00) 0. 01 (0. 00) 0. 40 (0. 02) 0. 60 (0. 02) 0. 56 (0. 02) 0. 44 (0. 02) 0. 68 (0. 02) 0. 32 (0. 02)
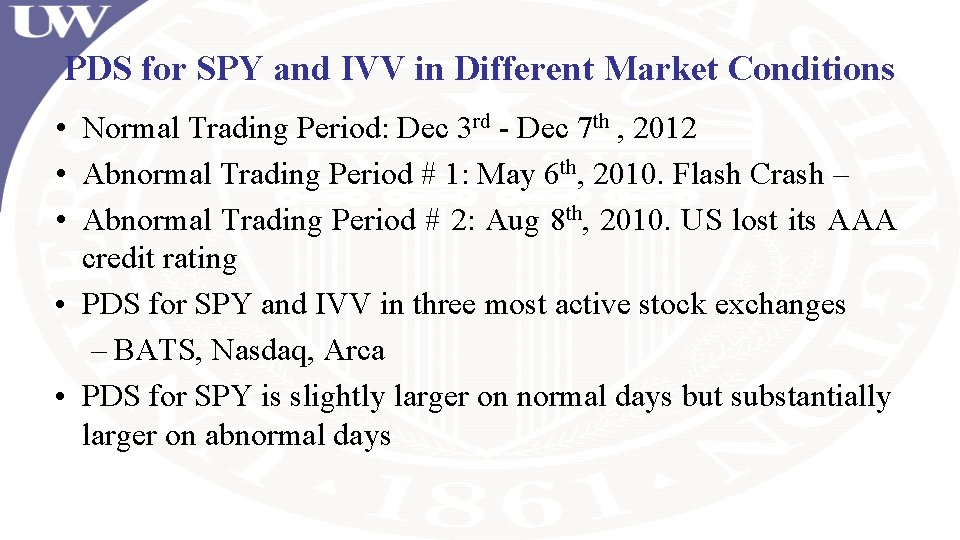
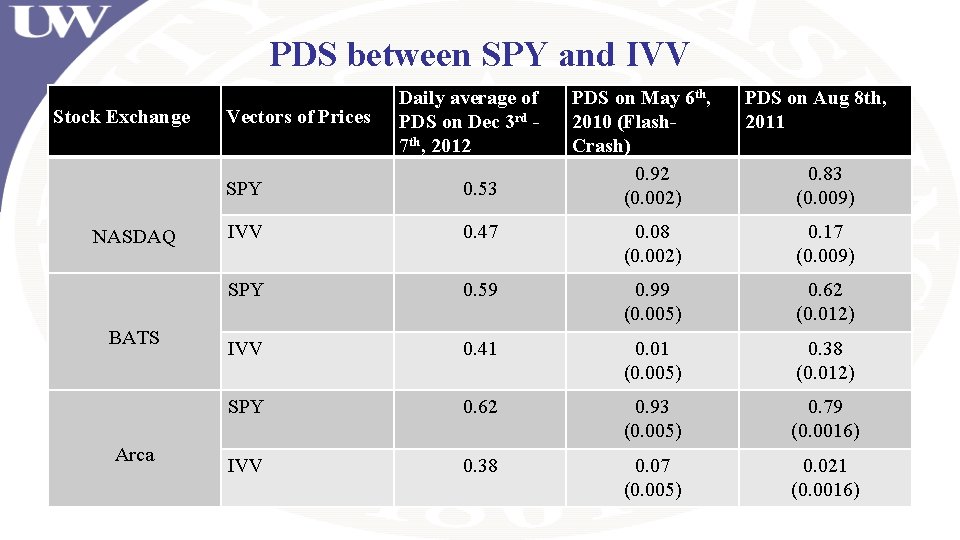
PDS for SPY and IVV in Different Market Conditions • Normal Trading Period: Dec 3 rd - Dec 7 th , 2012 • Abnormal Trading Period # 1: May 6 th, 2010. Flash Crash – • Abnormal Trading Period # 2: Aug 8 th, 2010. US lost its AAA credit rating • PDS for SPY and IVV in three most active stock exchanges – BATS, Nasdaq, Arca • PDS for SPY is slightly larger on normal days but substantially larger on abnormal days
PDS between SPY and IVV Stock Exchange NASDAQ BATS Arca Vectors of Prices Daily average of PDS on Dec 3 rd 7 th, 2012 PDS on May 6 th, 2010 (Flash. Crash) 0. 92 (0. 002) PDS on Aug 8 th, 2011 0. 83 (0. 009) SPY 0. 53 IVV 0. 47 0. 08 (0. 002) 0. 17 (0. 009) SPY 0. 59 0. 99 (0. 005) 0. 62 (0. 012) IVV 0. 41 0. 01 (0. 005) 0. 38 (0. 012) SPY 0. 62 0. 93 (0. 005) 0. 79 (0. 0016) IVV 0. 38 0. 07 (0. 005) 0. 021 (0. 0016)
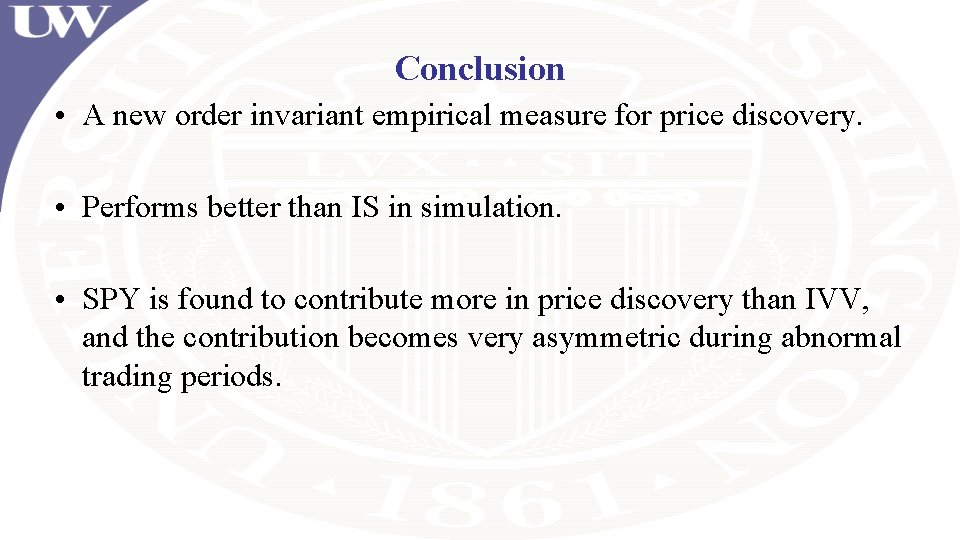
Conclusion • A new order invariant empirical measure for price discovery. • Performs better than IS in simulation. • SPY is found to contribute more in price discovery than IVV, and the contribution becomes very asymmetric during abnormal trading periods.