
Texton Property Fund INTERIM RESULTS FOR THE 6
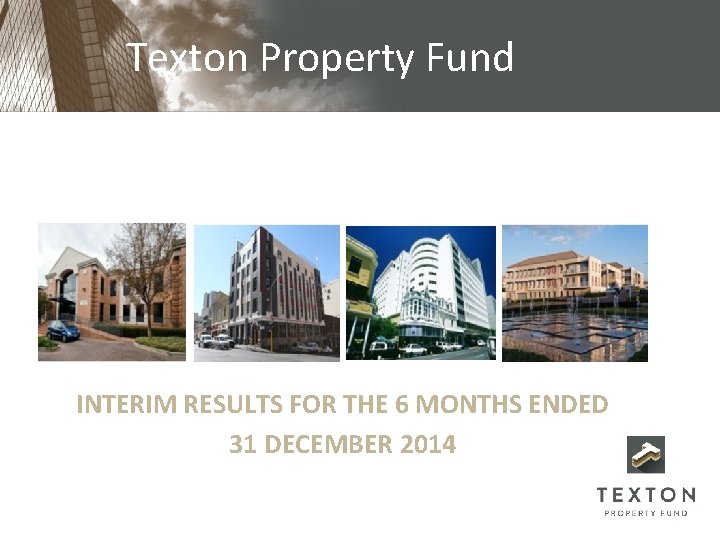









- Slides: 54
Texton Property Fund INTERIM RESULTS FOR THE 6 MONTHS ENDED 31 DECEMBER 2014
TABLE OF CONTENTS Page 1. TEXTON AT A GLANCE 3 2. RESULTS – KEY HIGHLIGHTS 5 3. CORPORATE STRATEGY, GOALS, MANAGEMENT AND DISTINGUISHING FACTORS 7 4. OVERVIEW OF PORTFOLIO 13 5. FINANICAL RESULTS 18 6. PROPOSED BEE TRANSACTION 26 7. UNITED KINGDOM STRATEGY, ACQUISITIONS AND PIPELINE 33 8. OUTLOOK AND CONCLUSION 39 9. ANNEXURE I: ACQUISITIONS IN THE PAST 6 MONTHS 42
TEXTON AT A GLANCE
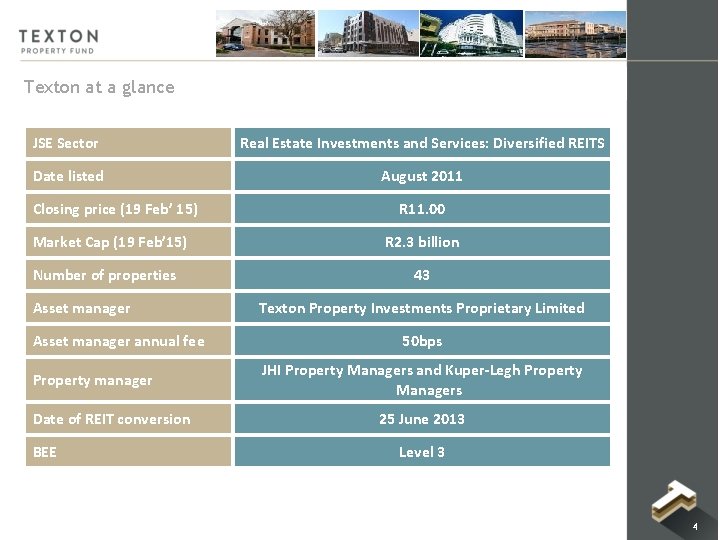
Texton at a glance JSE Sector Real Estate Investments and Services: Diversified REITS Date listed August 2011 Closing price (19 Feb’ 15) Market Cap (19 Feb’ 15) Number of properties Asset manager annual fee Property manager Date of REIT conversion BEE R 11. 00 R 2. 3 billion 43 Texton Property Investments Proprietary Limited 50 bps JHI Property Managers and Kuper-Legh Property Managers 25 June 2013 Level 3 4
RESULTS KEY HIGHLIGHTS
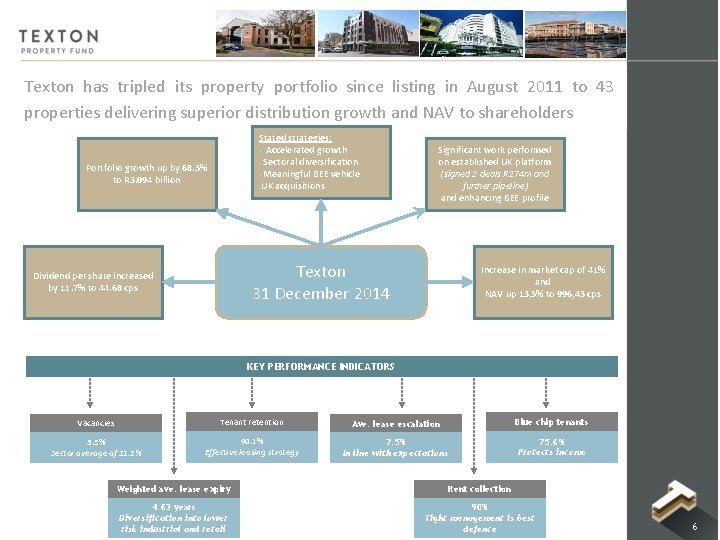
Texton has tripled its property portfolio since listing in August 2011 to 43 properties delivering superior distribution growth and NAV to shareholders Stated strategies: • Accelerated growth • Sectoral diversification • Meaningful BEE vehicle • UK acquisitions Portfolio growth up by 68. 3% to R 3. 094 billion Significant work performed on established UK platform (signed 2 deals R 274 m and further pipeline) and enhancing BEE profile Texton 31 December 2014 Dividend per share increased by 11. 7% to 44. 68 cps Increase in market cap of 41% and NAV up 13, 5% to 996, 43 cps KEY PERFORMANCE INDICATORS Vacancies Tenant retention Ave. lease escalation Blue chip tenants 3. 5% Sector average of 11. 1% 90. 1% Effective leasing strategy 7. 5% In line with expectations 75. 6% Protects income Weighted ave. lease expiry Rent collection 4. 63 years Diversification into lower risk industrial and retail 90% Tight management is best defence 6
CORPORATE STRATEGY, GOALS, MANAGEMENT AND DISTINGUISHING FACTORS
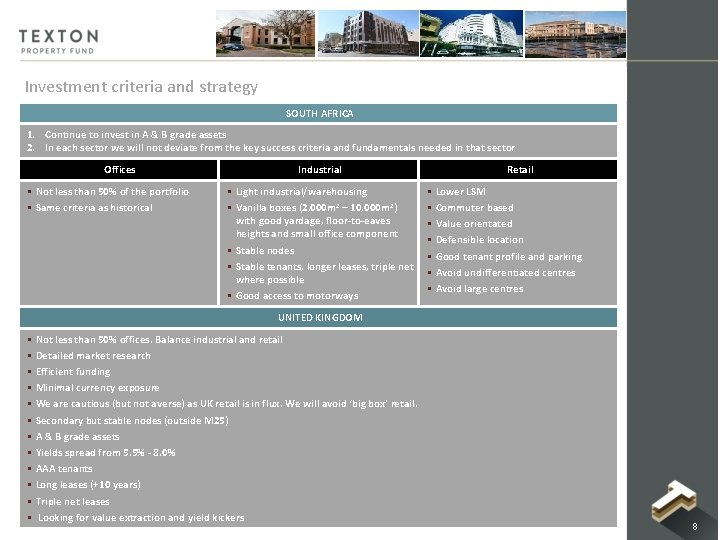
Investment criteria and strategy SOUTH AFRICA 1. Continue to invest in A & B grade assets 2. In each sector we will not deviate from the key success criteria and fundamentals needed in that sector Offices § Not less than 50% of the portfolio § Same criteria as historical Industrial § Light industrial/warehousing § Vanilla boxes (2, 000 m 2 – 10, 000 m 2) with good yardage, floor-to-eaves heights and small office component § Stable nodes § Stable tenants, longer leases, triple net where possible § Good access to motorways Retail § § § § Lower LSM Commuter based Value orientated Defensible location Good tenant profile and parking Avoid undifferentiated centres Avoid large centres UNITED KINGDOM § § § Not less than 50% offices. Balance industrial and retail Detailed market research Efficient funding Minimal currency exposure We are cautious (but not averse) as UK retail is in flux. We will avoid ‘big box’ retail. Secondary but stable nodes (outside M 25) A & B grade assets Yields spread from 5. 5% - 8. 0% AAA tenants Long leases (+10 years) Triple net leases Looking for value extraction and yield kickers 8
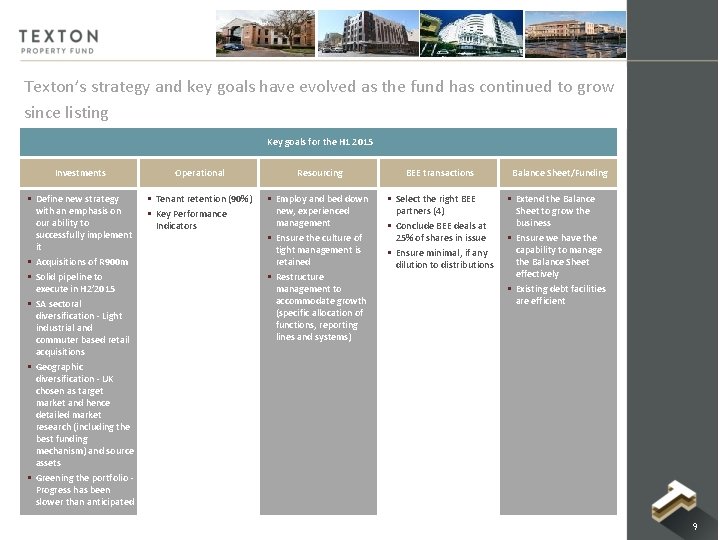
Texton’s strategy and key goals have evolved as the fund has continued to grow since listing Key goals for the H 1 2015 Investments Operational § Define new strategy § Tenant retention (90%) with an emphasis on § Key Performance our ability to Indicators successfully implement it § Acquisitions of R 900 m § Solid pipeline to execute in H 2’ 2015 § SA sectoral diversification - Light industrial and commuter based retail acquisitions § Geographic diversification - UK chosen as target market and hence detailed market research (including the best funding mechanism) and source assets § Greening the portfolio - Progress has been slower than anticipated Resourcing BEE transactions Balance Sheet/Funding § Employ and bed down new, experienced management § Ensure the culture of tight management is retained § Restructure management to accommodate growth (specific allocation of functions, reporting lines and systems) § Select the right BEE partners (4) § Conclude BEE deals at 25% of shares in issue § Ensure minimal, if any dilution to distributions § Extend the Balance Sheet to grow the business § Ensure we have the capability to manage the Balance Sheet effectively § Existing debt facilities are efficient 9
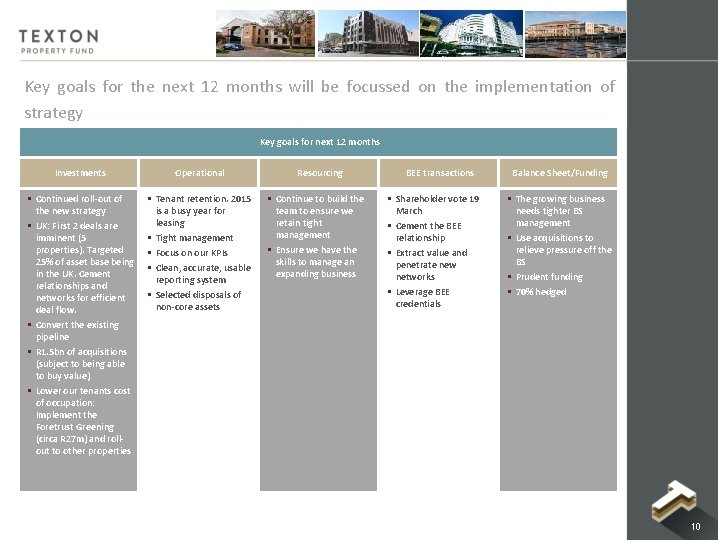
Key goals for the next 12 months will be focussed on the implementation of strategy Key goals for next 12 months Investments Operational § Continued roll-out of the new strategy § UK: First 2 deals are imminent (5 properties). Targeted 25% of asset base being in the UK. Cement relationships and networks for efficient deal flow. § Convert the existing pipeline § R 1. 5 bn of acquisitions (subject to being able to buy value) § Lower our tenants cost of occupation: Implement the Foretrust Greening (circa R 27 m) and rollout to other properties § Tenant retention. 2015 is a busy year for leasing § Tight management § Focus on our KPIs § Clean, accurate, usable reporting system § Selected disposals of non-core assets Resourcing § Continue to build the team to ensure we retain tight management § Ensure we have the skills to manage an expanding business BEE transactions § Shareholder vote 19 March § Cement the BEE relationship § Extract value and penetrate new networks § Leverage BEE credentials Balance Sheet/Funding § The growing business needs tighter BS management § Use acquisitions to relieve pressure off the BS § Prudent funding § 70% hedged 10
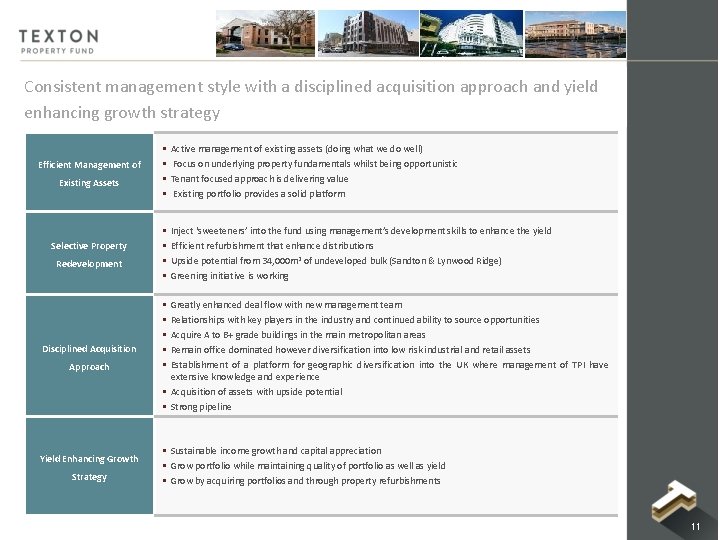
Consistent management style with a disciplined acquisition approach and yield enhancing growth strategy Efficient Management of Existing Assets Selective Property Redevelopment Disciplined Acquisition Approach Yield Enhancing Growth Strategy § § Active management of existing assets (doing what we do well) Focus on underlying property fundamentals whilst being opportunistic Tenant focused approach is delivering value Existing portfolio provides a solid platform § § Inject ‘sweeteners’ into the fund using management’s development skills to enhance the yield Efficient refurbishment that enhance distributions Upside potential from 34, 000 m 2 of undeveloped bulk (Sandton & Lynwood Ridge) Greening initiative is working § § § Greatly enhanced deal flow with new management team Relationships with key players in the industry and continued ability to source opportunities Acquire A to B+ grade buildings in the main metropolitan areas Remain office dominated however diversification into low risk industrial and retail assets Establishment of a platform for geographic diversification into the UK where management of TPI have extensive knowledge and experience § Acquisition of assets with upside potential § Strong pipeline § Sustainable income growth and capital appreciation § Grow portfolio while maintaining quality of portfolio as well as yield § Grow by acquiring portfolios and through property refurbishments 11
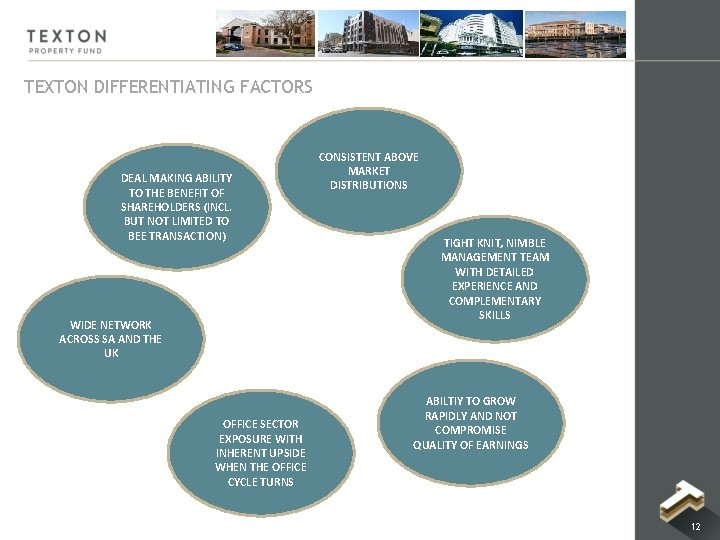
TEXTON DIFFERENTIATING FACTORS DEAL MAKING ABILITY TO THE BENEFIT OF SHAREHOLDERS (INCL. BUT NOT LIMITED TO BEE TRANSACTION) WIDE NETWORK ACROSS SA AND THE UK OFFICE SECTOR EXPOSURE WITH INHERENT UPSIDE WHEN THE OFFICE CYCLE TURNS CONSISTENT ABOVE MARKET DISTRIBUTIONS TIGHT KNIT, NIMBLE MANAGEMENT TEAM WITH DETAILED EXPERIENCE AND COMPLEMENTARY SKILLS ABILTIY TO GROW RAPIDLY AND NOT COMPROMISE QUALITY OF EARNINGS 12
OVERVIEW OF PORTFOLIO
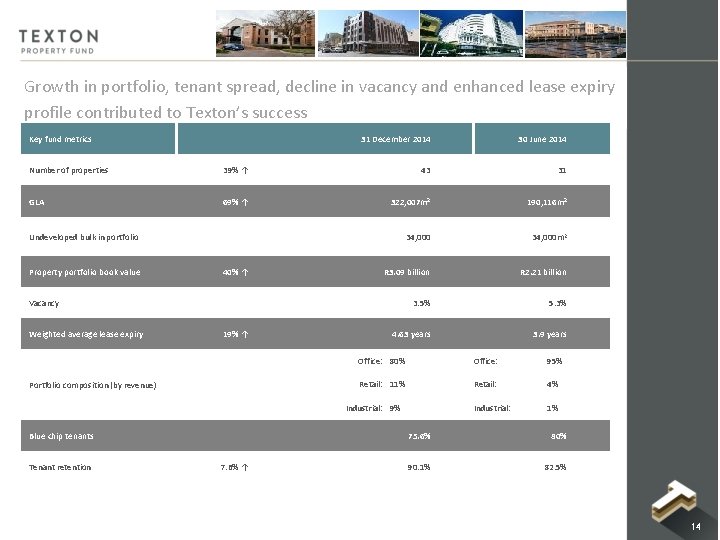
Growth in portfolio, tenant spread, decline in vacancy and enhanced lease expiry profile contributed to Texton’s success Key fund metrics 31 December 2014 30 June 2014 Number of properties 39% ↑ 43 31 GLA 69% ↑ 322, 007 m 2 190, 116 m 2 34, 000 m 2 R 3. 09 billion R 2. 21 billion 3. 5% 5. 3% 4. 63 years 3. 9 years Undeveloped bulk in portfolio Property portfolio book value 40% ↑ Vacancy Weighted average lease expiry 19% ↑ Portfolio composition (by revenue) Office: 80% Office: 95% Retail: 11% Retail: 4% Industrial: 1% Industrial: 9% Blue chip tenants Tenant retention 7. 6% ↑ 75. 6% 80% 90. 1% 82. 5% 14
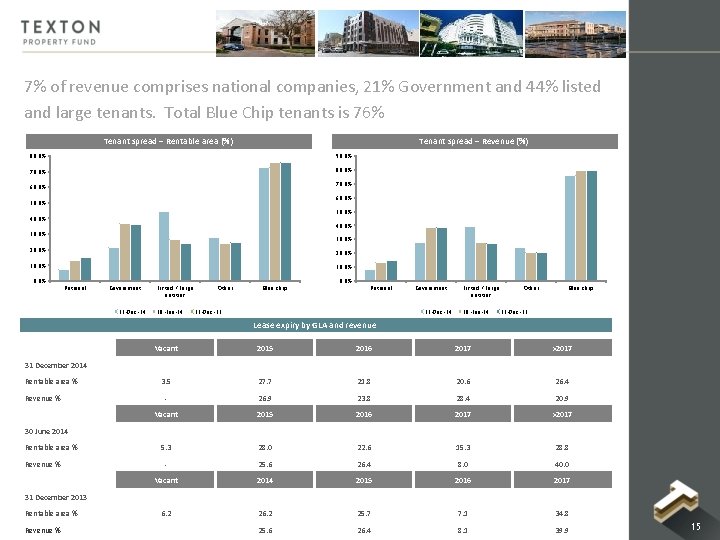
7% of revenue comprises national companies, 21% Government and 44% listed and large tenants. Total Blue Chip tenants is 76% Tenant profile by GLA and revenue Tenant spread – Rentable area (%) Tenant spread – Revenue (%) 80. 0% 90. 0% 70. 0% 80. 0% 70. 0% 60. 0% 50. 0% 40. 0% 30. 0% 20. 0% 10. 0% National Government 31 -Dec-14 Listed / large entities 30 -Jun-14 Other Blue chip National 31 -Dec-13 Government 31 -Dec-14 Listed / large entities 30 -Jun-14 Other Blue chip 31 -Dec-13 Lease expiry by GLA and revenue Vacant 2015 2016 2017 >2017 3. 5 27. 7 21. 8 20. 6 26. 4 - 26. 9 23. 8 28. 4 20. 9 Vacant 2015 2016 2017 >2017 5. 3 28. 0 22. 6 15. 3 28. 8 - 25. 6 26. 4 8. 0 40. 0 Vacant 2014 2015 2016 2017 6. 2 25. 7 7. 1 34. 8 25. 6 26. 4 8. 1 39. 9 31 December 2014 Rentable area % Revenue % 30 June 2014 Rentable area % Revenue % 31 December 2013 Rentable area % Revenue % 15
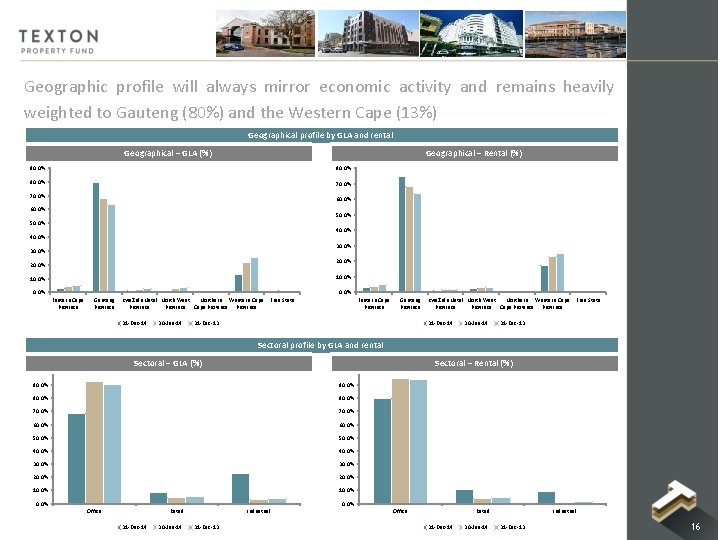
Geographic profile will always mirror economic activity and remains heavily weighted to Gauteng (80%) and the Western Cape (13%) Geographical profile by GLA and rental Geographical – GLA (%) Geographical – Rental (%) 90. 0% 80. 0% 70. 0% 60. 0% 50. 0% 40. 0% 30. 0% 20. 0% 10. 0% Eastern Cape Province Gauteng Kwa. Zulu Natal North West Northern Western Cape Free State Province Cape Province 31 -Dec-14 30 -Jun-14 Eastern Cape Province Gauteng Kwa. Zulu Natal North West Northern Western Cape Free State Province Cape Province 31 -Dec-13 31 -Dec-14 30 -Jun-14 31 -Dec-13 Sectoral profile by GLA and rental Sectoral – GLA (%) 100. 0% Sectoral – Rental (%) 100. 0% 90. 0% 80. 0% 70. 0% 60. 0% 50. 0% 40. 0% 30. 0% 20. 0% 10. 0% Office Retail 31 -Dec-14 30 -Jun-14 Industrial 31 -Dec-13 16
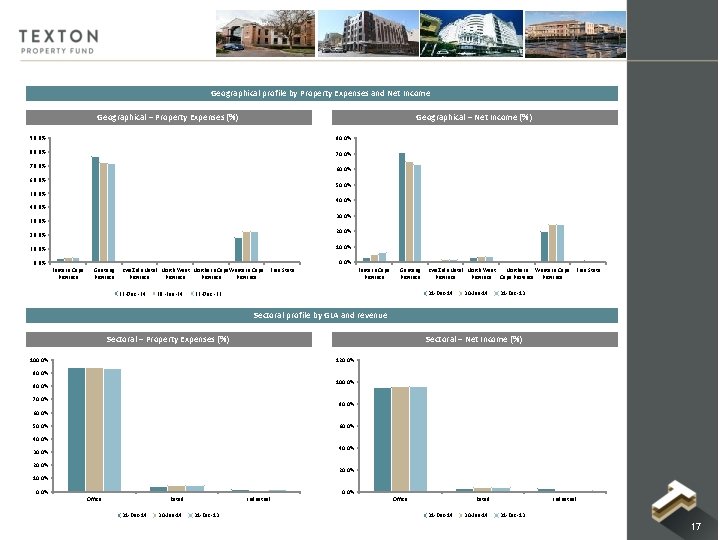
Geographical profile by Property Expenses and Net Income Geographical – Property Expenses (%) Geographical – Net Income (%) 90. 0% 80. 0% 70. 0% 60. 0% 50. 0% 40. 0% 30. 0% 20. 0% 10. 0% Eastern Cape Province Gauteng Province Kwa. Zulu Natal North West Northern Cape Western Cape Free State Province 31 -Dec-14 30 -Jun-14 Eastern Cape Province Gauteng Kwa. Zulu Natal North West Northern Western Cape Free State Province Cape Province 31 -Dec-14 31 -Dec-13 30 -Jun-14 31 -Dec-13 Sectoral profile by GLA and revenue Sectoral – Property Expenses (%) Sectoral – Net Income (%) 100. 0% 120. 0% 90. 0% 100. 0% 80. 0% 70. 0% 80. 0% 60. 0% 50. 0% 60. 0% 40. 0% 30. 0% 20. 0% 10. 0% Office Retail 31 -Dec-14 30 -Jun-14 Industrial 31 -Dec-13 17
FINANCIAL RESULTS
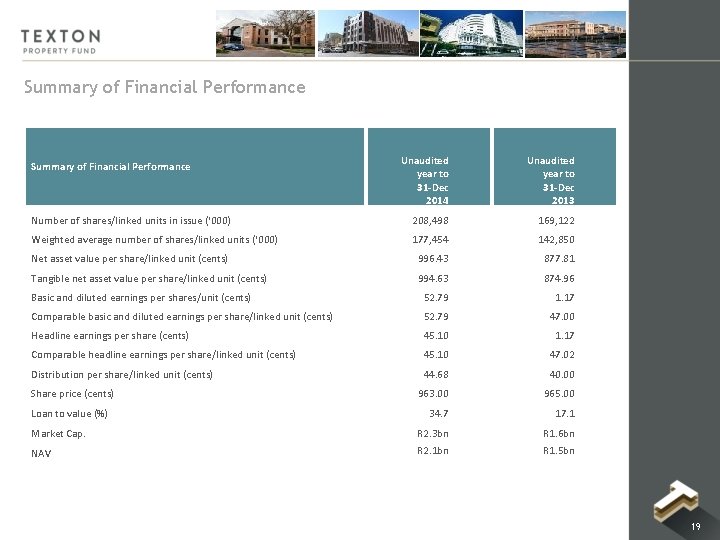
Summary of Financial Performance Unaudited year to 31 -Dec 2014 Unaudited year to 31 -Dec 2013 Number of shares/linked units in issue (‘ 000) 208, 498 169, 122 Weighted average number of shares/linked units (‘ 000) 177, 454 142, 850 Net asset value per share/linked unit (cents) 996. 43 877. 81 Tangible net asset value per share/linked unit (cents) 994. 63 874. 96 Basic and diluted earnings per shares/unit (cents) 52. 79 1. 17 Comparable basic and diluted earnings per share/linked unit (cents) 52. 79 47. 00 Headline earnings per share (cents) 45. 10 1. 17 Comparable headline earnings per share/linked unit (cents) 45. 10 47. 02 Distribution per share/linked unit (cents) 44. 68 40. 00 963. 00 965. 00 34. 7 17. 1 Market Cap. R 2. 3 bn R 1. 6 bn NAV R 2. 1 bn R 1. 5 bn Summary of Financial Performance Share price (cents) Loan to value (%) 19
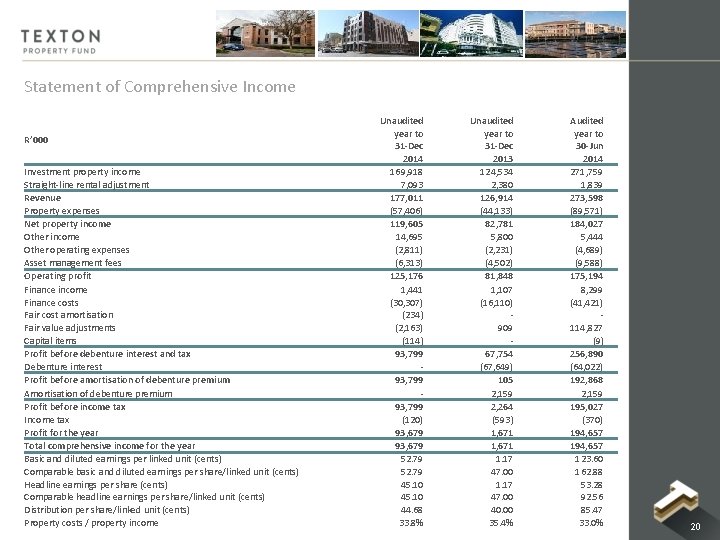
Statement of Comprehensive Income R’ 000 Investment property income Straight-line rental adjustment Revenue Property expenses Net property income Other operating expenses Asset management fees Operating profit Finance income Finance costs Fair cost amortisation Fair value adjustments Capital items Profit before debenture interest and tax Debenture interest Profit before amortisation of debenture premium Amortisation of debenture premium Profit before income tax Income tax Profit for the year Total comprehensive income for the year Basic and diluted earnings per linked unit (cents) Comparable basic and diluted earnings per share/linked unit (cents) Headline earnings per share (cents) Comparable headline earnings per share/linked unit (cents) Distribution per share/linked unit (cents) Property costs / property income Unaudited year to 31 -Dec 2014 169, 918 7, 093 177, 011 (57, 406) 119, 605 14, 695 (2, 811) (6, 313) 125, 176 1, 441 (30, 307) (234) (2, 163) (114) 93, 799 - 93, 799 (120) 93, 679 52. 79 45. 10 44. 68 33. 8% Unaudited year to 31 -Dec 2013 124, 534 2, 380 126, 914 (44, 133) 82, 781 5, 800 (2, 231) (4, 502) 81, 848 1, 107 (16, 110) - 909 - 67, 754 (67, 649) 105 2, 159 2, 264 (593) 1, 671 1. 17 47. 00 40. 00 35. 4% Audited year to 30 -Jun 2014 271, 759 1, 839 273, 598 (89, 571) 184, 027 5, 444 (4, 689) (9, 588) 175, 194 8, 299 (41, 421) - 114, 827 (9) 256, 890 (64, 022) 192, 868 2, 159 195, 027 (370) 194, 657 123. 60 162. 88 53. 28 92. 56 85. 47 33. 0% 20
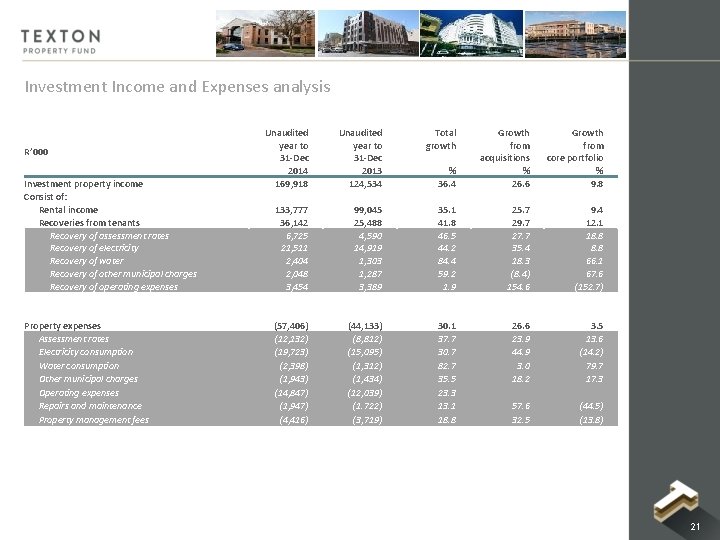
Investment Income and Expenses analysis R’ 000 Investment property income Consist of: Rental income Recoveries from tenants Recovery of assessment rates Recovery of electricity Recovery of water Recovery of other municipal charges Recovery of operating expenses Property expenses Assessment rates Electricity consumption Water consumption Other municipal charges Operating expenses Repairs and maintenance Property management fees Unaudited year to 31 -Dec 2014 169, 918 Unaudited year to 31 -Dec 2013 124, 534 Total growth % 36. 4 Growth from acquisitions % 26. 6 Growth from core portfolio % 9. 8 133, 777 36, 142 6, 725 21, 511 2, 404 2, 048 3, 454 99, 045 25, 488 4, 590 14, 919 1, 303 1, 287 3, 389 35. 1 41. 8 46. 5 44. 2 84. 4 59. 2 1. 9 25. 7 29. 7 27. 7 35. 4 18. 3 (8. 4) 154. 6 9. 4 12. 1 18. 8 66. 1 67. 6 (152. 7) (57, 406) (12, 132) (19, 723) (2, 398) (1, 943) (14, 847) (1, 947) (4, 416) (44, 133) (8, 812) (15, 095) (1, 312) (1, 434) (12, 039) (1. 722) (3, 719) 30. 1 37. 7 30. 7 82. 7 35. 5 23. 3 13. 1 18. 8 26. 6 23. 9 44. 9 3. 0 18. 2 3. 5 13. 6 (14. 2) 79. 7 17. 3 57. 6 32. 5 (44. 5) (13. 8) 21
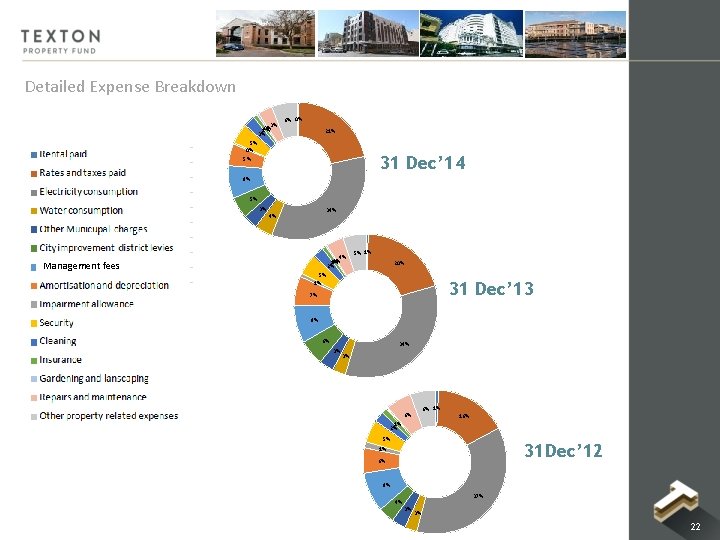
Detailed Expense Breakdown 3% 0% 1% 3% 6% 0% 21% 5% 0% 5% 31 Dec’ 14 8% 5% 3% Management fees 34% 4% 4% 0% 1% 2% 5% 1% 20% 5% 1% 31 Dec’ 13 7% 8% 6% 3% 34% 3% 6% 16% 1% 2% 5% 31 Dec’ 12 1% 6% 9% 4% 37% 3% 3% 22
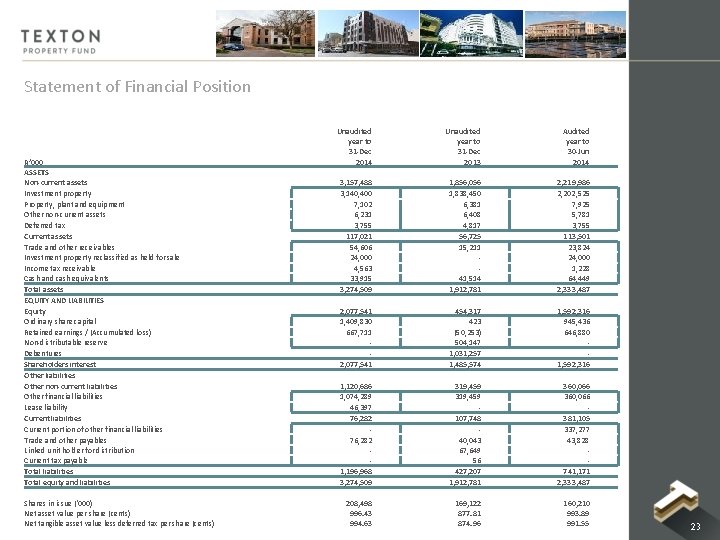
Statement of Financial Position R’ 000 ASSETS Non-current assets Investment property Property, plant and equipment Other non-current assets Deferred tax Current assets Trade and other receivables Investment property reclassified as held for sale Income tax receivable Cash and cash equivalents Total assets EQUITY AND LIABILITIES Equity Ordinary share capital Retained earnings / (Accumulated loss) Non-distributable reserve Debentures Shareholders interest Other liabilities Other non-current liabilities Other financial liabilities Lease liability Current liabilities Current portion of other financial liabilities Trade and other payables Linked unit holder for distribution Current tax payable Total liabilities Total equity and liabilities Shares in issue (‘ 000) Net asset value per share (cents) Net tangible asset value less deferred tax per share (cents) Unaudited year to 31 -Dec 2014 3, 157, 488 3, 140, 400 7, 102 6, 231 3, 755 117, 021 54, 606 24, 000 4, 563 33, 915 3, 274, 509 2, 077, 541 1, 409, 830 667, 711 - 2, 077, 541 1, 120, 686 1, 074, 289 46, 397 76, 282 - 1, 196, 968 3, 274, 509 208, 498 996. 43 994. 63 Unaudited year to 31 -Dec 2013 1, 856, 056 1, 838, 450 6, 381 6, 408 4, 817 56, 725 15, 211 - 41, 514 1, 912, 781 454, 317 423 (50, 253) 504, 147 1, 031, 257 1, 485, 574 319, 459 - 107, 748 - 40, 043 67, 649 56 427, 207 1, 912, 781 169, 122 877. 81 874. 96 Audited year to 30 -Jun 2014 2, 219, 986 2, 202, 525 7, 925 5, 781 3, 755 113, 501 23, 824 24, 000 1, 228 64, 449 2, 333, 487 1, 592, 316 945, 436 646, 880 - 1, 592, 316 360, 066 - 381, 105 337, 277 43, 828 - 741, 171 2, 333, 487 160, 210 993. 89 991. 55 23
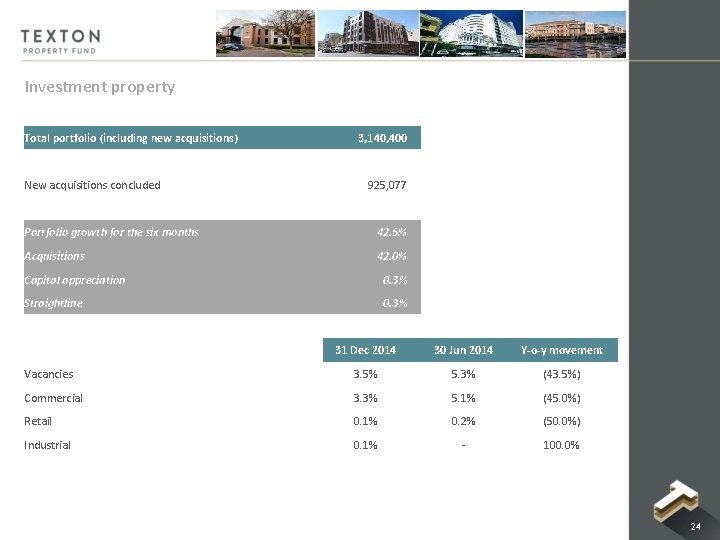
Investment property Total portfolio (including new acquisitions) New acquisitions concluded 3, 140, 400 925, 077 Portfolio growth for the six months 42. 6% Acquisitions 42. 0% Capital appreciation 0. 3% Straightline 0. 3% 31 Dec 2014 30 Jun 2014 Y-o-y movement Vacancies 3. 5% 5. 3% (43. 5%) Commercial 3. 3% 5. 1% (45. 0%) Retail 0. 1% 0. 2% (50. 0%) Industrial 0. 1% - 100. 0% 24
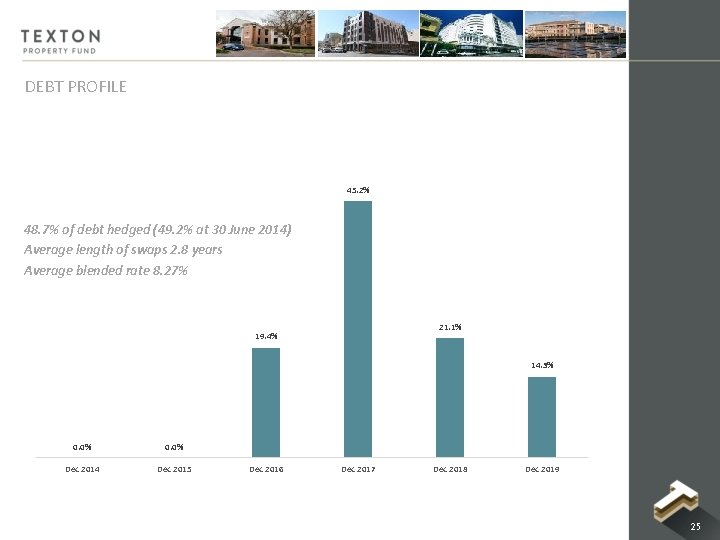
DEBT PROFILE 45. 2% 48. 7% of debt hedged (49. 2% at 30 June 2014) Average length of swaps 2. 8 years Average blended rate 8. 27% 21. 1% 19. 4% 14. 3% 0. 0% Dec 2014 Dec 2015 Dec 2016 Dec 2017 Dec 2018 Dec 2019 25
PROPOSED BEE TRANSACTION
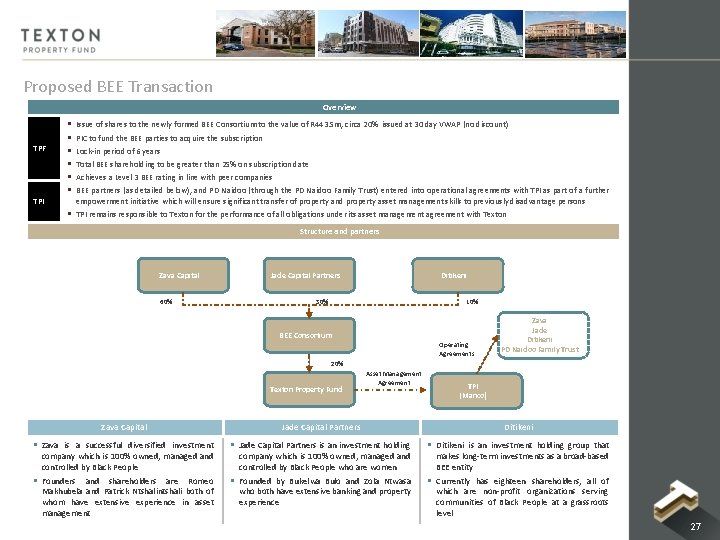
Proposed BEE Transaction Overview TPF TPI § § § Issue of shares to the newly formed BEE Consortium to the value of R 443. 5 m, circa 20% issued at 30 day VWAP (no discount) PIC to fund the BEE parties to acquire the subscription Lock-in period of 6 years Total BEE shareholding to be greater than 25% on subscription date Achieves a Level 3 BEE rating in line with peer companies BEE partners (as detailed below), and PD Naidoo (through the PD Naidoo Family Trust) entered into operational agreements with TPI as part of a further empowerment initiative which will ensure significant transfer of property and property asset management skills to previously disadvantage persons § TPI remains responsible to Texton for the performance of all obligations under its asset management agreement with Texton Structure and partners Zava Capital 60% Jade Capital Partners Ditikeni 30% 10% BEE Consortium Operating Agreements Zava Jade Ditikeni PD Naidoo Family Trust 20% Texton Property Fund Asset Management Agreement TPI (Manco) Zava Capital Jade Capital Partners Ditikeni § Zava is a successful diversified investment § Jade Capital Partners is an investment holding § Ditikeni is an investment holding group that § Founders and shareholders are Romeo § Founded by Bukelwa Bulo and Zola Ntwasa § Currently has eighteen shareholders, all of company which is 100% owned, managed and controlled by Black People Makhubela and Patrick Ntshalintshali both of whom have extensive experience in asset management company which is 100% owned, managed and controlled by Black People who are women who both have extensive banking and property experience makes long-term investments as a broad-based BEE entity which are non-profit organizations serving communities of Black People at a grassroots level 27
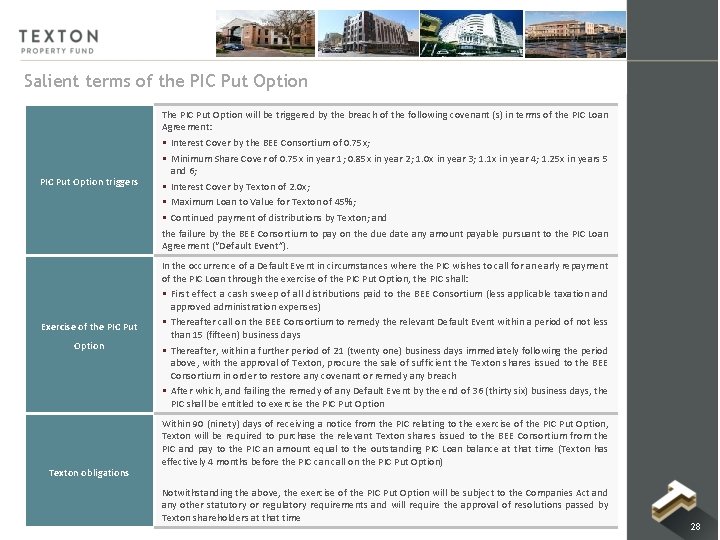
Salient terms of the PIC Put Option triggers Exercise of the PIC Put Option Texton obligations The PIC Put Option will be triggered by the breach of the following covenant (s) in terms of the PIC Loan Agreement: § Interest Cover by the BEE Consortium of 0. 75 x; § Minimum Share Cover of 0. 75 x in year 1; 0. 85 x in year 2; 1. 0 x in year 3; 1. 1 x in year 4; 1. 25 x in years 5 and 6; § Interest Cover by Texton of 2. 0 x; § Maximum Loan to Value for Texton of 45%; § Continued payment of distributions by Texton; and the failure by the BEE Consortium to pay on the due date any amount payable pursuant to the PIC Loan Agreement (“Default Event”). In the occurrence of a Default Event in circumstances where the PIC wishes to call for an early repayment of the PIC Loan through the exercise of the PIC Put Option, the PIC shall: § First effect a cash sweep of all distributions paid to the BEE Consortium (less applicable taxation and approved administration expenses) § Thereafter call on the BEE Consortium to remedy the relevant Default Event within a period of not less than 15 (fifteen) business days § Thereafter, within a further period of 21 (twenty one) business days immediately following the period above, with the approval of Texton, procure the sale of sufficient the Texton shares issued to the BEE Consortium in order to restore any covenant or remedy any breach § After which, and failing the remedy of any Default Event by the end of 36 (thirty six) business days, the PIC shall be entitled to exercise the PIC Put Option Within 90 (ninety) days of receiving a notice from the PIC relating to the exercise of the PIC Put Option, Texton will be required to purchase the relevant Texton shares issued to the BEE Consortium from the PIC and pay to the PIC an amount equal to the outstanding PIC Loan balance at that time (Texton has effectively 4 months before the PIC can call on the PIC Put Option) Notwithstanding the above, the exercise of the PIC Put Option will be subject to the Companies Act and any other statutory or regulatory requirements and will require the approval of resolutions passed by Texton shareholders at that time 28
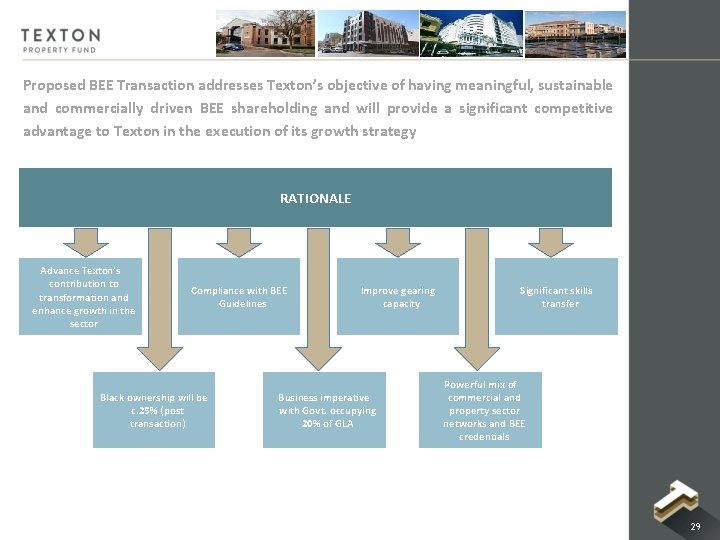
Proposed BEE Transaction addresses Texton’s objective of having meaningful, sustainable and commercially driven BEE shareholding and will provide a significant competitive advantage to Texton in the execution of its growth strategy RATIONALE Advance Texton’s contribution to transformation and enhance growth in the sector Compliance with BEE Guidelines Black ownership will be c. 25% (post transaction) Improve gearing capacity Business imperative with Govt. occupying 20% of GLA Significant skills transfer Powerful mix of commercial and property sector networks and BEE credentials 29
BEE SELECTION PROCESS Ensure maximum compliance with BEE Codes Inclusion of broad-based BEE participants and new entrants Existing networks and alliances within the property sector leading to improved deal flow Ability to assist Texton with its broader transformation initiatives Good commercial acumen and track record Ability to add value to growth strategy & provide commercial & operating assistance to Texton BEE CONSORTIUM Romeo Makhubela Zava Capital Patrick Ntshalintshali Zava Capital § Romeo has held various senior positions in reputable companies including Vunani Fund Managers, Metropolitan Asset Managers, STANLIB and Liberty Asset Management § Patrick has held various senior positions at Vunani Fund Managers and Old Mutual Asset Managers and previously served on the board of Mvelaphanda as a non-executive director § Bukelwa has over 12 years of experience in Investment Banking, having worked for 11 years in the Bukelwa Bulo Jade Capital Partners Private Equity Division of Investec Bank Limited. Bukelwa is currently a non-executive of Unispan Holdings and Franki Geotechnical Proprietary and a member of the Women’s Property Network in Gauteng § Zola has extensive property sector experience having previously been a director in the Real Estate Zola Ntwasa, Jade Capital Partners Finance Division of Standard Bank, heading up the New Business Team, where she was a member of the Executive Committee and the Deal Approval Committee. Zola currently serves as a nonexecutive director on the board of Hospitality Property Fund and is the Chairperson of the Women’s Property Network (Gauteng) and member of The South African Property Owners Association § Sahra is the Secretary General of the International Federation of Worker’s Education Association Sahra Ryklief Ditikeni (IFWEA), a position she has held since 2008. Sahra was a former director of the Labour Research Service (LRS), a position she held for a decade, until 2007. Sahra holds a master’s degree in political science from the University of Liverpool and is an adjunct professor in the School of Management and Labour Relation at Rugters University, New Jersey, USA 30
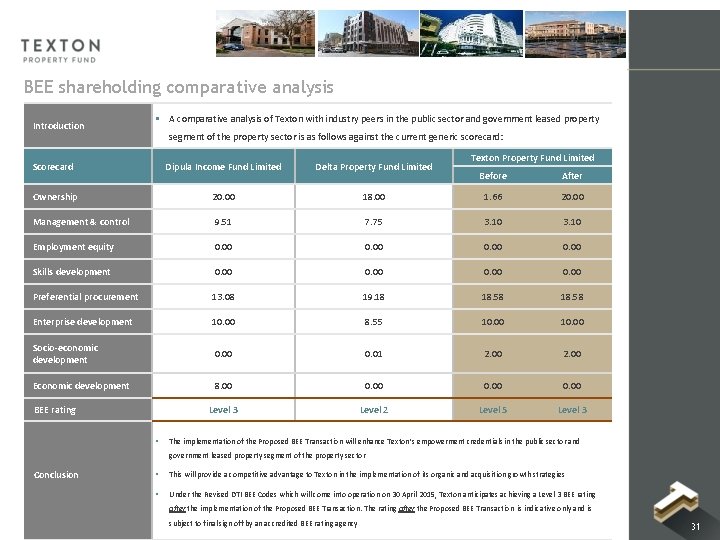
BEE shareholding comparative analysis Introduction § A comparative analysis of Texton with industry peers in the public sector and government leased property segment of the property sector is as follows against the current generic scorecard: Scorecard Dipula Income Fund Limited Delta Property Fund Limited Ownership 20. 00 Management & control Texton Property Fund Limited Before After 18. 00 1. 66 20. 00 9. 51 7. 75 3. 10 Employment equity 0. 00 Skills development 0. 00 Preferential procurement 13. 08 19. 18 18. 58 Enterprise development 10. 00 8. 55 10. 00 Socio-economic development 0. 00 0. 01 2. 00 Economic development 8. 00 0. 00 Level 3 Level 2 Level 5 Level 3 BEE rating § The implementation of the Proposed BEE Transaction will enhance Texton’s empowerment credentials in the public sector and government leased property segment of the property sector Conclusion § This will provide a competitive advantage to Texton in the implementation of its organic and acquisition growth strategies § Under the Revised DTI BEE Codes which will come into operation on 30 April 2015, Texton anticipates achieving a Level 3 BEE rating after the implementation of the Proposed BEE Transaction. The rating after the Proposed BEE Transaction is indicative only and is subject to final sign off by an accredited BEE rating agency 31
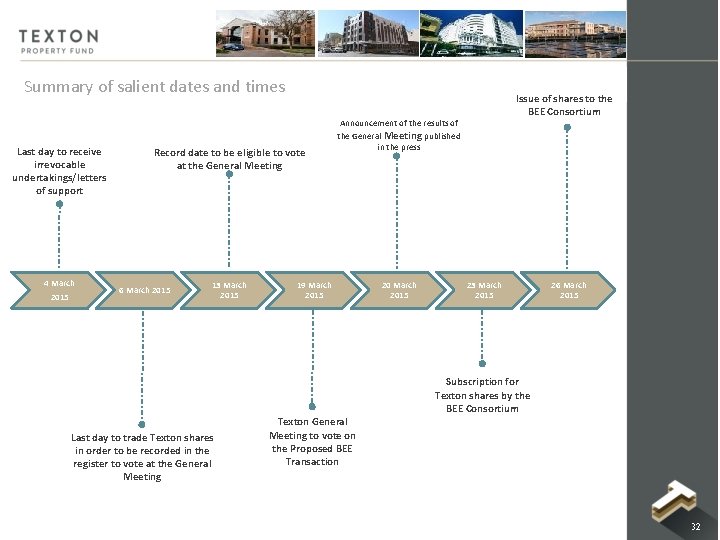
Summary of salient dates and times Last day to receive irrevocable undertakings/letters of support 4 March 2015 Record date to be eligible to vote at the General Meeting 6 March 2015 13 March 2015 Issue of shares to the BEE Consortium Announcement of the results of the General Meeting published in the press 19 March 2015 20 March 2015 23 March 2015 26 March 2015 Subscription for Texton shares by the BEE Consortium Last day to trade Texton shares in order to be recorded in the register to vote at the General Meeting Texton General Meeting to vote on the Proposed BEE Transaction 32
UNITED KINGDOM STRATEGY, ACQUISITIONS AND PIPELINE
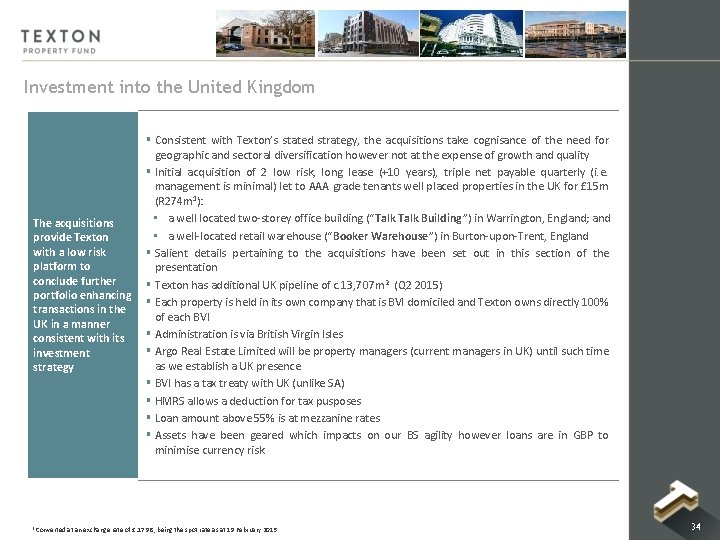
Investment into the United Kingdom § Consistent with Texton’s stated strategy, the acquisitions take cognisance of the need for geographic and sectoral diversification however not at the expense of growth and quality § Initial acquisition of 2 low risk, long lease (+10 years), triple net payable quarterly (i. e. management is minimal) let to AAA grade tenants well placed properties in the UK for £ 15 m (R 274 m 1): • a well located two-storey office building (“Talk Building”) in Warrington, England; and The acquisitions • a well-located retail warehouse (“Booker Warehouse”) in Burton-upon-Trent, England provide Texton with a low risk § Salient details pertaining to the acquisitions have been set out in this section of the platform to presentation conclude further § Texton has additional UK pipeline of c. 13, 707 m 2 (Q 2 2015) portfolio enhancing § Each property is held in its own company that is BVI domiciled and Texton owns directly 100% transactions in the of each BVI UK in a manner § Administration is via British Virgin Isles consistent with its § Argo Real Estate Limited will be property managers (current managers in UK) until such time investment as we establish a UK presence strategy § BVI has a tax treaty with UK (unlike SA) § HMRS allows a deduction for tax pusposes § Loan amount above 55% is at mezzanine rates § Assets have been geared which impacts on our BS agility however loans are in GBP to minimise currency risk 1 Converted at an exchange rate of £: 17. 98, being the spot rate as at 19 February 2015 34
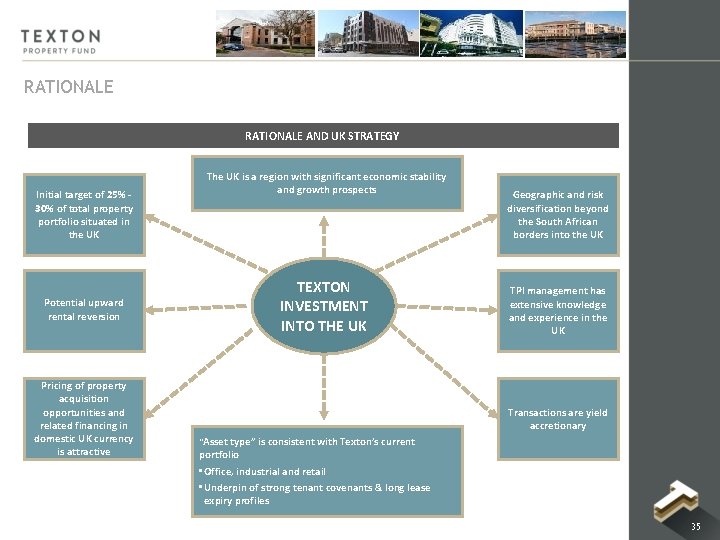
RATIONALE AND UK STRATEGY Initial target of 25% - 30% of total property portfolio situated in the UK Potential upward rental reversion Pricing of property acquisition opportunities and related financing in domestic UK currency is attractive The UK is a region with significant economic stability and growth prospects TEXTON INVESTMENT INTO THE UK Geographic and risk diversification beyond the South African borders into the UK TPI management has extensive knowledge and experience in the UK Transactions are yield accretionary “Asset type” is consistent with Texton’s current portfolio • Office, industrial and retail • Underpin of strong tenant covenants & long lease expiry profiles 35
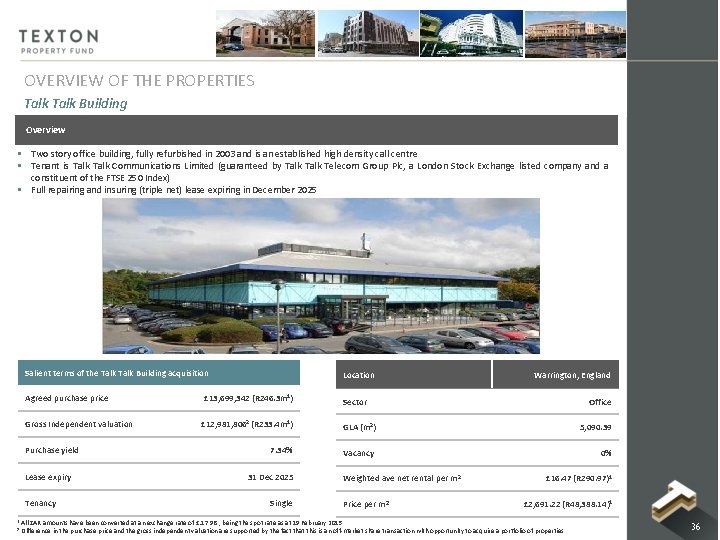
OVERVIEW OF THE PROPERTIES Talk Building Overview § Two story office building, fully refurbished in 2003 and is an established high density call centre § Tenant is Talk Communications Limited (guaranteed by Talk Telecom Group Plc, a London Stock Exchange listed company and a constituent of the FTSE 250 Index) § Full repairing and insuring (triple net) lease expiring in December 2025 Salient terms of the Talk Building acquisition Location Agreed purchase price Sector Gross Independent valuation Purchase yield Lease expiry Tenancy £ 13, 699, 342 (R 246. 3 m 1) Warrington, England Office £ 12, 981, 8062 (R 233. 4 m 1) GLA (m 2) 5, 090. 39 7. 34% Vacancy 0% 31 Dec 2025 Single 1 All ZAR amounts have been converted at an exchange rate of £: 17. 98 , being the spot rate as at 19 February 2015 Weighted ave net rental per m 2 Price per m² £ 16. 47 (R 290. 97)1 £ 2, 691. 22 (R 48, 388. 14)1 2 Difference in the purchase price and the gross independent valuation are supported by the fact that this is an off-market share transaction with opportunity to acquire a portfolio of properties 36
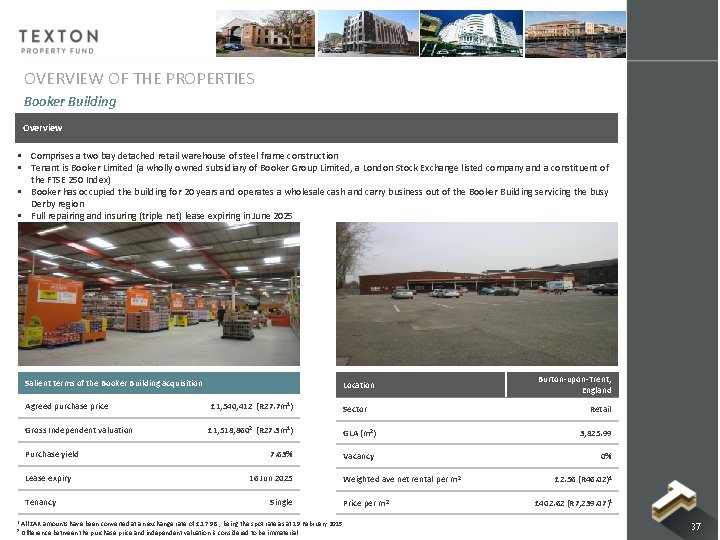
OVERVIEW OF THE PROPERTIES Booker Building Overview § Comprises a two bay detached retail warehouse of steel frame construction § Tenant is Booker Limited (a wholly owned subsidiary of Booker Group Limited, a London Stock Exchange listed company and a constituent of the FTSE 250 Index) § Booker has occupied the building for 20 years and operates a wholesale cash and carry business out of the Booker Building servicing the busy Derby region § Full repairing and insuring (triple net) lease expiring in June 2025 Salient terms of the Booker Building acquisition Agreed purchase price Gross Independent valuation Purchase yield Lease expiry Tenancy Location £ 1, 540, 412 (R 27. 7 m 1) Sector Burton-upon-Trent, England Retail £ 1, 518, 8602 (R 27. 3 m 1) GLA (m 2) 3, 825. 99 7. 63% Vacancy 0% 16 Jun 2025 Single Weighted ave net rental per m 2 Price per m² 1 All ZAR amounts have been converted at an exchange rate of £: 17. 98 , being the spot rate as at 19 February 2015 2 Difference between the purchase price and independent valuation is considered to be immaterial £ 2. 56 (R 46. 02)1 £ 402. 62 (R 7, 239. 07)1 37
UK Pipeline TEXTON HAS A SOLID PIPELINE OF UK ACQUISITIONS § Retail and office portfolio § Approximately 13, 707 m 2 (Q 2 2015) under negotiation § Long lease expiry profiles § Blue chip listed tenants § c. 25% of assets will be in the UK (c. R 860 m) by FYE 38
OUTLOOK AND CONCLUSION
A solid platform on which to build into the future has been established. Portfolio continues to perform well (despite difficult economic environment) Continued focus on our strategy of growing the fund with yield enhancing assets without compromising on quality Additional expansion into the UK following acquisition of 2 well-placed properties in the £ 15. 2 m and additional pipeline at an advanced stage Greening projects are progressing well and fund remains committed to this strategy OUTLOOK Leverage our BEE credentials. BEE transaction to be voted on 19 March 2015 Hard at work on leases expiring in the next 12 months and are confident that we will keep our vacancies well below country averages Perform in line with or above the listed property sector performance for the next financial year 40
CONCLUSION PORTFOLIO § § § Current portfolio has limited risk Continue to deliver above market distributions Skills, networks and staffing to take Texton to the next level Diversified geographic and sectoral spread Solid pipeline Deliver on strategy PROPOSED BEE TRANSACTION § § § Enhanced BEE rating Excellent new BEE partners Business imperative Vote to take place on 19 March 2015 No yield dilution for existing shareholders UK ACQUISITIONS § Low risk entry to UK § UK is recovering and poised for growth § Acquisitions take cognisance of the need for geographic and sector diversification however not at the expense of growth and quality § Further pipeline of acquisitions (Q 2 2015) LTV POST BEE AND UK § Current LTV of 34. 7% § LTV of 35. 4% post BEE and UK transactions (assuming funds from BEE are used for property acquisitions) 41
ANNEXURE I ACQUISITIONS IN PAST 6 MONTHS 42
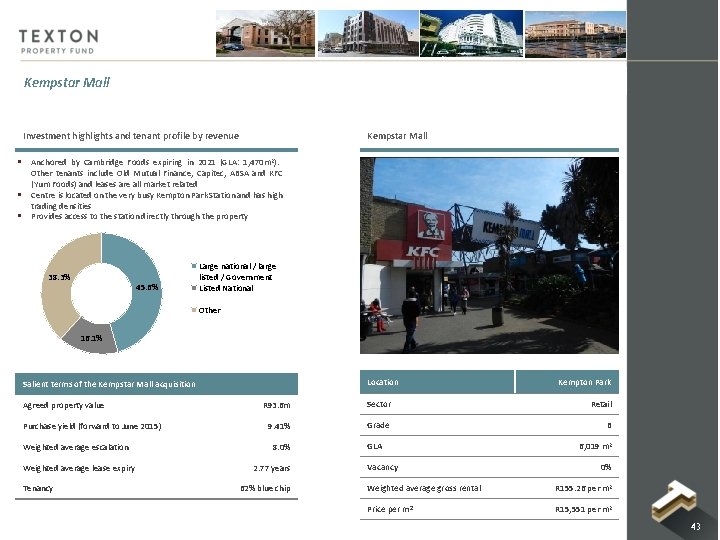
Kempstar Mall Investment highlights and tenant profile by revenue § § § Kempstar Mall Anchored by Cambridge Foods expiring in 2021 (GLA: 1, 470 m 2). Other tenants include Old Mutual Finance, Capitec, ABSA and KFC (Yum Foods) and leases are all market related Centre is located on the very busy Kempton Park Station and has high trading densities Provides access to the station directly through the property 38. 3% 45. 6% Large national / large listed / Government Listed National Other 16. 1% Location Salient terms of the Kempstar Mall acquisition Agreed property value Purchase yield (forward to June 2015) Weighted average escalation Weighted average lease expiry Tenancy Kempton Park R 93. 6 m Sector Retail 9. 41% Grade B 8. 0% 2. 77 years 62% blue chip GLA Vacancy 6, 019 m 2 0% Weighted average gross rental R 155. 26 per m 2 Price per m² R 15, 551 per m 2 43
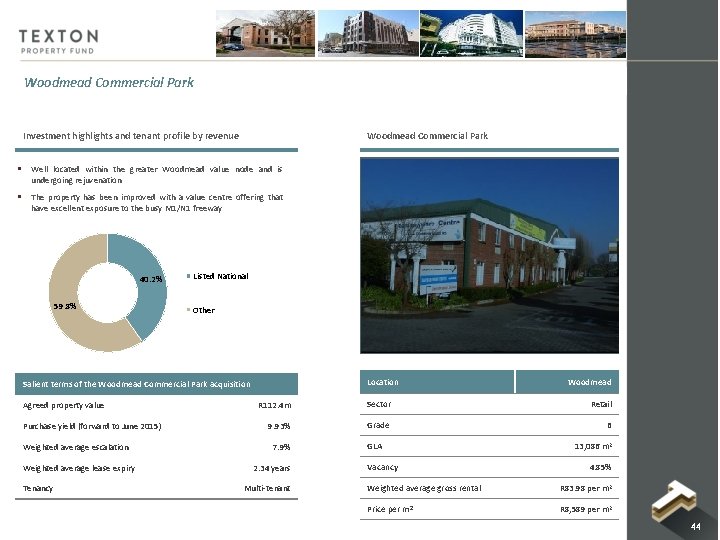
Woodmead Commercial Park Investment highlights and tenant profile by revenue Woodmead Commercial Park § Well located within the greater Woodmead value node and is undergoing rejuvenation § The property has been improved with a value centre offering that have excellent exposure to the busy M 1/N 1 freeway 40. 2% 59. 8% Listed National Other Location Salient terms of the Woodmead Commercial Park acquisition Agreed property value Purchase yield (forward to June 2015) Weighted average escalation Weighted average lease expiry Tenancy Woodmead R 112. 4 m Sector Retail 9. 93% Grade B 7. 9% 2. 34 years Multi-tenant GLA Vacancy 13, 086 m 2 4. 85% Weighted average gross rental R 83. 98 per m 2 Price per m² R 8, 589 per m 2 44
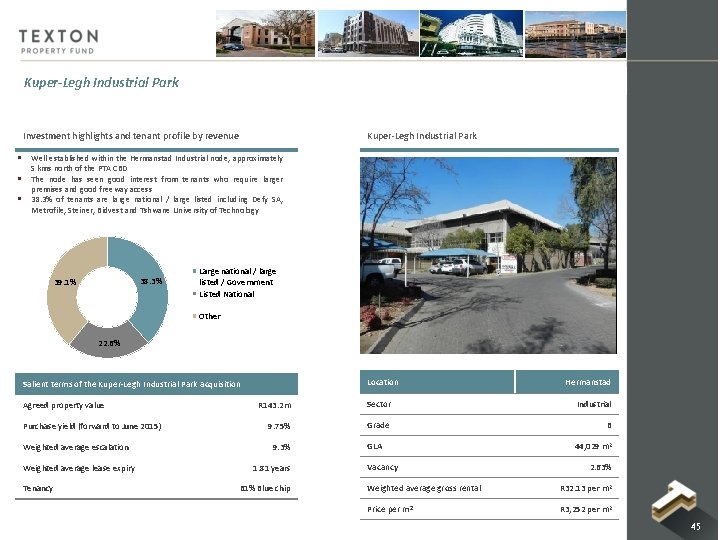
Kuper-Legh Industrial Park Investment highlights and tenant profile by revenue § § § Kuper-Legh Industrial Park Well established within the Hermanstad Industrial node, approximately 5 kms north of the PTA CBD The node has seen good interest from tenants who require larger premises and good freeway access 38. 3% of tenants are large national / large listed including Defy SA, Metrofile, Steiner, Bidvest and Tshwane University of Technology 38. 3% 39. 1% Large national / large listed / Government Listed National Other 22. 6% Location Salient terms of the Kuper-Legh Industrial Park acquisition Agreed property value Purchase yield (forward to June 2015) Weighted average escalation Weighted average lease expiry Tenancy Hermanstad R 143. 2 m Sector Industrial 9. 75% Grade B 9. 3% 1. 81 years 61% Blue chip GLA Vacancy 44, 029 m 2 2. 63% Weighted average gross rental R 32. 13 per m 2 Price per m² R 3, 252 per m 2 45
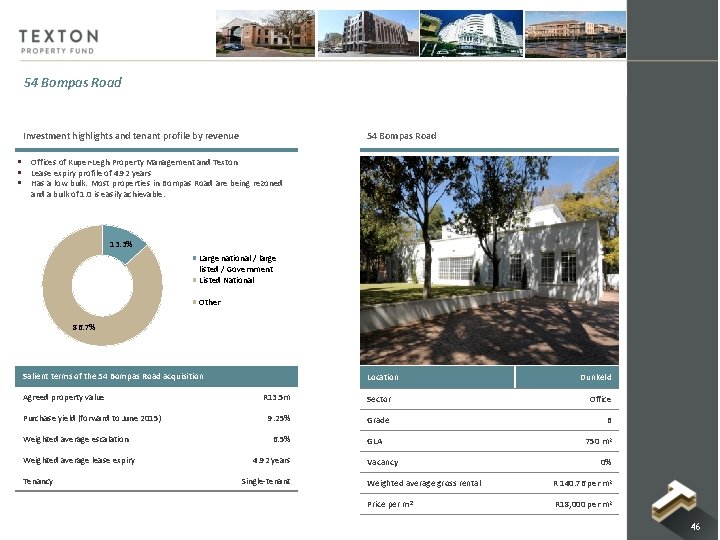
54 Bompas Road Investment highlights and tenant profile by revenue § § § 54 Bompas Road Offices of Kuper-Legh Property Management and Texton Lease expiry profile of 4. 92 years Has a low bulk. Most properties in Bompas Road are being rezoned and a bulk of 1. 0 is easily achievable. 13. 3% Large national / large listed / Government Listed National Other 86. 7% Salient terms of the 54 Bompas Road acquisition Agreed property value Purchase yield (forward to June 2015) Weighted average escalation Weighted average lease expiry Tenancy Location Dunkeld R 13. 5 m Sector Office 9. 25% Grade B 6. 5% 4. 92 years Single-tenant GLA Vacancy 750 m 2 0% Weighted average gross rental R 140. 76 per m 2 Price per m² R 18, 000 per m 2 46
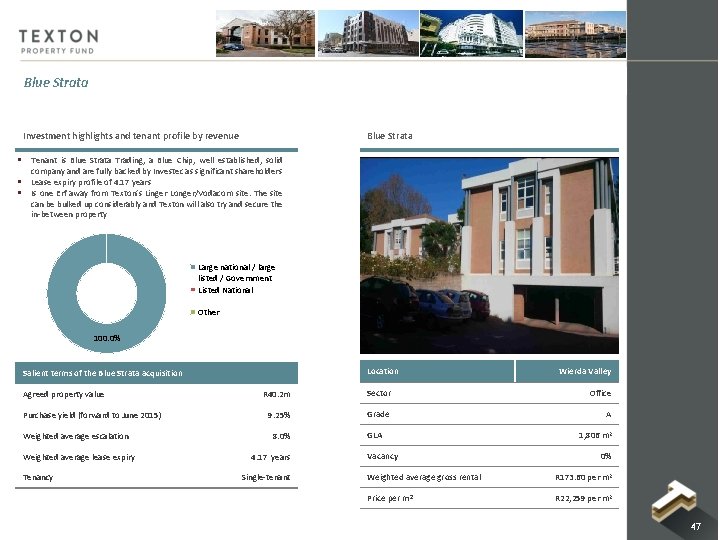
Blue Strata Investment highlights and tenant profile by revenue § § § Blue Strata Tenant is Blue Strata Trading, a Blue Chip, well established, solid company and are fully backed by Investec as significant shareholders Lease expiry profile of 4. 17 years Is one Erf away from Texton’s Linger Longer/Vodacom site. The site can be bulked up considerably and Texton will also try and secure the in-between property Large national / large listed / Government Listed National Other 100. 0% Location Salient terms of the Blue Strata acquisition Agreed property value Purchase yield (forward to June 2015) Weighted average escalation Weighted average lease expiry Tenancy Wierda Valley R 40. 2 m Sector Office 9. 25% Grade A 8. 0% 4. 17 years Single-tenant GLA Vacancy 1, 806 m 2 0% Weighted average gross rental R 173. 60 per m 2 Price per m² R 22, 259 per m 2 47
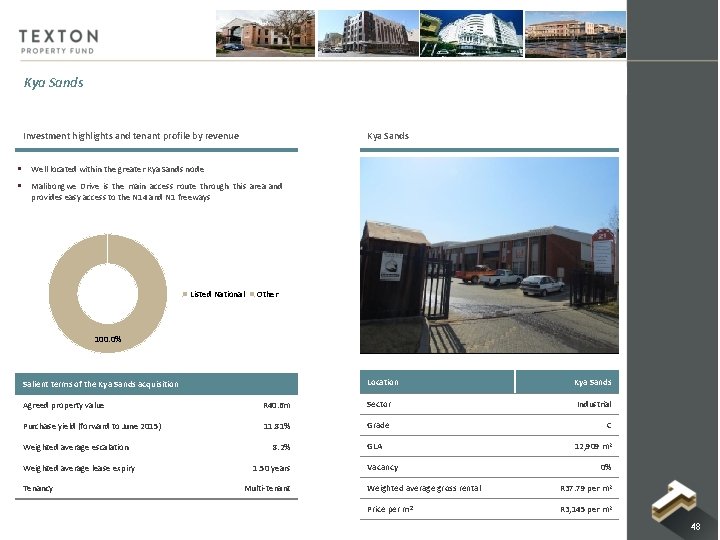
Kya Sands Investment highlights and tenant profile by revenue Kya Sands § Well located within the greater Kya Sands node § Malibongwe Drive is the main access route through this area and provides easy access to the N 14 and N 1 freeways Listed National Other 100. 0% Location Salient terms of the Kya Sands acquisition Kya Sands Agreed property value R 40. 6 m Sector Industrial Purchase yield (forward to June 2015) 11. 81% Grade C Weighted average escalation Weighted average lease expiry Tenancy 8. 2% 1. 50 years Multi-tenant GLA Vacancy 12, 909 m 2 0% Weighted average gross rental R 37. 79 per m 2 Price per m² R 3, 145 per m 2 48
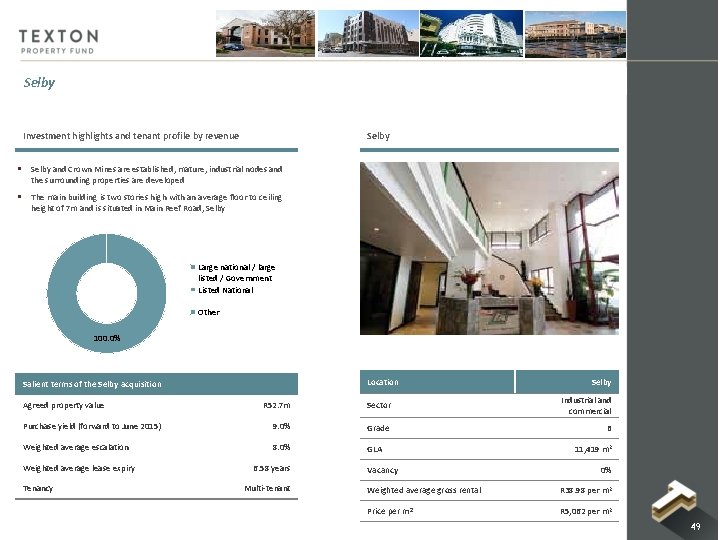
Selby Investment highlights and tenant profile by revenue Selby § Selby and Crown Mines are established, mature, industrial nodes and the surrounding properties are developed § The main building is two stories high with an average floor to ceiling height of 7 m and is situated in Main Reef Road, Selby Large national / large listed / Government Listed National Other 100. 0% Location Salient terms of the Selby acquisition Selby R 52. 7 m Sector Industrial and commercial Purchase yield (forward to June 2015) 9. 0% Grade B Weighted average escalation 8. 0% GLA Agreed property value Weighted average lease expiry Tenancy 6. 58 years Multi-tenant Vacancy 11, 419 m 2 0% Weighted average gross rental R 38. 98 per m 2 Price per m² R 5, 062 per m 2 49
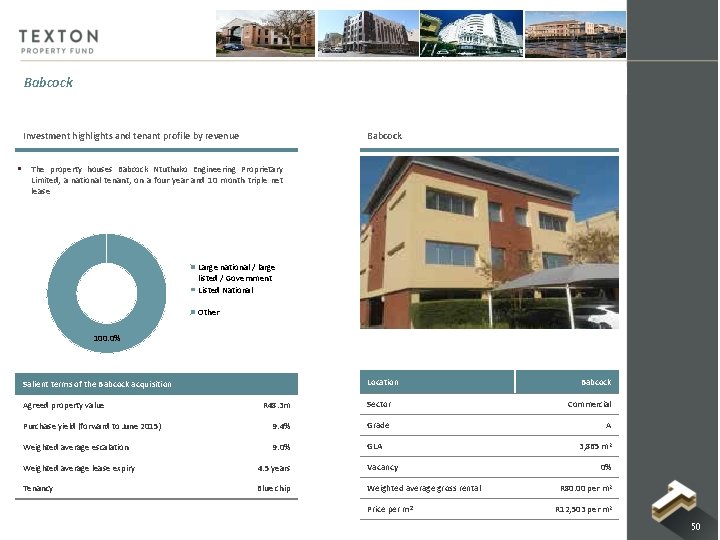
Babcock Investment highlights and tenant profile by revenue § Babcock The property houses Babcock Ntuthuko Engineering Proprietary Limited, a national tenant, on a four year and 10 month triple net lease Large national / large listed / Government Listed National Other 100. 0% Location Salient terms of the Babcock acquisition Babcock R 48. 3 m Sector Commercial Purchase yield (forward to June 2015) 9. 4% Grade A Weighted average escalation 9. 0% GLA Agreed property value Weighted average lease expiry 4. 5 years Vacancy Tenancy Blue chip Weighted average gross rental Price per m² 3, 865 m 2 0% R 80. 00 per m 2 R 12, 503 per m 2 50
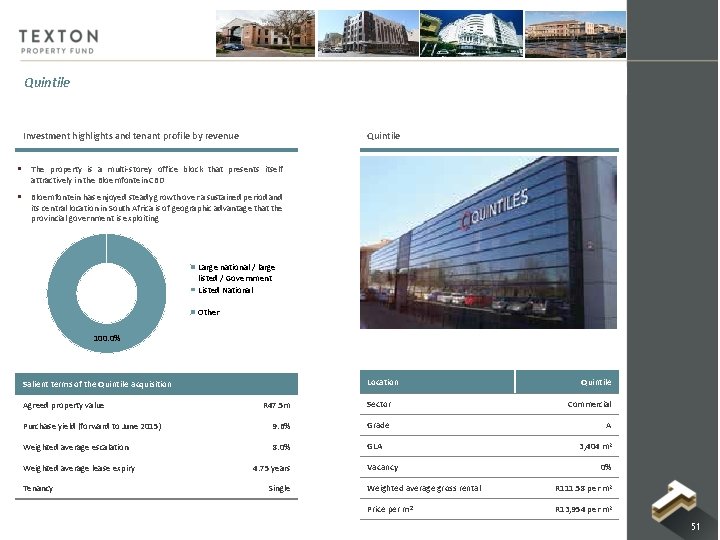
Quintile Investment highlights and tenant profile by revenue Quintile § The property is a multi-storey office block that presents itself attractively in the Bloemfontein CBD § Bloemfontein has enjoyed steady growth over a sustained period and its central location in South Africa is of geographic advantage that the provincial government is exploiting Large national / large listed / Government Listed National Other 100. 0% Location Salient terms of the Quintile acquisition Quintile R 47. 5 m Sector Commercial Purchase yield (forward to June 2015) 9. 6% Grade A Weighted average escalation 8. 0% GLA Agreed property value Weighted average lease expiry Tenancy 4. 75 years Single Vacancy 3, 404 m 2 0% Weighted average gross rental R 111. 58 per m 2 Price per m² R 13, 954 per m 2 51
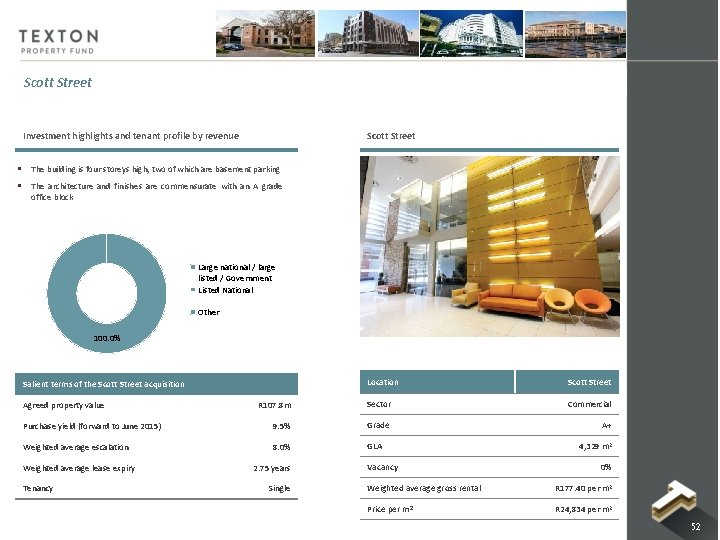
Scott Street Investment highlights and tenant profile by revenue Scott Street § The building is four storeys high, two of which are basement parking § The architecture and finishes are commensurate with an A grade office block Large national / large listed / Government Listed National Other 100. 0% Location Scott Street R 107. 8 m Sector Commercial Purchase yield (forward to June 2015) 9. 5% Grade A+ Weighted average escalation 8. 0% GLA Salient terms of the Scott Street acquisition Agreed property value Weighted average lease expiry Tenancy 2. 75 years Single Vacancy 4, 329 m 2 0% Weighted average gross rental R 177. 40 per m 2 Price per m² R 24, 834 per m 2 52
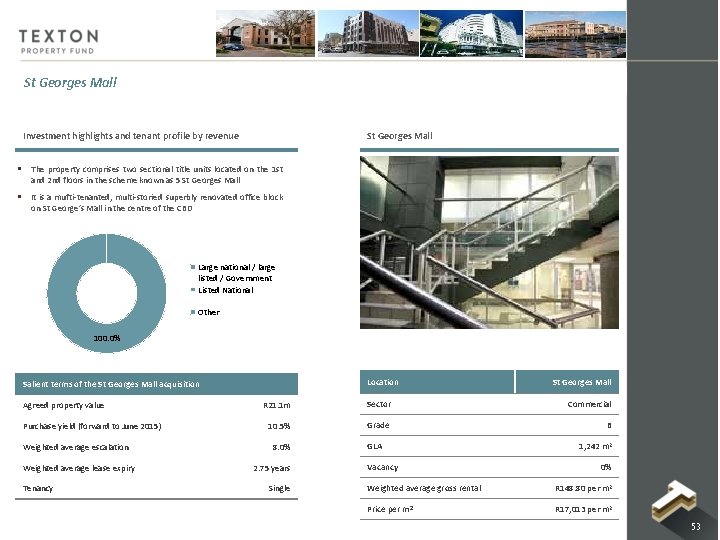
St Georges Mall Investment highlights and tenant profile by revenue St Georges Mall § The property comprises two sectional title units located on the 1 st and 2 nd floors in the scheme known as 5 St Georges Mall § It is a mufti-tenanted, multi-storied superbly renovated office block on St George’s Mall in the centre of the CBD Large national / large listed / Government Listed National Other 100. 0% Location Salient terms of the St Georges Mall acquisition Agreed property value Purchase yield (forward to June 2015) Weighted average escalation Weighted average lease expiry Tenancy St Georges Mall R 21. 1 m Sector Commercial 10. 5% Grade B 8. 0% 2. 75 years Single GLA Vacancy 1, 242 m 2 0% Weighted average gross rental R 148. 80 per m 2 Price per m² R 17, 013 per m 2 53
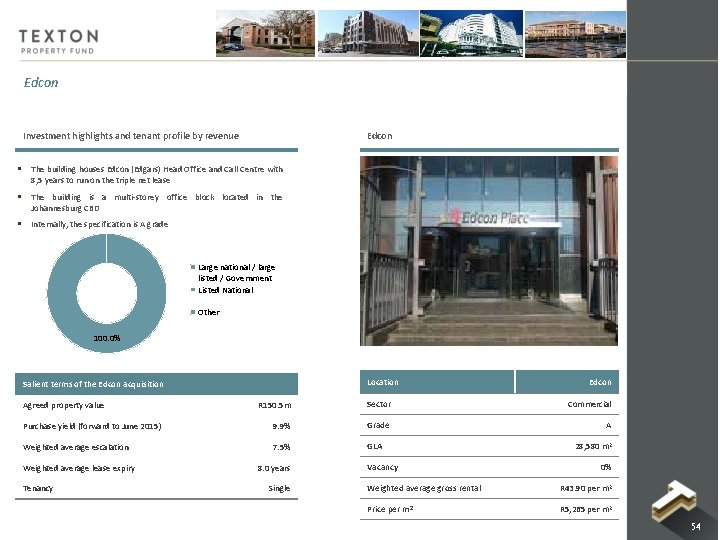
Edcon Investment highlights and tenant profile by revenue Edcon § The building houses Edcon (Edgars) Head Office and Call Centre with 8, 5 years to run on the triple net lease § The building is a multi-storey office block located in the Johannesburg CBD § Internally, the specification is A grade Large national / large listed / Government Listed National Other 100. 0% Location Salient terms of the Edcon acquisition Edcon R 150. 5 m Sector Commercial Purchase yield (forward to June 2015) 9. 9% Grade A Weighted average escalation 7. 5% GLA Agreed property value Weighted average lease expiry Tenancy 8. 0 years Single Vacancy 28, 580 m 2 0% Weighted average gross rental R 43. 90 per m 2 Price per m² R 5, 265 per m 2 54