Descon Oxychem Limited OPERATING A 34 000 TPA
- Slides: 23
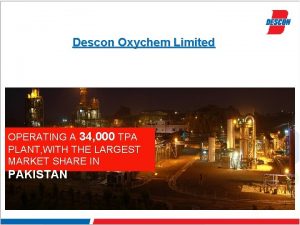
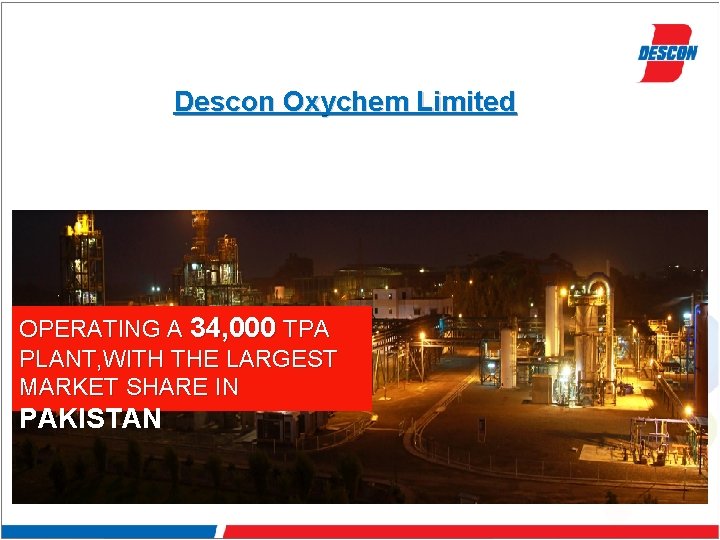
Descon Oxychem Limited OPERATING A 34, 000 TPA PLANT, WITH THE LARGEST MARKET SHARE IN PAKISTAN
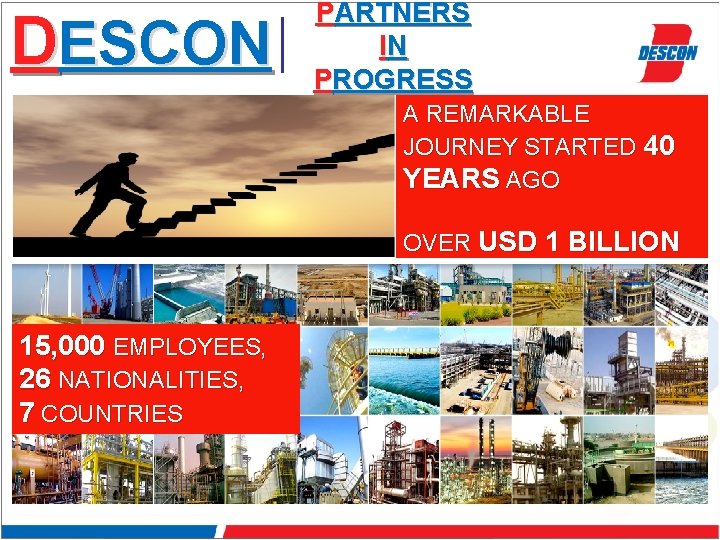
DESCON PARTNERS IN PROGRESS A REMARKABLE JOURNEY STARTED 40 YEARS AGO OVER USD 1 BILLION IN ANNUAL REVENUES 15, 000 EMPLOYEES, 26 NATIONALITIES, 7 COUNTRIES
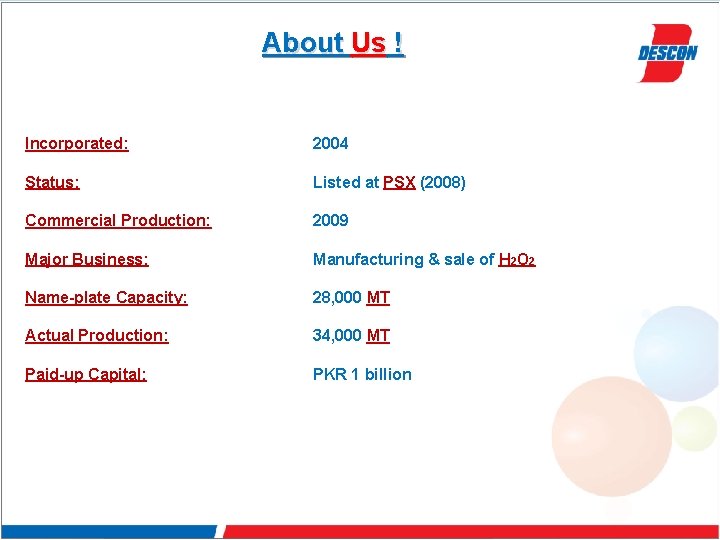
About Us ! Incorporated: 2004 Status: Listed at PSX (2008) Commercial Production: 2009 Major Business: Manufacturing & sale of H 2 O 2 Name-plate Capacity: 28, 000 MT Actual Production: 34, 000 MT Paid-up Capital: PKR 1 billion
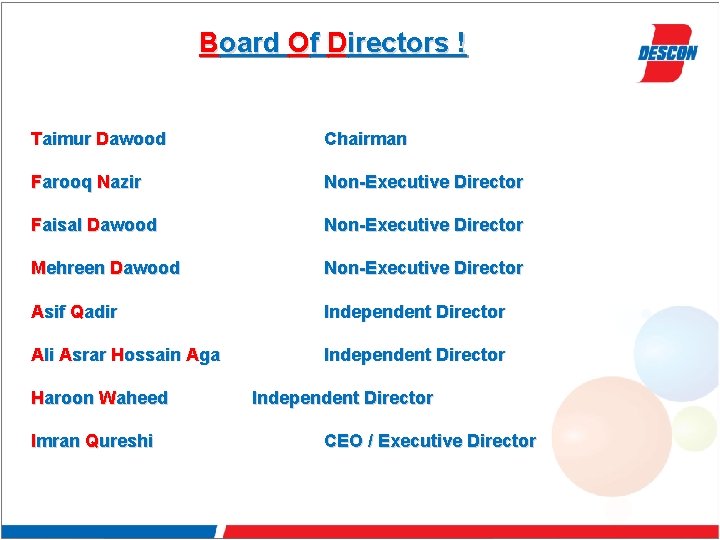
Board Of Directors ! Taimur Dawood Chairman Farooq Nazir Non-Executive Director Faisal Dawood Non-Executive Director Mehreen Dawood Non-Executive Director Asif Qadir Independent Director Ali Asrar Hossain Aga Independent Director Haroon Waheed Imran Qureshi Independent Director CEO / Executive Director
Corporate Surveillance
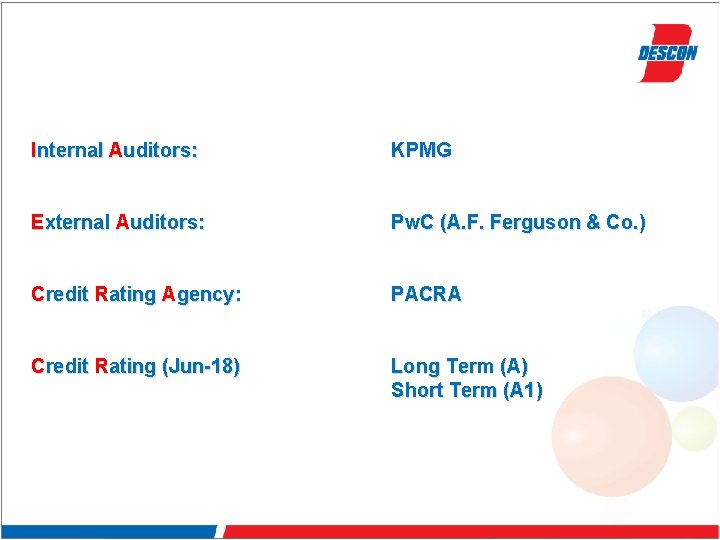
Internal Auditors: KPMG External Auditors: Pw. C (A. F. Ferguson & Co. ) Credit Rating Agency: PACRA Credit Rating (Jun-18) Long Term (A) Short Term (A 1)
Quality, Health, Safety & Environment
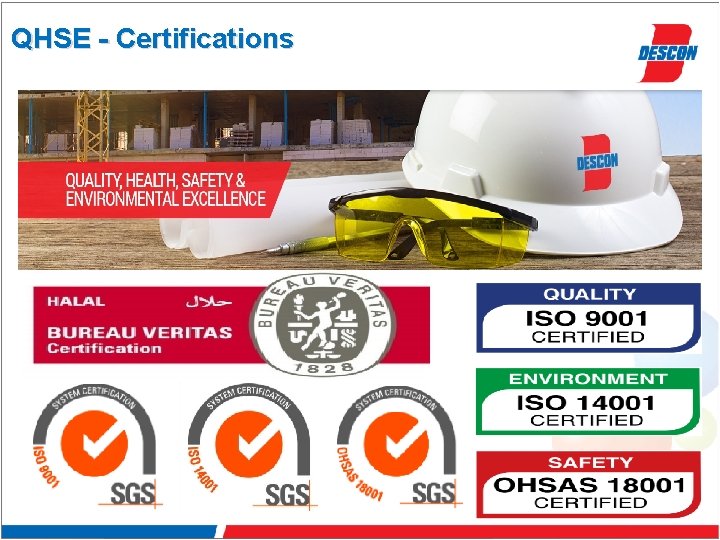
QHSE - Certifications
Production
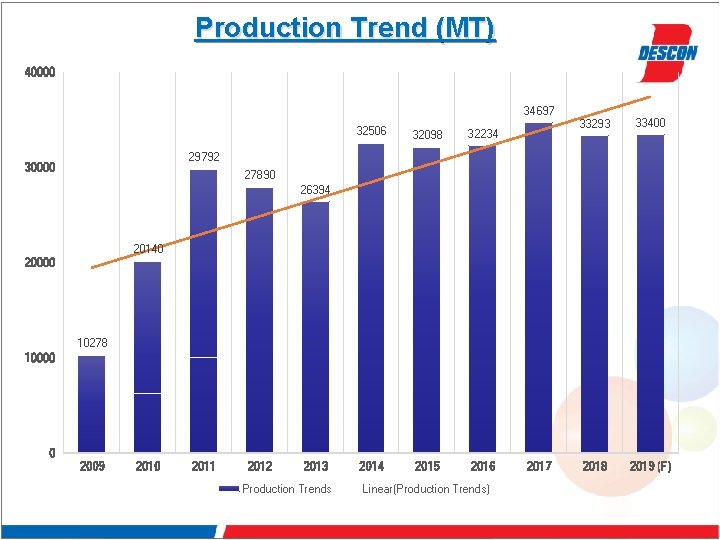
Production Trend (MT) 40000 34697 32506 32098 32234 2015 2016 33293 33400 2018 2019 (F) 29792 30000 27890 26394 20140 20000 10278 10000 0 2009 2010 2011 2012 2013 Production Trends Linear(Production Trends) 2017
Industry & Markets
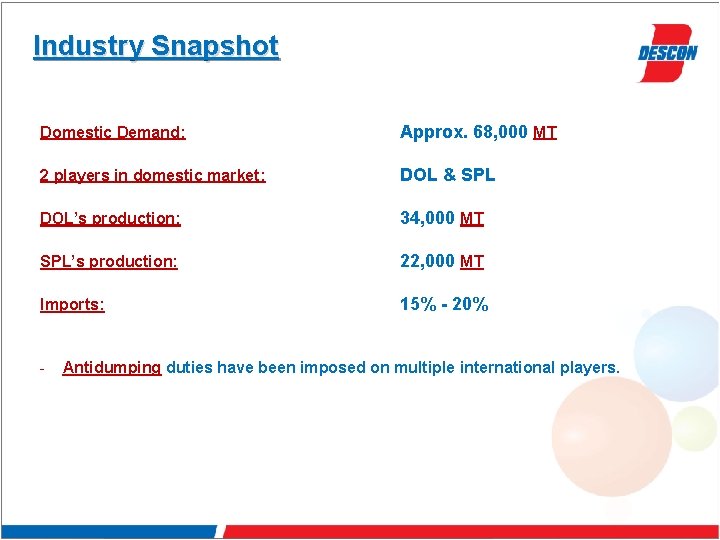
Industry Snapshot Domestic Demand: Approx. 68, 000 MT 2 players in domestic market: DOL & SPL DOL’s production: 34, 000 MT SPL’s production: 22, 000 MT Imports: 15% - 20% - Antidumping duties have been imposed on multiple international players.
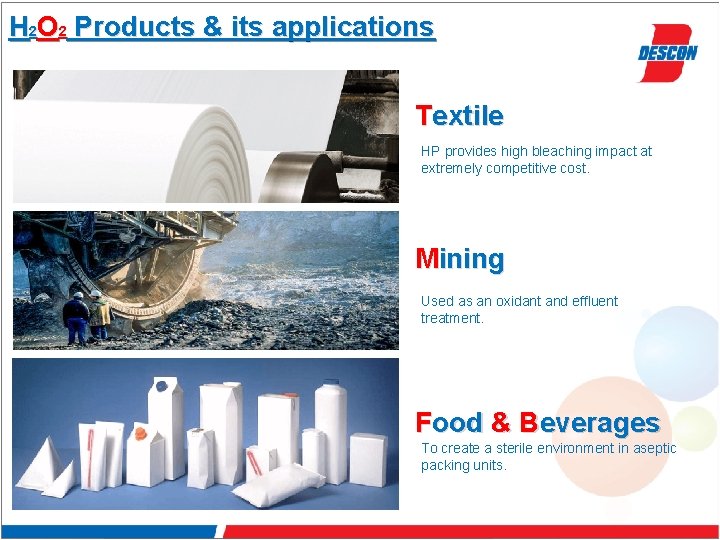
H 2 O 2 Products & its applications Textile HP provides high bleaching impact at extremely competitive cost. Mining Used as an oxidant and effluent treatment. Food & Beverages To create a sterile environment in aseptic packing units.
Market Potential • • • Cosmetic Water Treatment Livestock Poultry Tetrapak Disinfection * Potential of above markets is in the range of 18 to 20 KMT per annum. Descon Oxychem Limited
Key Financial Indicators
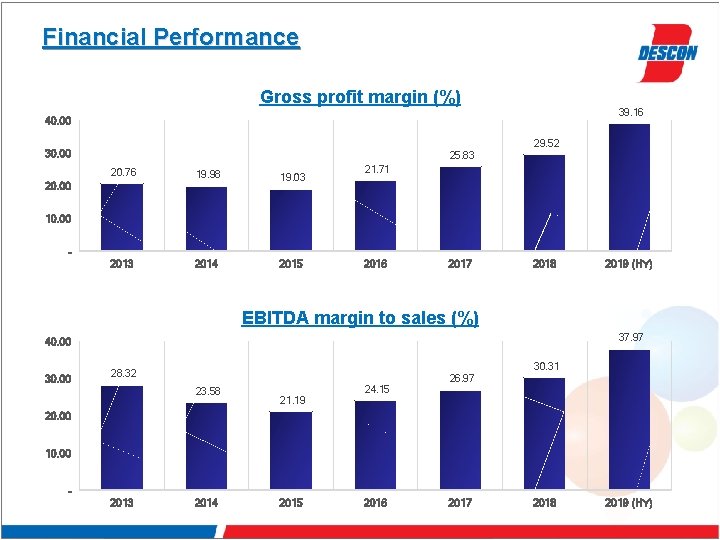
Financial Performance Gross profit margin (%) 39. 16 40. 00 29. 52 30. 00 25. 83 20. 76 19. 98 19. 03 2014 2015 20. 00 21. 71 10. 00 2016 2017 2018 2019 (HY) EBITDA margin to sales (%) 37. 97 40. 00 30. 31 28. 32 23. 58 21. 19 24. 15 26. 97 20. 00 10. 00 2013 2014 2015 2016 2017 2018 2019 (HY)
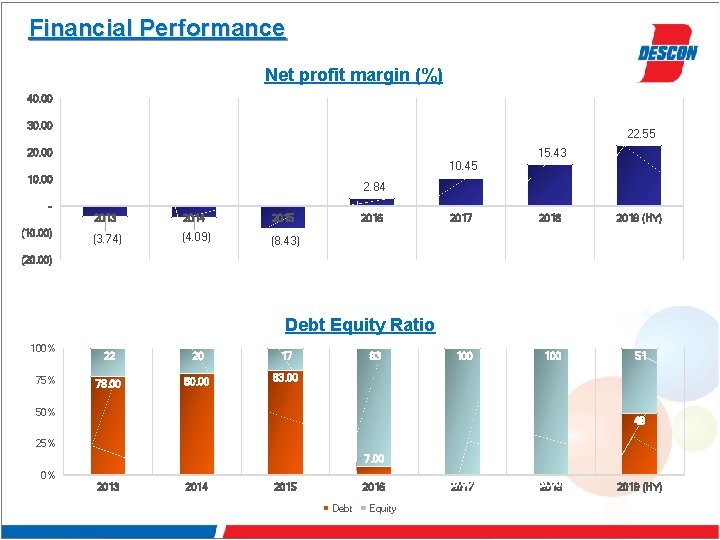
Financial Performance Net profit margin (%) 40. 00 30. 00 22. 55 15. 43 20. 00 10. 45 10. 00 2. 84 (10. 00) 2013 2014 2015 (3. 74) (4. 09) (8. 43) 2016 2017 2018 2019 (HY) 100 51 (20. 00) Debt Equity Ratio 100% 75% 22 20 17 78. 00 80. 00 83. 00 93 50% 49 25% 7. 00 0% 2013 2014 2015 2016 Debt Equity 0. 00 2017 0. 00 2018 2019 (HY)
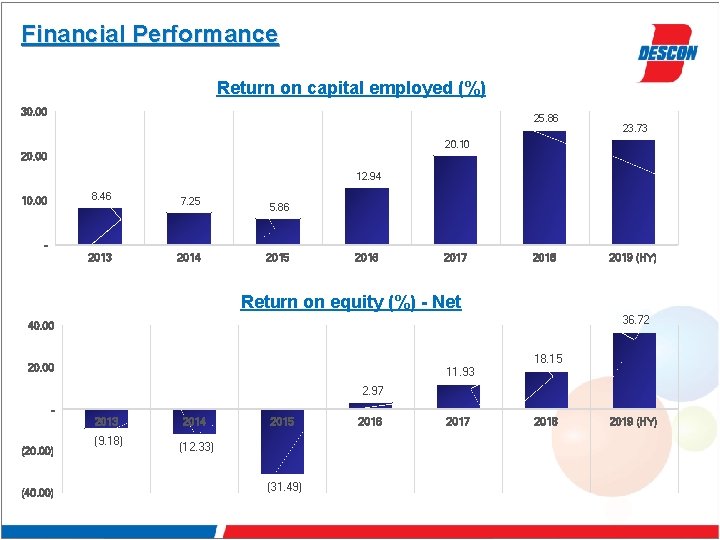
Financial Performance Return on capital employed (%) 30. 00 25. 86 23. 73 20. 10 20. 00 12. 94 8. 46 10. 00 7. 25 5. 86 2013 2014 2015 2016 2017 2018 2019 (HY) Return on equity (%) - Net 36. 72 40. 00 18. 15 20. 00 11. 93 2. 97 2013 (20. 00) (40. 00) (9. 18) 2014 2015 (12. 33) (31. 49) 2016 2017 2018 2019 (HY)
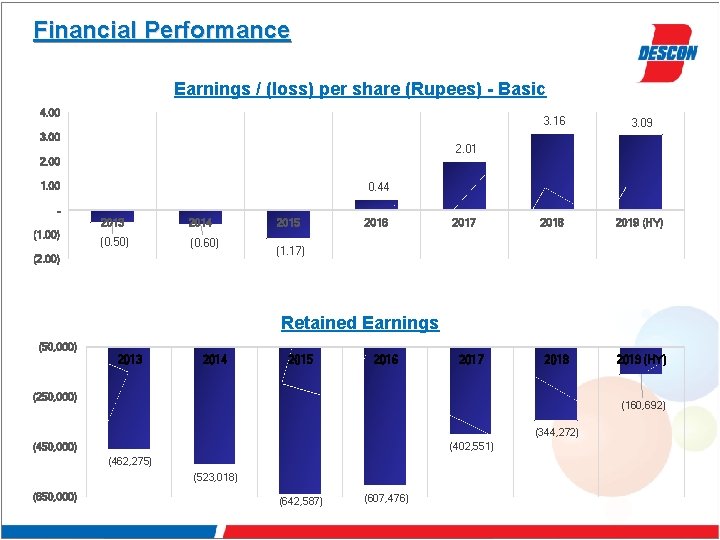
Financial Performance Earnings / (loss) per share (Rupees) - Basic 4. 00 3. 16 3. 09 2018 2019 (HY) 2. 01 2. 00 1. 00 0. 44 (1. 00) 2013 2014 (0. 50) (0. 60) (2. 00) 2015 2016 2017 (1. 17) Retained Earnings (50, 000) 2013 2014 2015 2016 2017 2018 (250, 000) (160, 692) (344, 272) (402, 551) (450, 000) (462, 275) (523, 018) (650, 000) 2019 (HY) (642, 587) (607, 476)
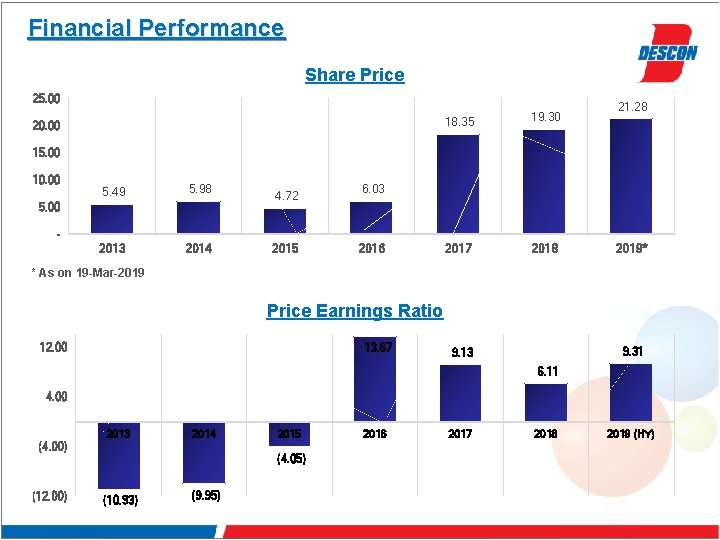
Financial Performance Share Price 25. 00 20. 00 18. 35 19. 30 2017 2018 21. 28 15. 00 10. 00 5. 49 5. 98 2013 2014 5. 00 4. 72 6. 03 - 2015 2016 2019* * As on 19 -Mar-2019 Price Earnings Ratio 12. 00 13. 67 9. 31 9. 13 6. 11 4. 00 2013 2014 (4. 00) (12. 00) 2015 (4. 05) (10. 93) (9. 95) 2016 2017 2018 2019 (HY)
Way Forward
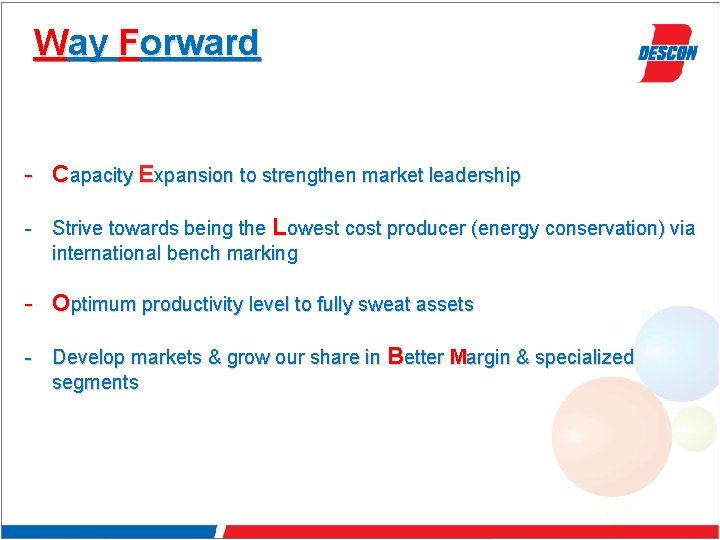
Way Forward - Capacity Expansion to strengthen market leadership - Strive towards being the Lowest cost producer (energy conservation) via international bench marking - Optimum productivity level to fully sweat assets - Develop markets & grow our share in Better Margin & specialized segments
Thank You ! Q &A