Presented To Georgia Rural Development Council Tifton Ga


- Slides: 32
Presented To: Georgia Rural Development Council Tifton, Ga. May 22, 2017
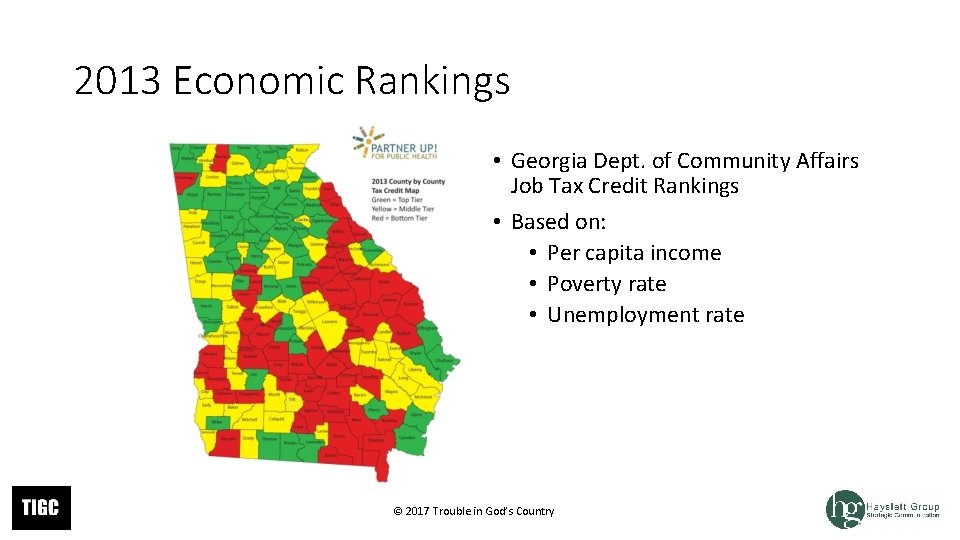
2013 Economic Rankings • Georgia Dept. of Community Affairs Job Tax Credit Rankings • Based on: • Per capita income • Poverty rate • Unemployment rate © 2017 Trouble in God’s Country
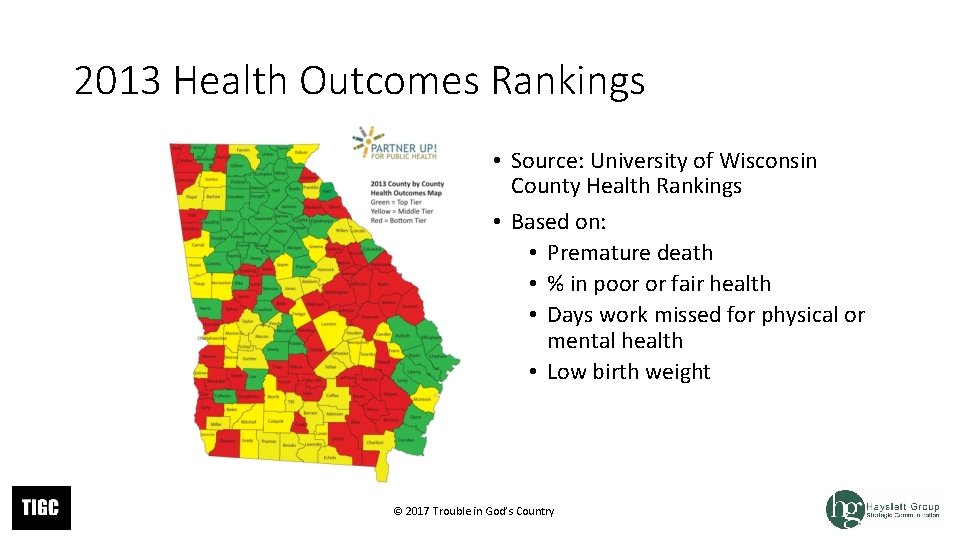
2013 Health Outcomes Rankings • Source: University of Wisconsin County Health Rankings • Based on: • Premature death • % in poor or fair health • Days work missed for physical or mental health • Low birth weight © 2017 Trouble in God’s Country
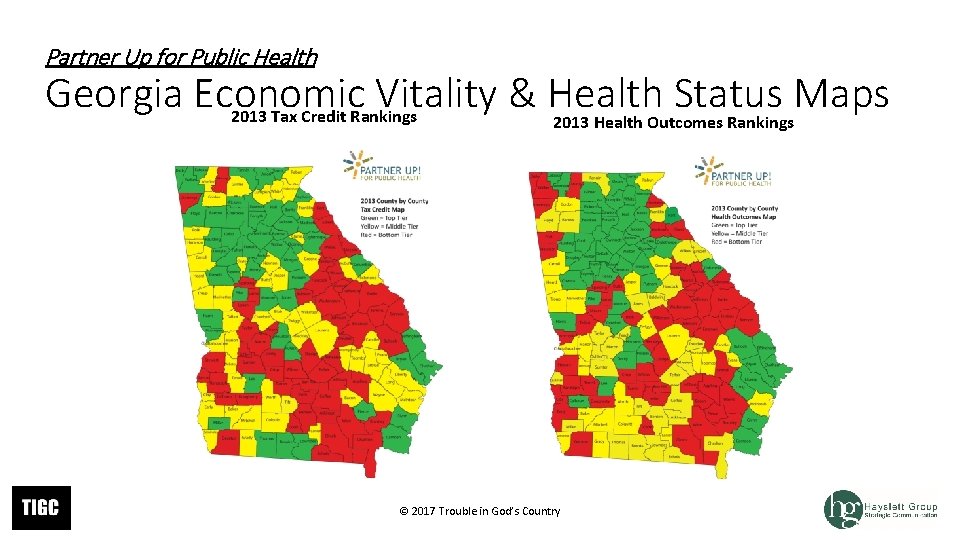
Partner Up for Public Health Georgia Economic Vitality & Health Status Maps 2013 Tax Credit Rankings 2013 Health Outcomes Rankings © 2017 Trouble in God’s Country
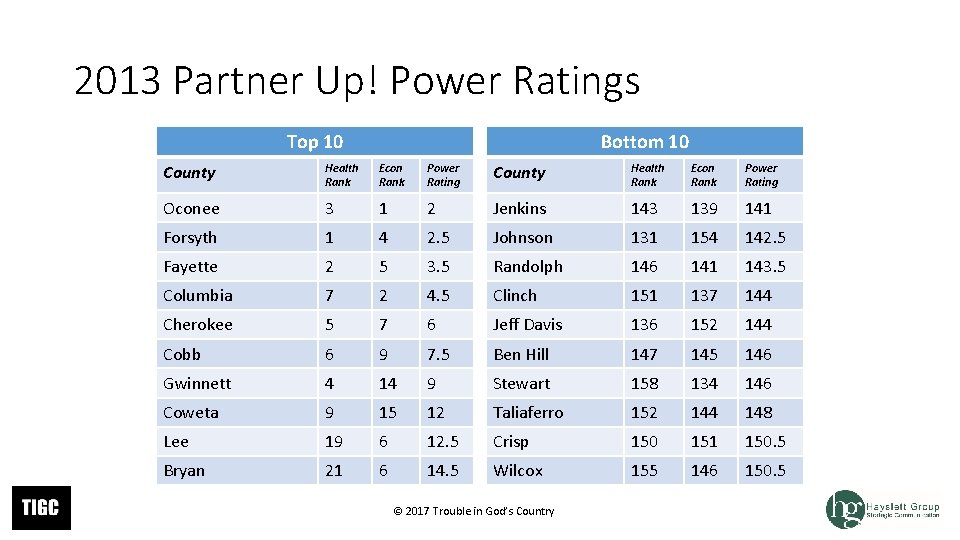
2013 Partner Up! Power Ratings Top 10 Bottom 10 County Health Rank Econ Rank Power Rating Oconee 3 1 2 Jenkins 143 139 141 Forsyth 1 4 2. 5 Johnson 131 154 142. 5 Fayette 2 5 3. 5 Randolph 146 141 143. 5 Columbia 7 2 4. 5 Clinch 151 137 144 Cherokee 5 7 6 Jeff Davis 136 152 144 Cobb 6 9 7. 5 Ben Hill 147 145 146 Gwinnett 4 14 9 Stewart 158 134 146 Coweta 9 15 12 Taliaferro 152 144 148 Lee 19 6 12. 5 Crisp 150 151 150. 5 Bryan 21 6 14. 5 Wilcox 155 146 150. 5 © 2017 Trouble in God’s Country
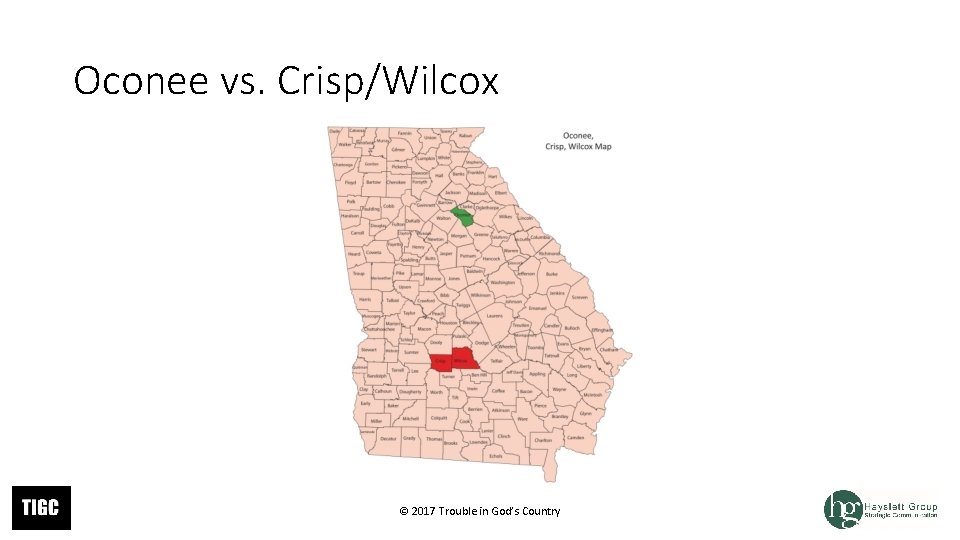
Oconee vs. Crisp/Wilcox © 2017 Trouble in God’s Country
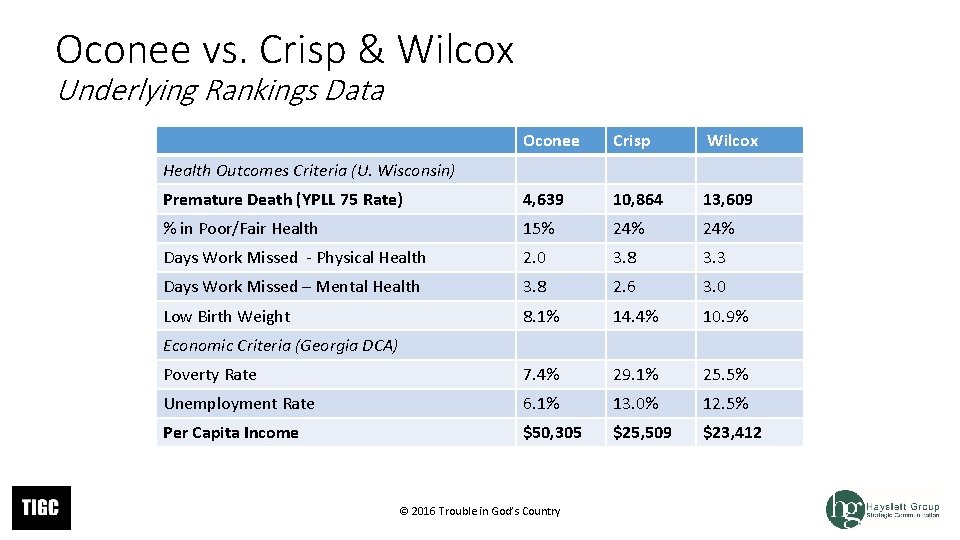
Oconee vs. Crisp & Wilcox Underlying Rankings Data Oconee Crisp Wilcox Premature Death (YPLL 75 Rate) 4, 639 10, 864 13, 609 % in Poor/Fair Health 15% 24% Days Work Missed - Physical Health 2. 0 3. 8 3. 3 Days Work Missed – Mental Health 3. 8 2. 6 3. 0 Low Birth Weight 8. 1% 14. 4% 10. 9% Poverty Rate 7. 4% 29. 1% 25. 5% Unemployment Rate 6. 1% 13. 0% 12. 5% Per Capita Income $50, 305 $25, 509 $23, 412 Health Outcomes Criteria (U. Wisconsin) Economic Criteria (Georgia DCA) © 2016 Trouble in God’s Country
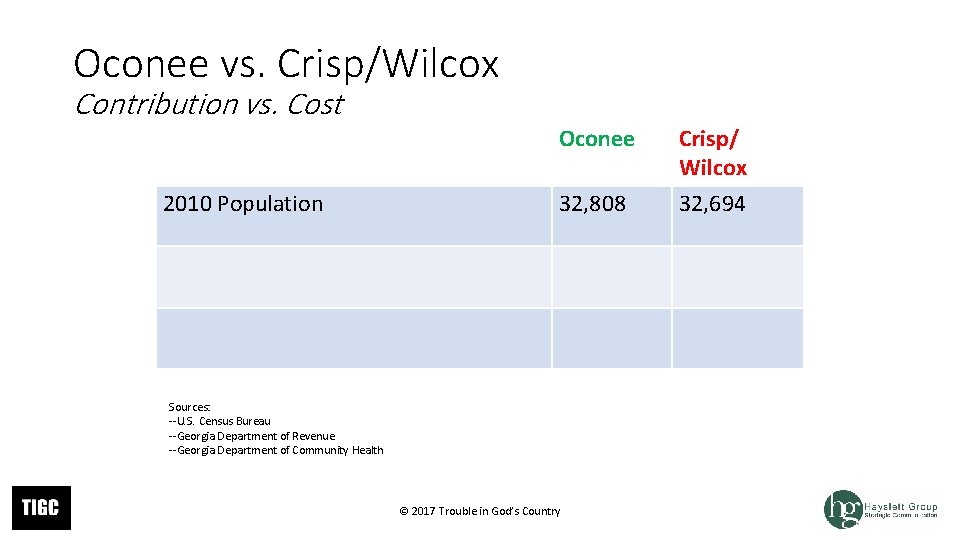
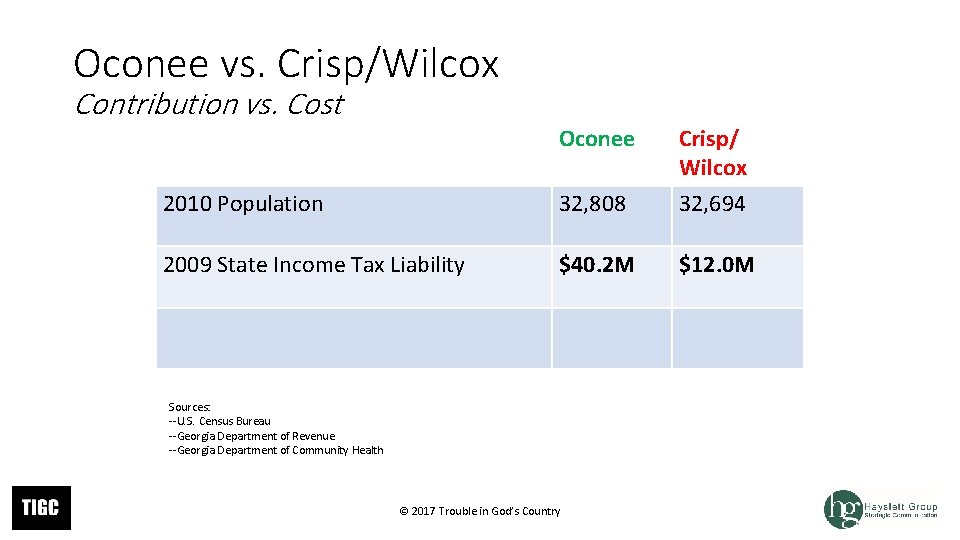
Oconee vs. Crisp/Wilcox Contribution vs. Cost ` Oconee 2010 Population 32, 808 Sources: --U. S. Census Bureau --Georgia Department of Revenue --Georgia Department of Community Health © 2017 Trouble in God’s Country Crisp/ Wilcox 32, 694
Oconee vs. Crisp/Wilcox Contribution vs. Cost ` Oconee 2010 Population 32, 808 Crisp/ Wilcox 32, 694 2009 State Income Tax Liability $40. 2 M $12. 0 M Sources: --U. S. Census Bureau --Georgia Department of Revenue --Georgia Department of Community Health © 2017 Trouble in God’s Country
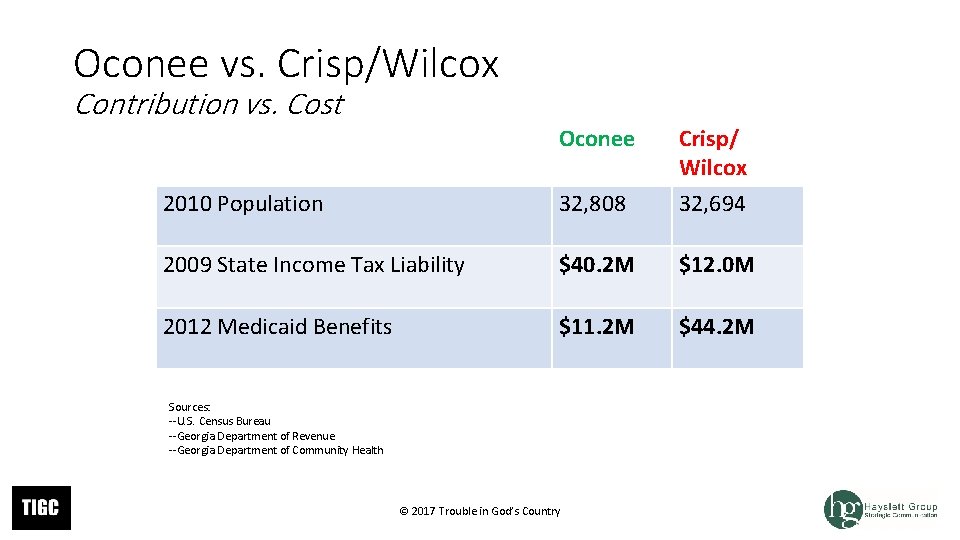
Oconee vs. Crisp/Wilcox Contribution vs. Cost ` Oconee 2010 Population 32, 808 Crisp/ Wilcox 32, 694 2009 State Income Tax Liability $40. 2 M $12. 0 M 2012 Medicaid Benefits $11. 2 M $44. 2 M Sources: --U. S. Census Bureau --Georgia Department of Revenue --Georgia Department of Community Health © 2017 Trouble in God’s Country
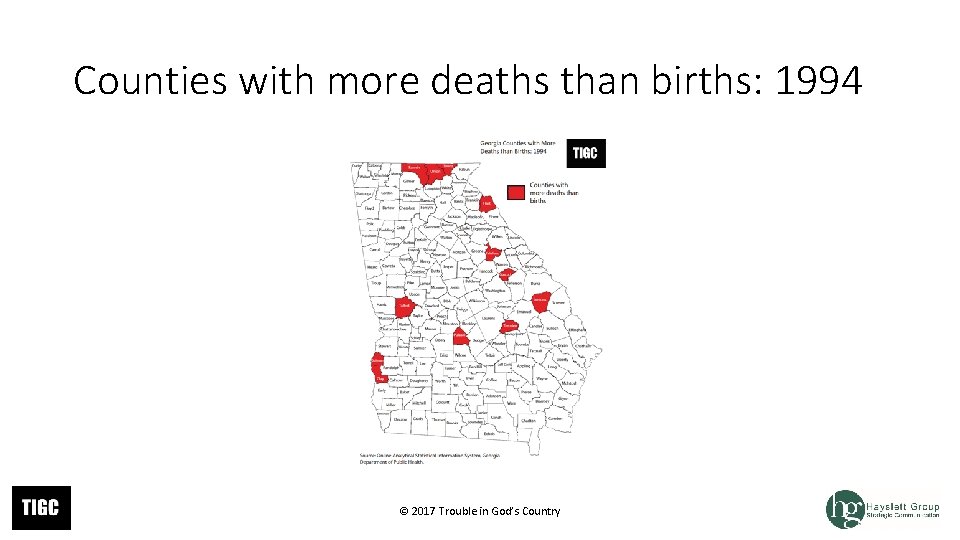
Counties with more deaths than births: 1994 © 2017 Trouble in God’s Country
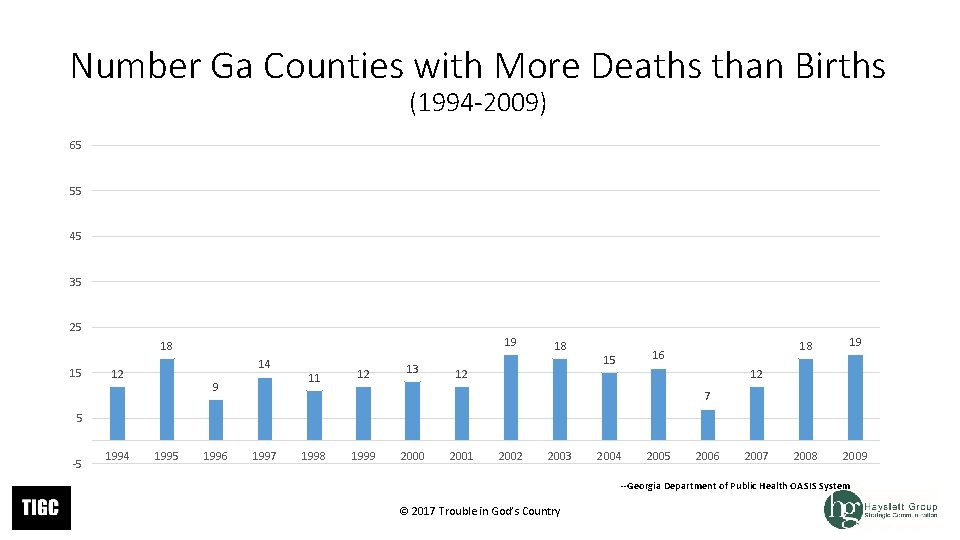
Number Ga Counties with More Deaths than Births (1994 -2009) 65 55 45 35 25 19 18 15 14 12 9 11 12 13 18 12 16 15 18 19 2008 2009 12 7 5 -5 1994 1995 1996 1997 1998 1999 2000 2001 2002 2003 2004 2005 2006 2007 --Georgia Department of Public Health OASIS System © 2017 Trouble in God’s Country
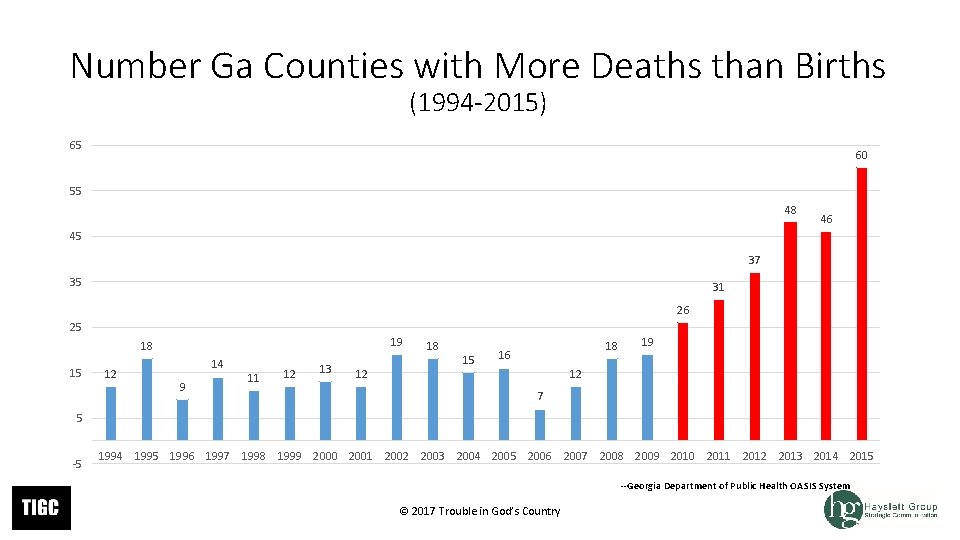
Number Ga Counties with More Deaths than Births (1994 -2015) 65 60 55 48 46 45 37 35 31 26 25 19 18 15 12 14 9 11 12 13 12 18 15 18 16 19 12 7 5 -5 1994 1995 1996 1997 1998 1999 2000 2001 2002 2003 2004 2005 2006 2007 2008 2009 2010 2011 2012 2013 2014 2015 --Georgia Department of Public Health OASIS System © 2017 Trouble in God’s Country
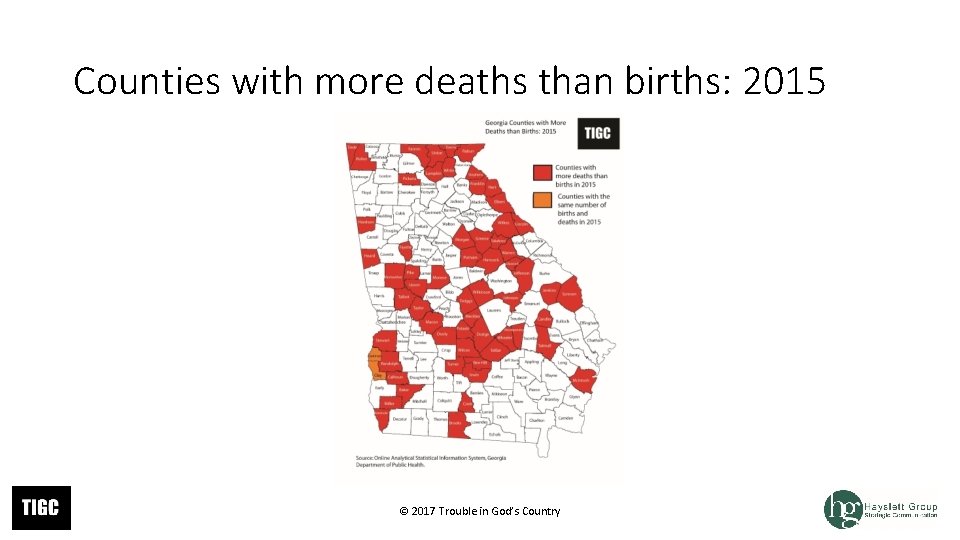
Counties with more deaths than births: 2015 © 2017 Trouble in God’s Country
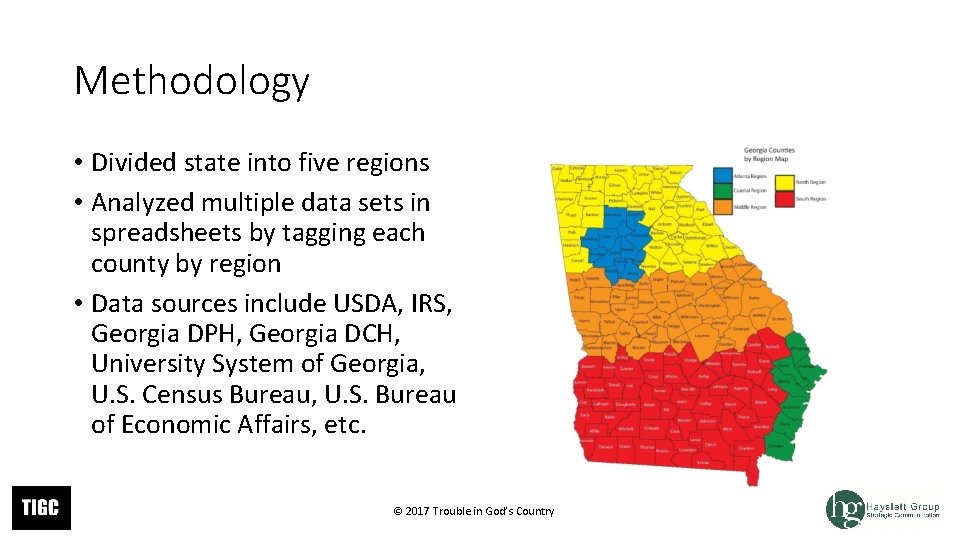
Methodology • Divided state into five regions • Analyzed multiple data sets in spreadsheets by tagging each county by region • Data sources include USDA, IRS, Georgia DPH, Georgia DCH, University System of Georgia, U. S. Census Bureau, U. S. Bureau of Economic Affairs, etc. © 2017 Trouble in God’s Country
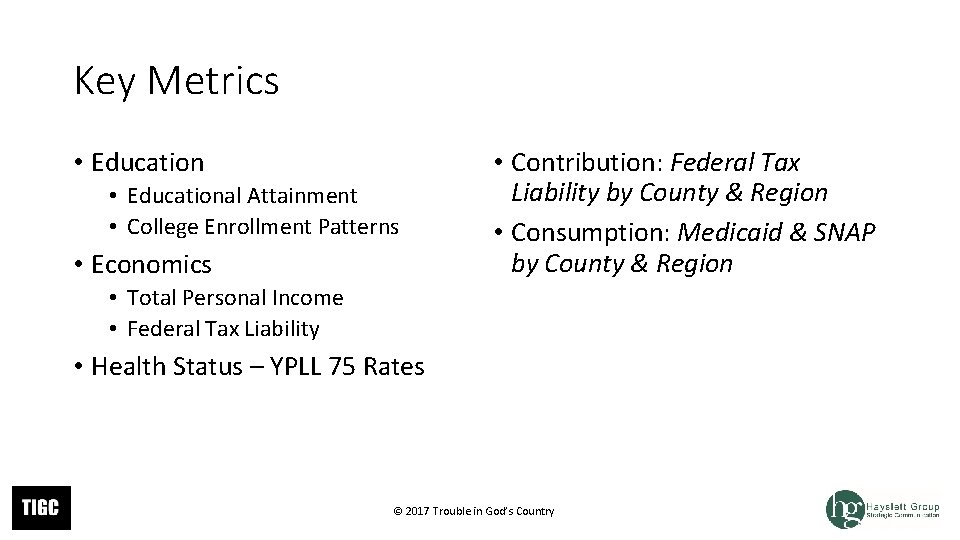
Key Metrics • Educational Attainment • College Enrollment Patterns • Economics • Contribution: Federal Tax Liability by County & Region • Consumption: Medicaid & SNAP by County & Region • Total Personal Income • Federal Tax Liability • Health Status – YPLL 75 Rates © 2017 Trouble in God’s Country
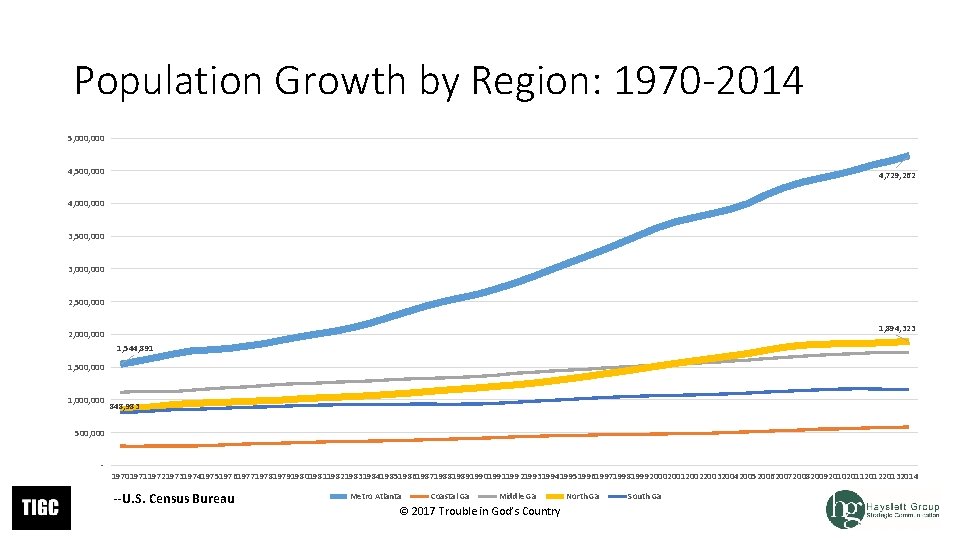
Population Growth by Region: 1970 -2014 5, 000 4, 500, 000 4, 729, 262 4, 000 3, 500, 000 3, 000 2, 500, 000 1, 894, 323 2, 000 1, 544, 891 1, 500, 000 1, 000 848, 983 500, 000 - 197019711972197319741975197619771978197919801981198219831984198519861987198819891990199119921993199419951996199719981999200020012002200320042005200620072008200920102011201220132014 --U. S. Census Bureau Metro Atlanta Coastal Ga Middle Ga © 2017 Trouble in God’s Country North Ga South Ga
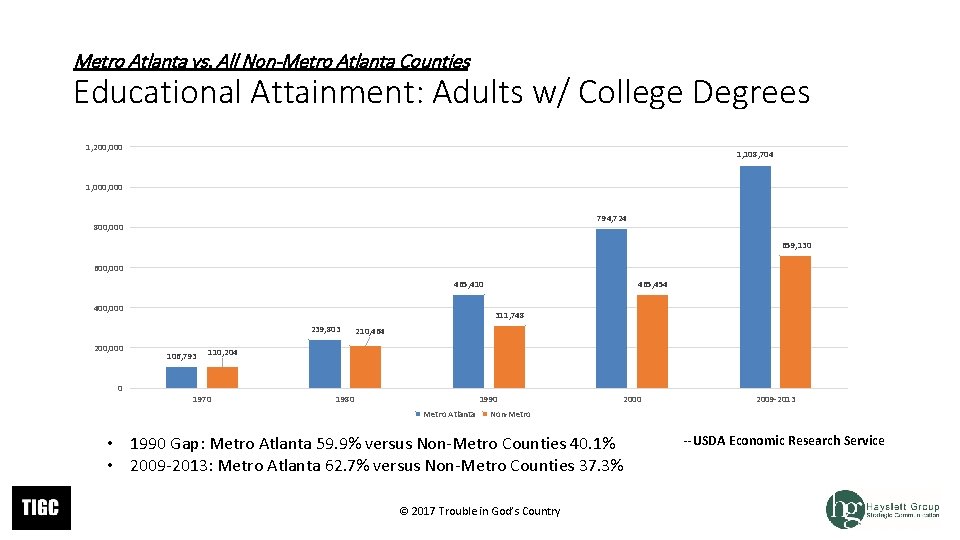
Metro Atlanta vs. All Non-Metro Atlanta Counties Educational Attainment: Adults w/ College Degrees 1, 200, 000 1, 108, 704 1, 000 794, 724 800, 000 659, 130 600, 000 465, 454 465, 410 400, 000 311, 748 239, 803 200, 000 0 106, 793 210, 464 110, 204 1970 1980 1990 Metro Atlanta 2000 2009 -2013 Non-Metro • 1990 Gap: Metro Atlanta 59. 9% versus Non-Metro Counties 40. 1% • 2009 -2013: Metro Atlanta 62. 7% versus Non-Metro Counties 37. 3% © 2017 Trouble in God’s Country --USDA Economic Research Service
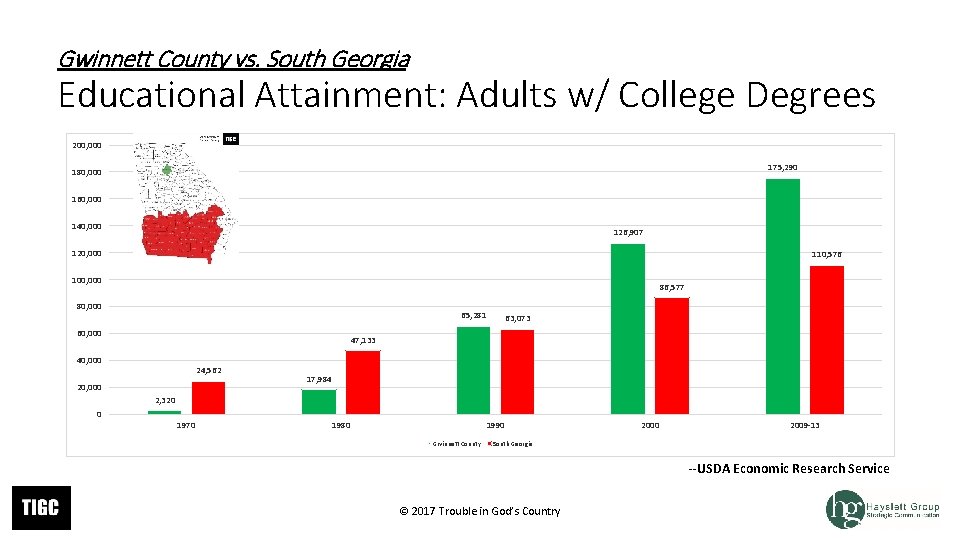
Gwinnett County vs. South Georgia Educational Attainment: Adults w/ College Degrees 200, 000 175, 290 180, 000 160, 000 140, 000 126, 907 120, 000 110, 576 100, 000 86, 577 80, 000 65, 281 60, 000 63, 073 47, 133 40, 000 24, 562 20, 000 17, 984 2, 320 0 1970 1980 1990 Gwinnett County 2000 2009 -13 South Georgia --USDA Economic Research Service © 2017 Trouble in God’s Country
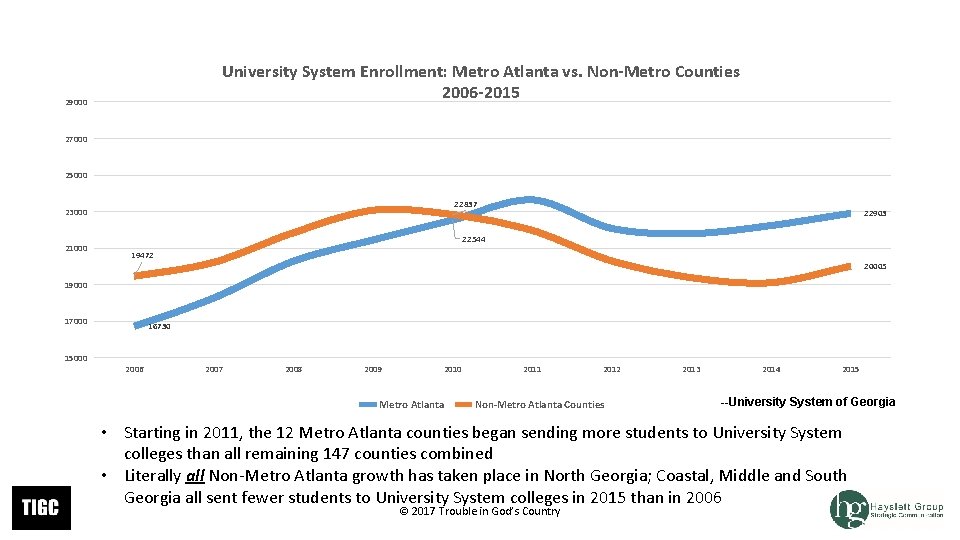
University System Enrollment: Metro Atlanta vs. Non-Metro Counties 2006 -2015 29000 27000 25000 22837 23000 21000 22903 22544 19472 20005 19000 17000 15000 16730 2006 2007 2008 2009 2010 Metro Atlanta 2011 2012 Non-Metro Atlanta Counties 2013 2014 2015 --University System of Georgia • Starting in 2011, the 12 Metro Atlanta counties began sending more students to University System colleges than all remaining 147 counties combined • Literally all Non-Metro Atlanta growth has taken place in North Georgia; Coastal, Middle and South Georgia all sent fewer students to University System colleges in 2015 than in 2006 © 2017 Trouble in God’s Country
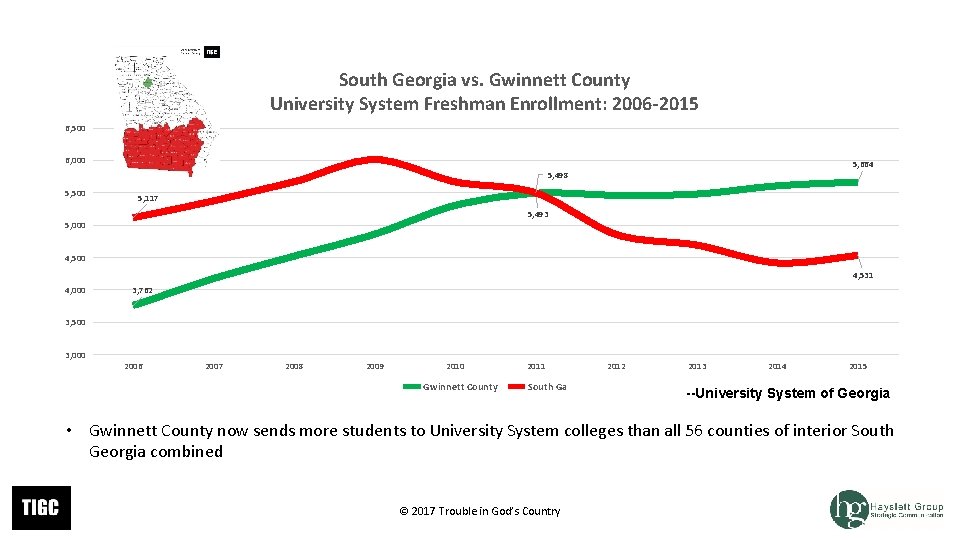
South Georgia vs. Gwinnett County University System Freshman Enrollment: 2006 -2015 6, 500 6, 000 5, 664 5, 498 5, 500 5, 117 5, 493 5, 000 4, 531 4, 000 3, 762 3, 500 3, 000 2006 2007 2008 2009 2010 Gwinnett County 2011 South Ga 2012 2013 2014 2015 --University System of Georgia • Gwinnett County now sends more students to University System colleges than all 56 counties of interior South Georgia combined © 2017 Trouble in God’s Country
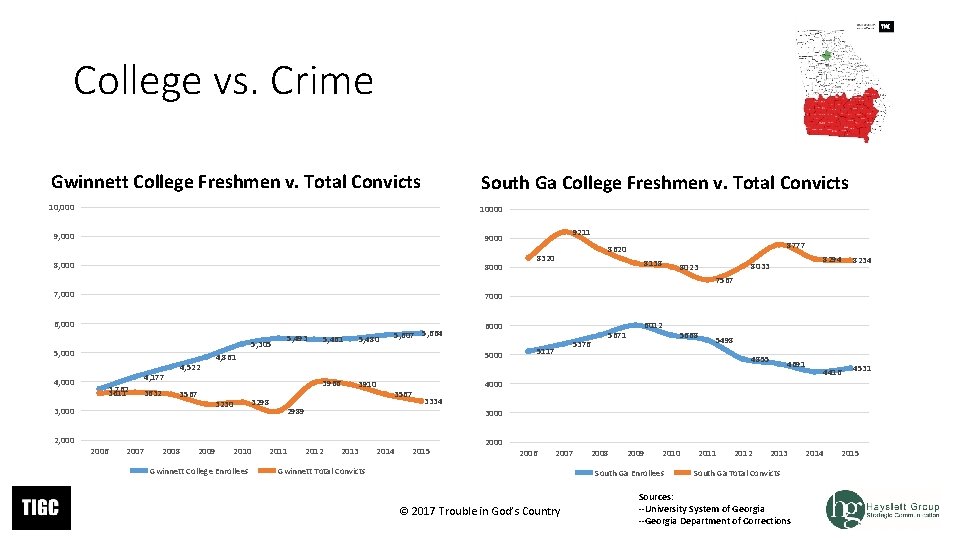
College vs. Crime Gwinnett College Freshmen v. Total Convicts South Ga College Freshmen v. Total Convicts 10, 000 10000 9, 000 9000 8, 000 8000 9211 8777 8620 8320 8138 8033 8023 8294 8234 4416 4531 7567 7, 000 7000 6, 000 5, 305 5, 000 4, 177 3, 762 3611 3632 4, 522 2006 2007 5, 461 2008 5, 480 5, 607 5, 664 3298 3230 2009 2010 Gwinnett College Enrollees 6000 5000 4, 861 3966 3567 3, 000 2, 000 5, 493 3910 3567 2989 2011 5376 5117 5671 6012 5668 5498 4855 4691 4000 3334 3000 2012 2013 2014 2015 2000 2006 2007 Gwinnett Total Convicts 2008 2009 2010 South Ga Enrollees © 2017 Trouble in God’s Country 2011 2012 2013 South Ga Total Convicts Sources: --University System of Georgia --Georgia Department of Corrections 2014 2015
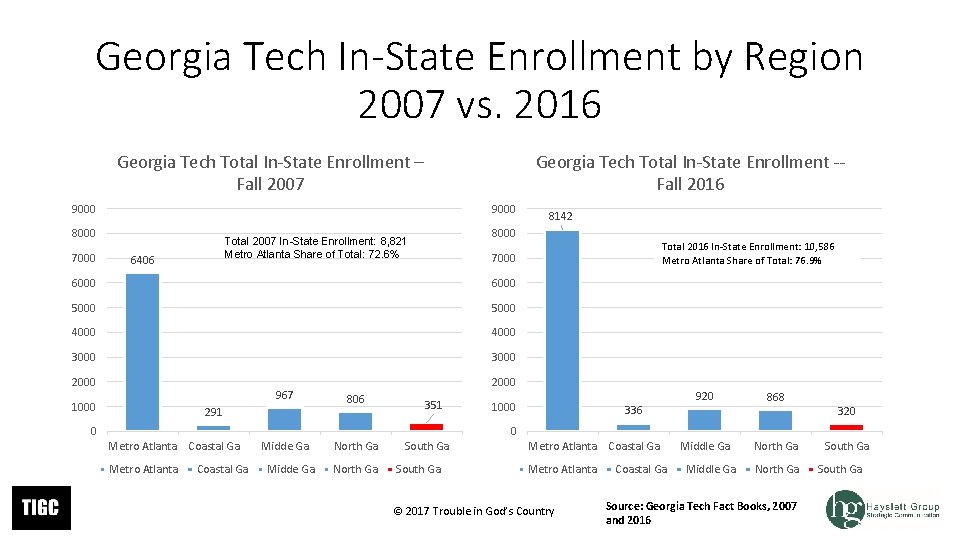
Georgia Tech In-State Enrollment by Region 2007 vs. 2016 Georgia Tech Total In-State Enrollment – Fall 2007 Georgia Tech Total In-State Enrollment -Fall 2016 9000 8000 7000 8000 Total 2007 In-State Enrollment: 8, 821 Metro Atlanta Share of Total: 72. 6% 6406 6000 5000 4000 3000 967 1000 291 Total 2016 In-State Enrollment: 10, 586 Metro Atlanta Share of Total: 76. 9% 7000 6000 2000 8142 2000 806 351 0 1000 336 920 868 320 0 Metro Atlanta Coastal Ga Midde Ga North Ga South Ga Metro Atlanta Coastal Ga Metro Atlanta © 2017 Trouble in God’s Country Coastal Ga Middle Ga North Ga Source: Georgia Tech Fact Books, 2007 and 2016 South Ga
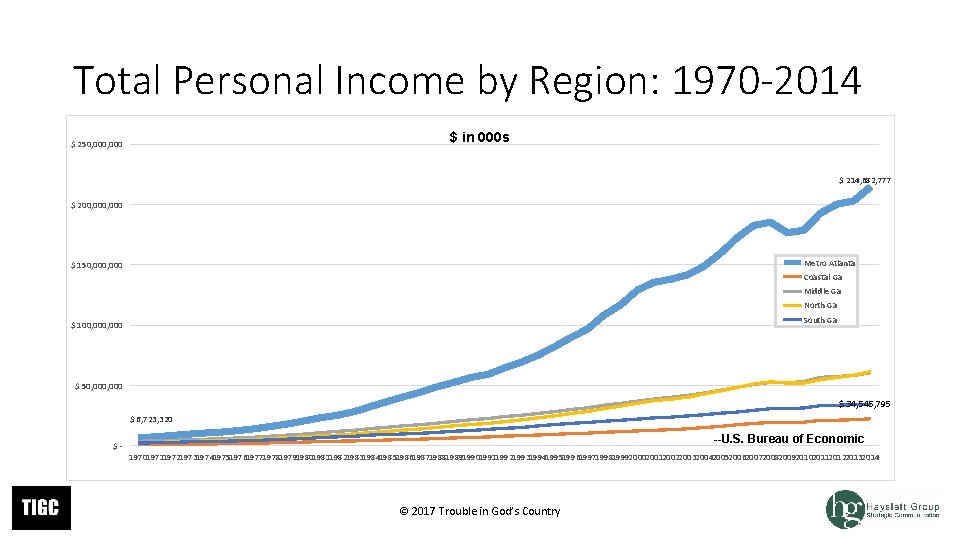
Total Personal Income by Region: 1970 -2014 $ in 000 s $ 250, 000 $ 214, 682, 777 $ 200, 000 Metro Atlanta $ 150, 000 Coastal Ga Middle Ga North Ga South Ga $ 100, 000 $ 50, 000 $ 34, 545, 795 $ 6, 723, 320 $- --U. S. Bureau of Economic 197019711972197319741975197619771978197919801981198219831984198519861987198819891990199119921993199419951996199719981999200020012002200320042005200620072008200920102011201220132014 © 2017 Trouble in God’s Country
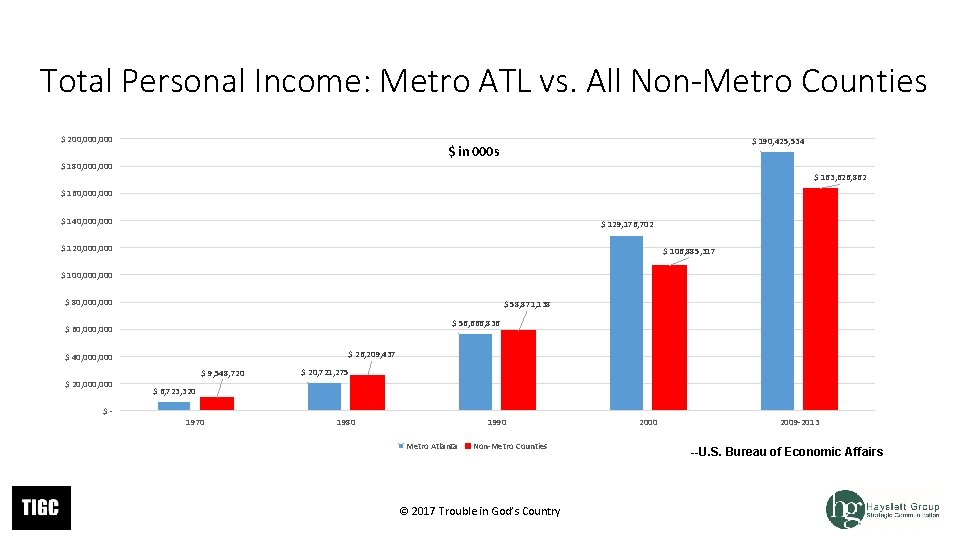
Total Personal Income: Metro ATL vs. All Non-Metro Counties $ 200, 000 $ 190, 425, 534 $ in 000 s $ 180, 000 $ 163, 626, 862 $ 160, 000 $ 140, 000 $ 129, 176, 702 $ 120, 000 $ 106, 885, 317 $ 100, 000 $ 80, 000 $ 58, 871, 138 $ 56, 666, 836 $ 60, 000 $ 26, 209, 437 $ 40, 000 $ 20, 000 $- $ 9, 548, 720 $ 20, 721, 275 $ 6, 723, 320 1970 1980 1990 Metro Atlanta Non-Metro Counties © 2017 Trouble in God’s Country 2000 2009 -2013 --U. S. Bureau of Economic Affairs
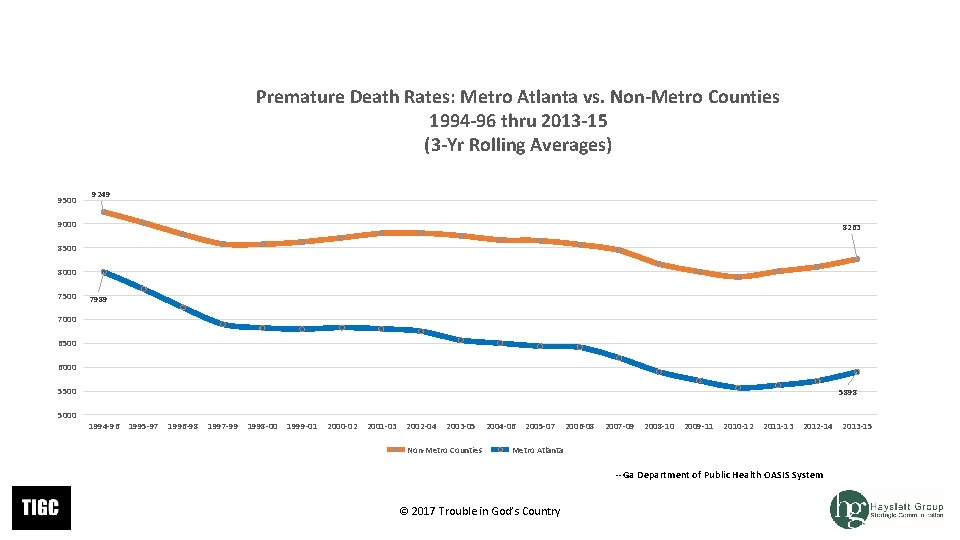
Premature Death Rates: Metro Atlanta vs. Non-Metro Counties 1994 -96 thru 2013 -15 (3 -Yr Rolling Averages) 9500 9249 9000 8263 8500 8000 7500 7989 7000 6500 6000 5500 5000 5898 1994 -96 1995 -97 1996 -98 1997 -99 1998 -00 1999 -01 2000 -02 2001 -03 2002 -04 2003 -05 Non-Metro Counties 2004 -06 2005 -07 2006 -08 2007 -09 2008 -10 2009 -11 2010 -12 2011 -13 2012 -14 Metro Atlanta --Ga Department of Public Health OASIS System © 2017 Trouble in God’s Country 2013 -15
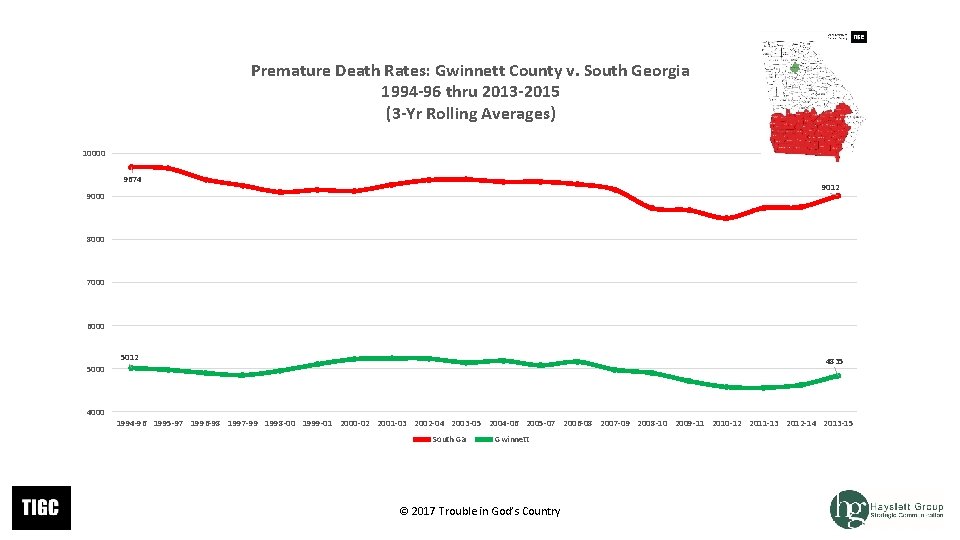
Premature Death Rates: Gwinnett County v. South Georgia 1994 -96 thru 2013 -2015 (3 -Yr Rolling Averages) 10000 9674 9012 9000 8000 7000 6000 5012 4835 5000 4000 1994 -96 1995 -97 1996 -98 1997 -99 1998 -00 1999 -01 2000 -02 2001 -03 2002 -04 2003 -05 2004 -06 2005 -07 2006 -08 2007 -09 2008 -10 2009 -11 2010 -12 2011 -13 2012 -14 2013 -15 South Ga Gwinnett © 2017 Trouble in God’s Country
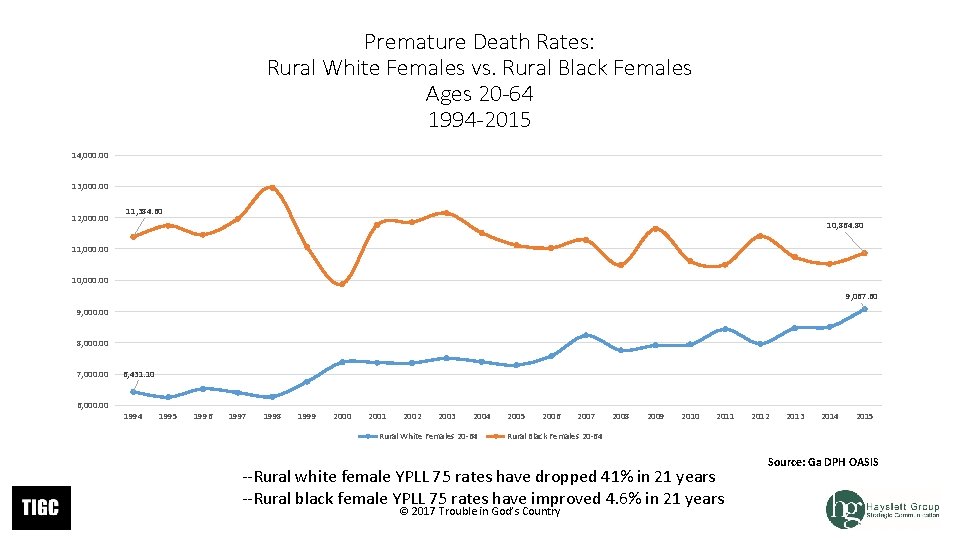
Premature Death Rates: Rural White Females vs. Rural Black Females Ages 20 -64 1994 -2015 14, 000. 00 13, 000. 00 12, 000. 00 11, 384. 60 10, 864. 80 11, 000. 00 10, 000. 00 9, 067. 60 9, 000. 00 8, 000. 00 7, 000. 00 6, 431. 10 1994 1995 1996 1997 1998 1999 2000 2001 2002 2003 2004 Rural White Females 20 -64 2005 2006 2007 2008 2009 2010 2011 2012 2013 2014 2015 Rural Black Females 20 -64 --Rural white female YPLL 75 rates have dropped 41% in 21 years --Rural black female YPLL 75 rates have improved 4. 6% in 21 years © 2017 Trouble in God’s Country Source: Ga DPH OASIS
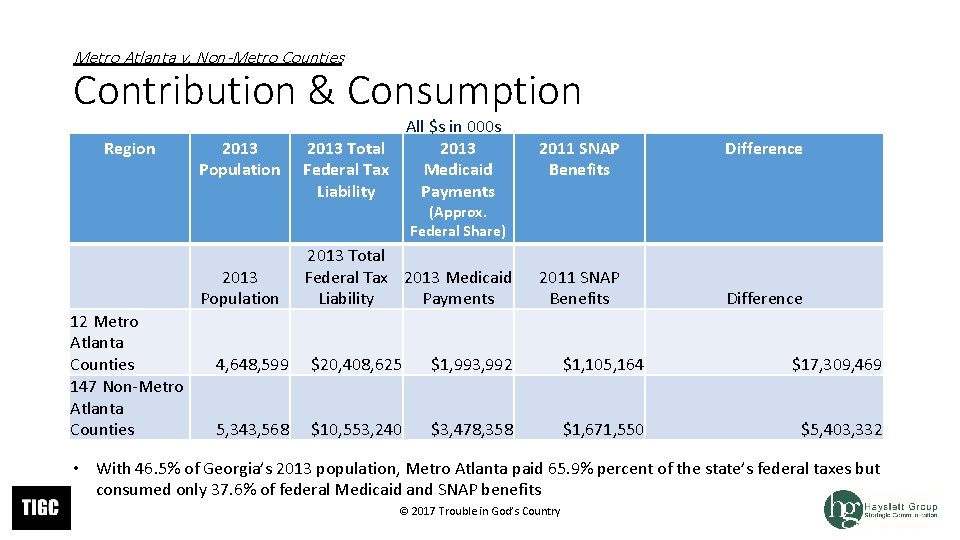
Metro Atlanta v. Non-Metro Counties Contribution & Consumption Region 2013 Population All $s in 000 s 2013 Total 2013 Federal Tax Medicaid Liability Payments 2011 SNAP Benefits Difference (Approx. Federal Share) 2013 Population 12 Metro Atlanta Counties 147 Non-Metro Atlanta Counties 2013 Total Federal Tax 2013 Medicaid Liability Payments 2011 SNAP Benefits Difference 4, 648, 599 $20, 408, 625 $1, 993, 992 $1, 105, 164 $17, 309, 469 5, 343, 568 $10, 553, 240 $3, 478, 358 $1, 671, 550 $5, 403, 332 • With 46. 5% of Georgia’s 2013 population, Metro Atlanta paid 65. 9% percent of the state’s federal taxes but consumed only 37. 6% of federal Medicaid and SNAP benefits © 2017 Trouble in God’s Country
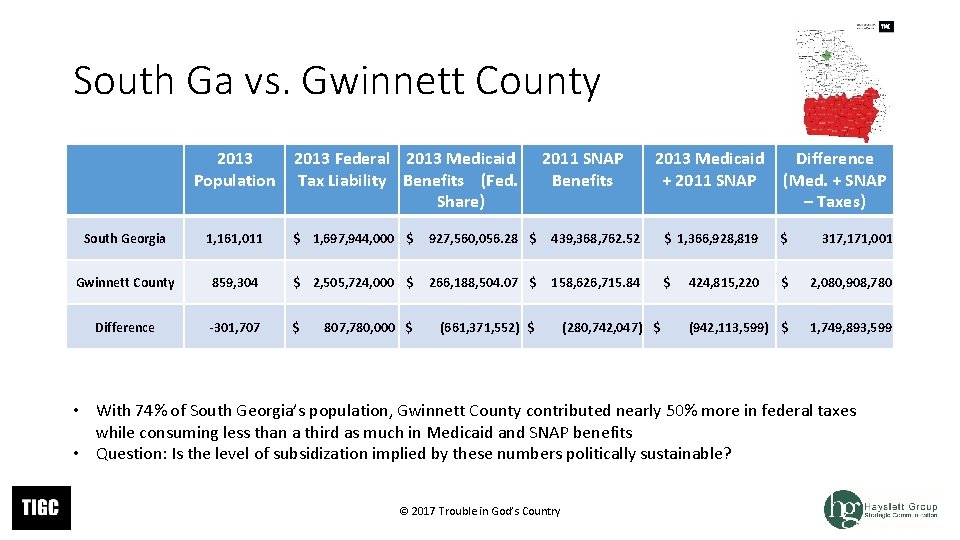
South Ga vs. Gwinnett County 2013 Population 2013 Federal 2013 Medicaid Tax Liability Benefits (Fed. Share) 2011 SNAP Benefits 2013 Medicaid + 2011 SNAP Difference (Med. + SNAP – Taxes) South Georgia 1, 161, 011 $ 1, 697, 944, 000 $ 927, 560, 056. 28 $ 439, 368, 762. 52 $ 1, 366, 928, 819 $ 317, 171, 001 Gwinnett County 859, 304 $ 2, 505, 724, 000 $ 266, 188, 504. 07 $ 158, 626, 715. 84 $ $ 2, 080, 908, 780 Difference -301, 707 $ (942, 113, 599) $ 1, 749, 893, 599 807, 780, 000 $ (661, 371, 552) $ (280, 742, 047) $ 424, 815, 220 • With 74% of South Georgia’s population, Gwinnett County contributed nearly 50% more in federal taxes while consuming less than a third as much in Medicaid and SNAP benefits • Question: Is the level of subsidization implied by these numbers politically sustainable? © 2017 Trouble in God’s Country
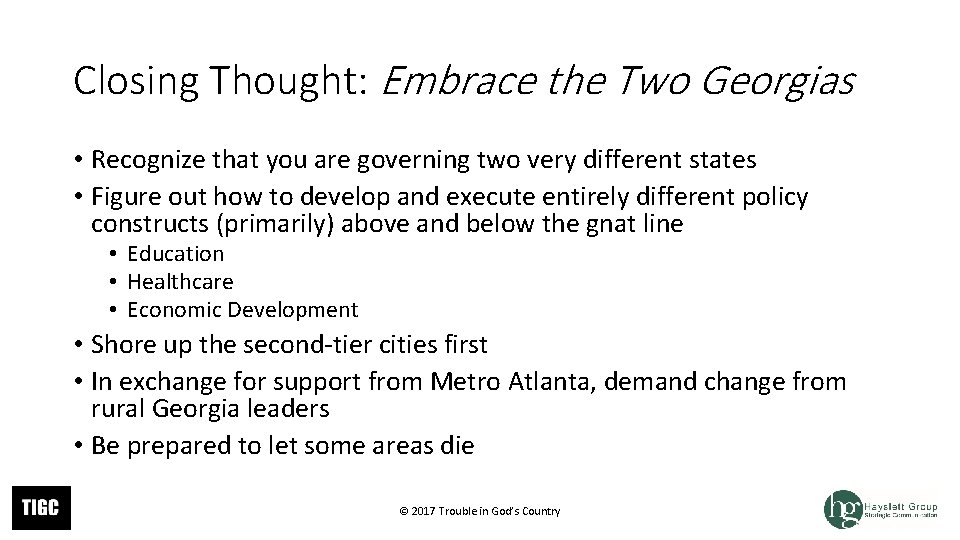
Closing Thought: Embrace the Two Georgias • Recognize that you are governing two very different states • Figure out how to develop and execute entirely different policy constructs (primarily) above and below the gnat line • Education • Healthcare • Economic Development • Shore up the second-tier cities first • In exchange for support from Metro Atlanta, demand change from rural Georgia leaders • Be prepared to let some areas die © 2017 Trouble in God’s Country
www. troubleingodscountry. com © 2017 Trouble in God’s Country