Population Development MDCMore Developed Country Developed Access to


 • Crude death rate (CDR)")


- Slides: 19
Population
Development • MDC-More Developed Country • “Developed” – Access to resources, water, money, jobs, technology, healthcare, transportation, education etc. • LDC- Less Developed Country • “Developing” – Lacks most of the above.
How is population measured? • Crude birth rate (CBR) • Crude death rate (CDR) • Natural increase rate (NIR)
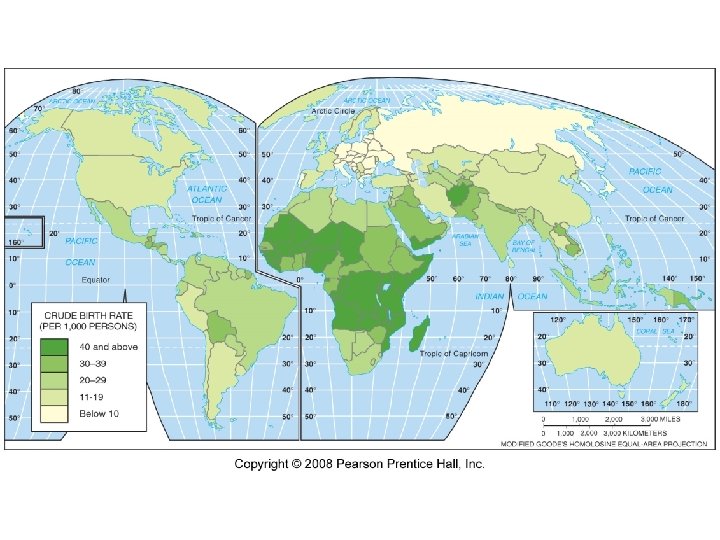
Crude Birth Rate • 1 birth for every 1, 000 people already living. • For example the United States CBR is 13 • 13 people are born for every 1, 000 that are currently living. • 13 X (321 million divided by 1, 000)= 4. 1 million babies are born each year
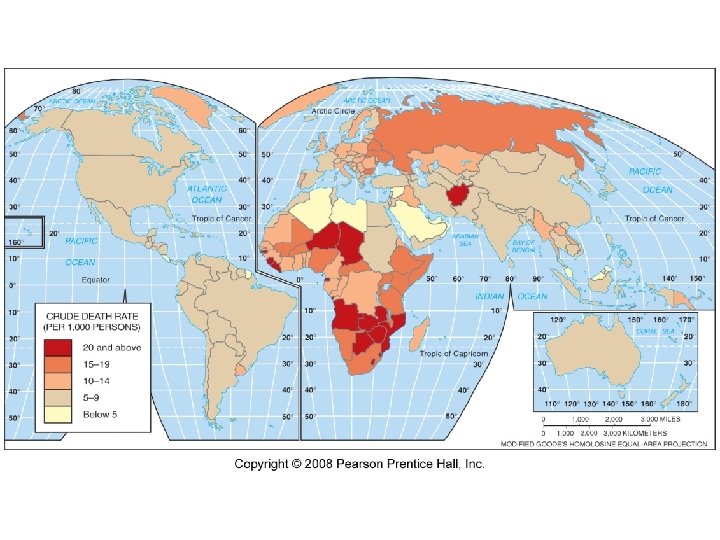
Crude Death Rate • The total number of deaths per year for every 1, 000 people still living. • For example the United States CDR is 8 • 8 people die for every 1, 000 that are still living. • 8 x (321 million people divided by 1, 000)= 2. 5 million people die each year • It is important to know that CDR is not as reflective, developmentally, as CBR is. • Some Developed countries can and do, have higher CDR’s than developing countries.
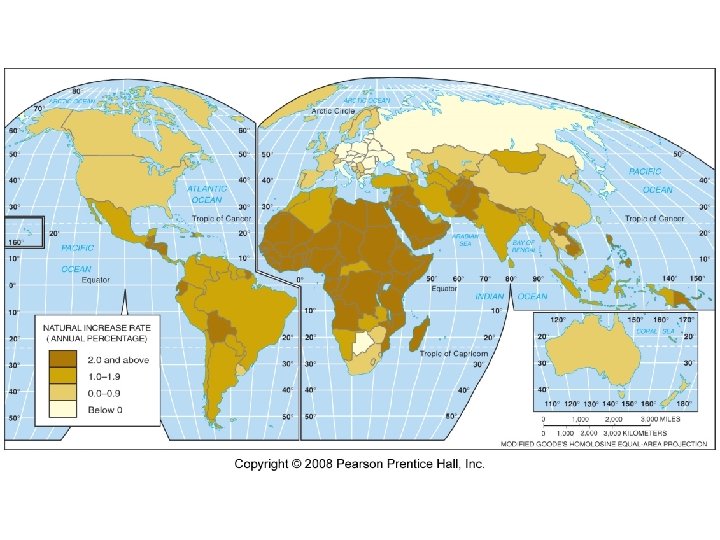
Natural Increase Rate • Percentage by which a population grows in a year. • Crude Birth Rate --- minus--- Crude Death Rate • 13 minus 8 = 5 • Growth is 5 per 1, 000 people • . 50% growth rate • Less than one percent population growth **does not include migration/immigration
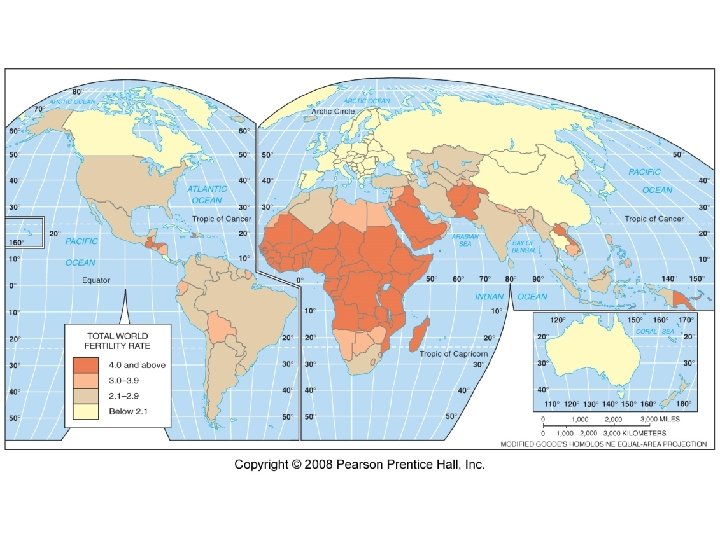
Total Fertility Rate • The number of children a woman will have**predicted to have** during her childbearing years (15 -49) • TFR for the world is 2. 5 • In European countries that number is 2 or less • In Saharan Africa that number is closer to 5 or more • This number is used to predict behavior of women, individually, where CBR is reflective of a society in a given year.
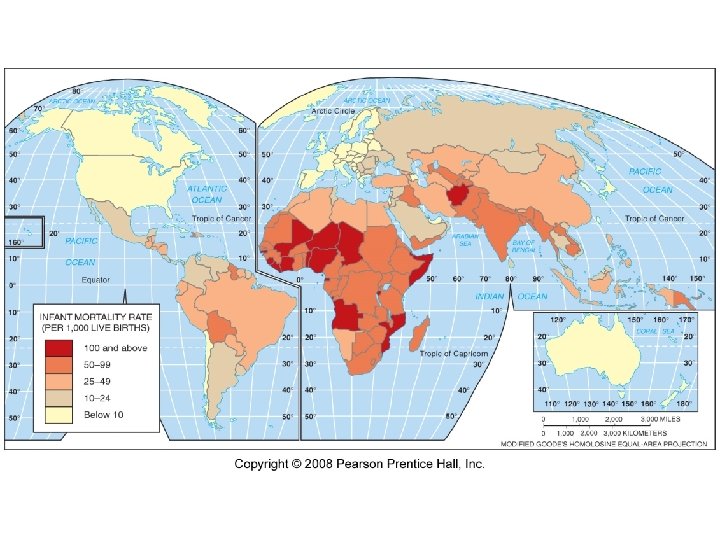
Infant Mortality Rate • The number of deaths per infant (under the age of 1) in a given year compared to surviving children. • IMR in Sub-Saharan Africa exceeds 60. More than 6% of infants born die before one. • IMR reflects a countries healthcare system. • US 6. **although minorities in the US have an IMR twice as high as the national average. This tends to be attributed to poverty and less access to prenatal and post natal care.
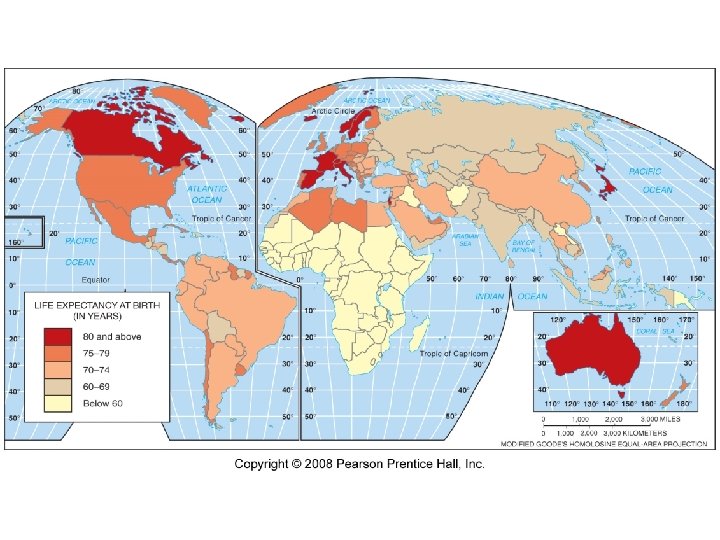
Life Expectancy • Average number of years an infant can expect to live at current mortality rates. • Sub-Saharan Africa in their 40’s. • US 75 -79 years old.
Age is but a number • 33% of the population in developing countries are under the age of 15 • 16% of population in developed countries are under the age of 15 • Children are expensive. A country with a large population of children must allocate their resources to day-care, health care, schools, etc. • Additionally, as they age they will need a government that has a growing job market but is difficult to do when funds are going to the children. • However, in countries with low percentages of children, we see increase job demand programs to be paid without a viable work force to pay for them.
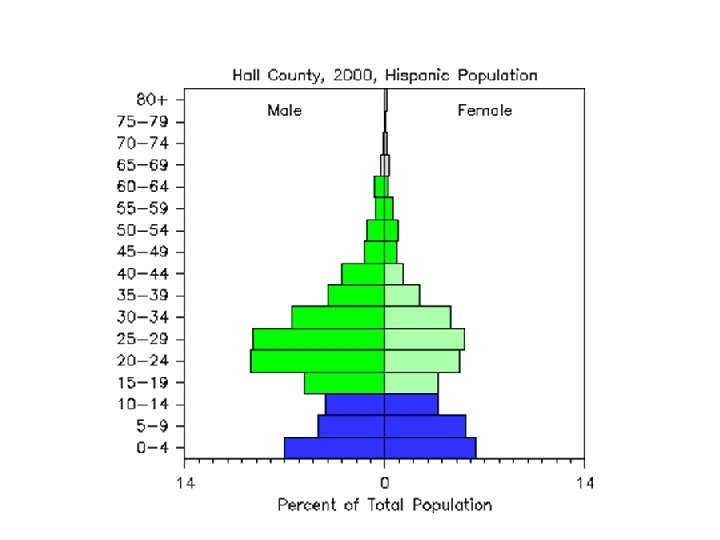
How do we see it? Population Pyramids • A way to display a countries age and gender through a bar graph. – Percentage of the population in each age group and distribution of males/females. • % • Age • Male or Female