Pipelines workflows and pitfalls Ayal Gussow 12062018 1


 Use sense. 2) Use your domain knowledge. 3) Probe")


 Is there a furry creature in the picture? 2)")


 -")


 You’re")


 Project documentation. Each")


- Slides: 49
Pipelines, workflows, and pitfalls Ayal Gussow 12/06/2018 1
Outline � Pipeline � Practical tips � Previous projects � Independent work 2
SKLearn Pipeline You want to fit and optimize the process. Example 3
Practical Advice 4
Most common ML questions Should I use feature X? Do I need to normalize the data? How should I preprocess the data? Which model should I use? How should I assess my results? (metric and threshold) Do I have enough data? 5
Most common ML questions Though we can provide tools to find the answer to some of these questions, the answer generally depends on the problem. There really is no one-size-fits-all. 6
Example: 2016 presidential predictions You want to predict presidential election outcome. How would you do it? 7
Example: 2016 presidential predictions You want to predict presidential election outcome. Data choices: polling data, economic data, demographics Model choices: Directly predict the outcome, predict each state and summarize into outcome, probabilistic simulations, etc 8
Example: 2016 presidential predictions You want to predict presidential election outcome. 538 prediction: 80% Dem win Others: 99% Dem win 1) Undecided voters. Ignored vs add to uncertainty. 2) Polling errors. Independent vs correlated. 9
Example: 2016 presidential predictions You want to predict presidential election outcome. Michigan Pennsylvania North Carolina 10
Example: 2016 presidential predictions You want to predict presidential election outcome. Michigan Pennsylvania North Carolina What are the chances that there is an error in all three states? 11
Example: 2016 presidential predictions You want to predict presidential election outcome. Michigan Pennsylvania North Carolina If one is off, the others probably are too, in the same direction… 12
Example: 2016 presidential predictions You want to predict presidential election outcome. 538 prediction: 80% Dem win Others: 99% Dem win 1) Undecided voters. Ignored vs add to uncertainty. 2) Polling errors. Independent vs correlated. 13
Example: 2016 presidential predictions You want to predict presidential election outcomes, using a combination of polling and economic data. 538 prediction: 80% Clinton win Others: 99% Clinton win https: //53 eig. ht/2 Iokw. Gv 14
When Building A Model 1) Use sense. 2) Use your domain knowledge. 3) Probe the model, see if you can understand it and if it makes sense. It’s not a black box. 15
Generic Workflow 16
Workflow Framework 1. Data acquisition / loading 2. Feature creation 3. Feature normalization 4. Feature selection 5. Machine learning model 6. Combining multiple models 7. Reporting / Utilization 17
Data acquisition / loading If we are fortunate our data may already be in a usable format but more often extensive work is needed to generate something usable. � What type of data do we have? � Do we need to combine data from multiple sources? � Is our data structured in such a way it can be used directly? � Does our data need to be cleaned? � Does our data have issues with confounding? 18
Feature creation � Can our data be used directly? � What features have been used previously for similar tasks? 19
Feature normalization � Does our method require normalization? � What do we gain and what do we lose in normalizing? � Outliers? � Z-score normalization? � Min-max normalization? 20
Feature selection General Rule: The number of features we have compared with our sample size will determine whether feature selection is needed. We may choose in the first instance not to use feature selection. Observe performance on the validation dataset (learning curves, cross-validation) to detect overfitting and perhaps use fewer features. 21
Feature selection philosophies: balance expertise with feature selection methods. Note that less data makes feature selection harder. 22
Machine learning model Which algorithm to use will depend on the type of task and the size of the dataset. As with the preceding steps it can be difficult to predict the optimal approach. 23
Combining multiple models An additional step that can frequently boost performance is combining multiple different models. It is important to consider that although there advantages combining different models can make the result more difficult to interpret. The models may be generated by using a different algorithm and/or different features. Example: Cat or not cat? 24
Combining multiple models An additional step that can frequently boost performance is combining multiple different models. It is important to consider that although there advantages combining different models can make the result more difficult to interpret. The models may be generated by using a different algorithm and/or different features. Example: Cat! Cat or not cat? Not cat! 25
Combining multiple models An additional step that can frequently boost performance is combining multiple different models. It is important to consider that although there advantages combining different models can make the result more difficult to interpret. The models may be generated by using a different algorithm and/or different features. Example: Cat or not cat? Cat! 26
Combining multiple models Two-step: 1) Is there a furry creature in the picture? 2) Is it a cat? 27
Reporting / Utilization Finally we need to be able to utilize the model we have generated. This typically takes the form of receiving a new sample and then performing all the steps used in training to make a prediction. If we are generating a model only to understand the structure of the data we already have then the new samples may be the test dataset we set aside at the beginning. Trusting vs understanding the predictions. 28
Experimentation, diagnosis and overfitting 29
Overfitting vs Experimentation Generally, it’s desirable to try different approaches. Try to be mindful of why you are trying different approaches, and don’t just try every possible approach until you find one that is mildly better than others. Other “approaches”: Removing outliers, changing evaluation metric (FDA), and so forth. 30
Diagnosing the issue Listen to the data. Use learning curves to determine whether you need a better model or more data. Delve into the model and the data. What’s working? What isn’t? Why isn’t it working? Which samples are being misclassified? Why? Does it make sense? 31
Tracking and Optimization Some advanced tools: - Git (https: //bit. ly/QC 6 KDB) - Sacred (https: //bit. ly/2 KYjs. KB) - Snakemake (https: //bit. ly/2 QBLn. Fu) 32
Common Pitfalls 33
Training / test set contamination E. g. identical sequences from closely related species. 34
Poorly chosen negative set You may not be predicting what you think you are. 35
Biased Data You may not be predicting what you think you are. 36
Biased Data You may not be predicting what you think you are. 1) You’re head of a university department and you are accused of bias in graduate student acceptance. 2) To get around this, you decide to have a “neutral” arbitrator – a neutral algorithm that decides which students are accepted. It attempts to predict which students are most likely to become “successful” scientists, based on existing “successful” scientists. 3) You find that your algorithm has the same biases you do. 37
Biased Data You may not be predicting what you think you are. Don’t take results at face value. . . …but listen to the data. 38
Treating measures as absolute An AUC of 0. 97! If it’s way too good to be true, it’s probably not. (permutation tests, predicting all as one class) 39
Complex before simple Sometimes ML isn’t needed, or a simpler ML will suffice. Always start small – subset, simulated, etc. Then expand. Pay attention to the model and the data before choosing your next step. AI, ML, Deep Learning, etc – buzzwords. 40
Final Project 41
Project 1. Your grade is not dependent on success. 2. Make sure it is clear. 42
Project The final project will consist of the following components: 1) Project documentation. Each project should have documentation clarifying its goal and functionality. The code itself should be well-documented, with comments spread out to aid understanding. Functions and classes should have docstrings describing their functionality, inputs and outputs. 2) Project code. The code should be well-organized and easy to read. It should also be written modularly, so that each part of code is reusable. The code should run and produce the correct output under different conditions. It should also have robust error checking. 3) Project presentation. Each student will present their project at the end of the semester. The idea here is to present the project’s goals, input, and output, preferably while showing snippets of code. Project grades will be determined based on the components outlined above, with each component representing 33% of the project grade. 43
NHL Playoffs - Classification Problem Series Games 0 0 1 4 2 8 3 12 4 16
Data � Seasons: 1989 -2017 � 1994, 2004, 2012 were lockout years � 16 teams/year � 385 data points � 26 features � Tested on 2015 playoffs � Data was scaled with Standard. Scaler() https: //www. hockey-reference. com/
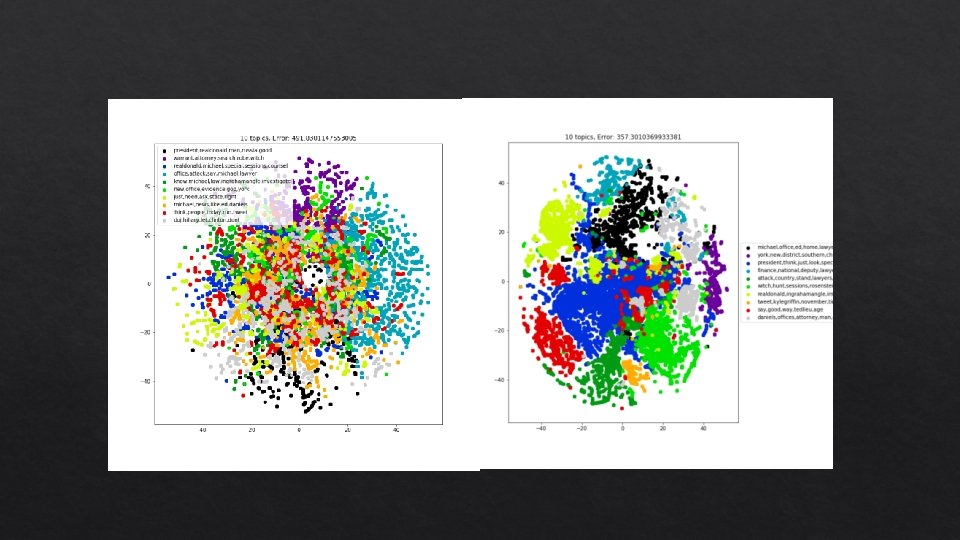
https: //github. com/tweepy cohen, fbi, raid, stormy, raid, mueller, corruption, nda 147000 tweets
Word Co-ocurrences
Using a premade dataset and challenge 49