Recent fertilizer price trends are not a pretty


 Fertilizer is a")


 July – December 2006 42% 56% Majority")

 Material MAP 11 -52 -0 DAP 18 -46 -0 10")


- Slides: 97
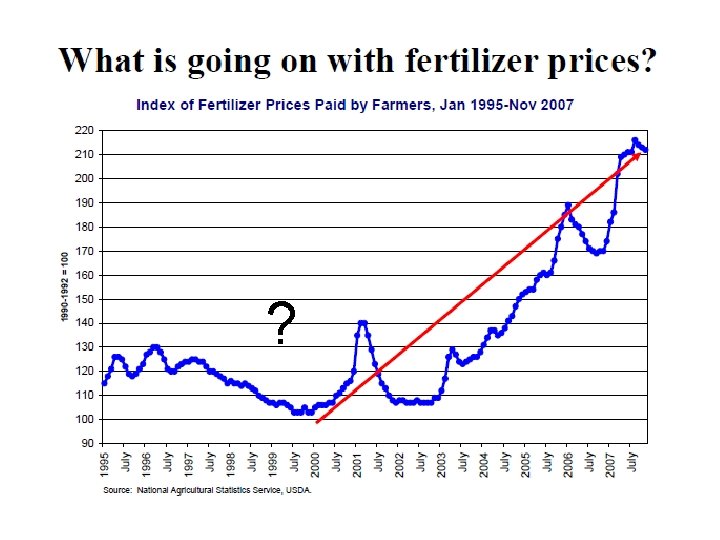
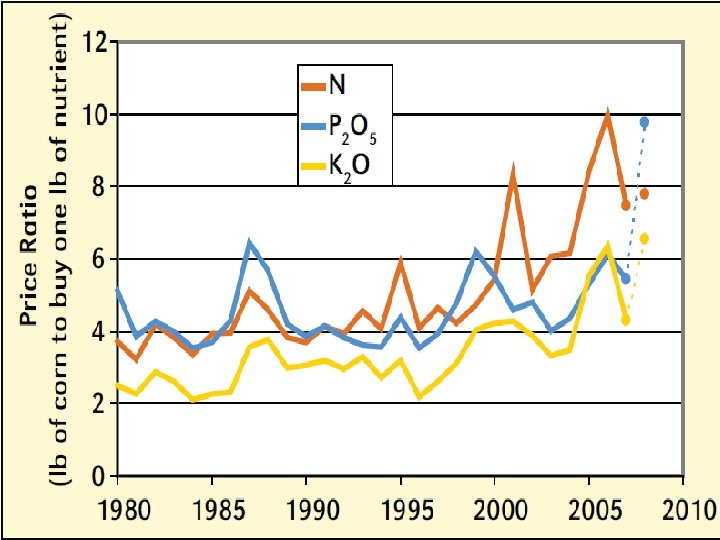
Recent fertilizer price trends are not a pretty picture
The good old days… $ per ton of material * Anhydrous ammonia Nitrogen solutions Urea Ammonium Nitrate Ammonium Sulfate Diammonium phosphate Concentrated superphosphate Potassium chloride 2001 2002 2003 2004 2005 399 189 280 260 192 250 127 191 195 187 373 161 243 195 379 178 276 263 205 416 215 332 292 244 227 250 276 303 236 170 221 164 243 165 266 181 299 245
Why have fertilizer prices gone up so much ? ? 1) Fertilizer is a world commodity and global demand for nitrogen, phosphate, and potash increased 14, 13, and 19 % respectively from 2001 to 2006 (mostly increased demand from China, India, and Brazil). U. S. corn acres increased from 78. 3 million in 2006 to 93. 6 million in 2007 largely because of ethanol production. More corn acres = more fertilizer 2) Fertilizer industry infrastructure was not prepared for this surge in demand 3) All transportation costs have increased. 4) A weak U. S. dollar increased the cost of all imported goods. The U. S. imports ~ 60% of its nitrogen and over 90% of its potash. 5) High natural gas prices have driven up the cost of producing ammonia, which results in higher prices for all nitrogen and ammoniated phosphate fertilizer materials. 6) Major fertilizer companies have posted record profits.
The global potash market became very tight in 2007, due to stronger than anticipated demand for potassium fertilizers and logistical constraints in a few exporting countries. > 80 per cent of mined K is exported ! Importers’ potash stocks were at very low levels. Most producers operated at close to capacity. Total global potash production in 2007 was 55. 4 Mt MOP eq. , increasing by 14 per cent over 2006. Potash exports in 2007 totaled 45. 2 Mt MOP eq. , representing an 18 per cent increase over 2006.
P fertilizer production is also geographically concentrated Phosphate ore reserves have been identified in 32 countries worldwide, but economic extraction is more limited. The top three producing countries account for 63 % of world P production while the top 12 account for 93%. The US exports ~ 60 percent of its annual phosphate production.
How is this possible? Nitrogen fertilizer is currently produced in over 80 countries worldwide. Only 25% is traded internationally All countries have access to N 2, the dominant gas in the earth’s atmosphere. Energy is the limiting factor.
Top five fertilizer consumers China India United States Brazil Pakistan Top five fertilizer producers China United States Russia Canada India
Top five fertilizer importers United States China Brazil India France Top five fertilizer exporters Russia Canada United States Belarus Germany
China’s high export tax on fertilizers, which ranges from 100 to 135 percent, is designed to keep fertilizer in the country for domestic use More than one-half of the fertilizer used in China is used to grow fruits and vegetables
US fertilizer production and consumption • Top five fertilizer-consuming states: Illinois, Iowa, Ohio, Texas, Indiana. • The fertilizer manufacturing industry is responsible for approximately 33, 000 jobs in the United States. • Fertilizer production facilities are located in 34 states. • The U. S. nitrogen fertilizer industry operates production plants in 27 states, the phosphate fertilizer industry operates production plants in 12 states and potash is mined in Michigan, New Mexico and Utah.
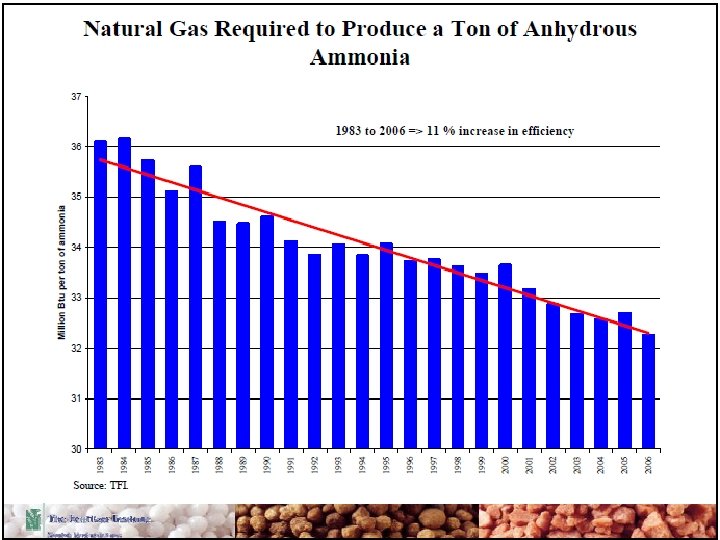
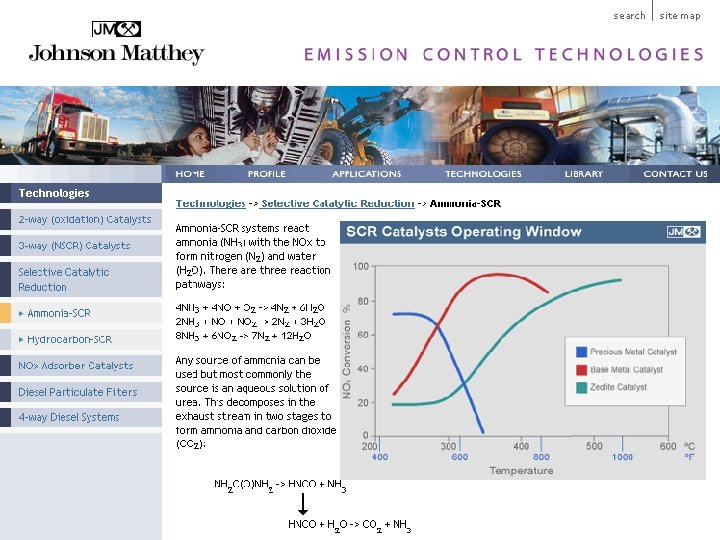
~ 80 % of the cost of producing NH 3
New Fertilizer Rules October 2008 Farm Journal In this article Ken Ferrie suggests that the “real cost” of fertilizer can be easily understood by calculating the replacement cost of the N, P and K in harvested crops and then expressing this cost in terms of bushels of yield. For example, 5 years ago, when the price of corn was ~ $2/bushel the cost of replacing the nutrients in 180 bushels of corn was ~ $50. Calculating fertilizer cost $50/acre / $2/bushel = 25 bushels/acre This ratio held relatively constant for over a decade - whether corn sold for $2. 38 a bushel or $4. 75.
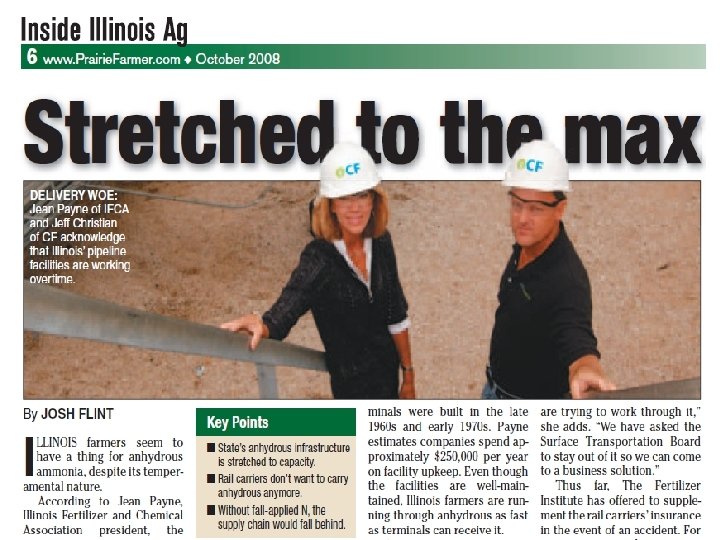
Main concepts in the article 12 anhydrous terminals in Illinois Most are supplied by barge or pipeline Only one terminal is supplied by rail The pipeline is currently at capacity Terminals were built in the late 60 s and early 70 s. Rail carriers have petitioned for indemnification Retailers have expressed interest in receiving NH 3 directly by rail Fall applications are necessary
Ammonia pipelines in the US The pipelines are 8 -10 inch diameter, constructed of plain carbon steel, with a total length of approximately 3000 miles.
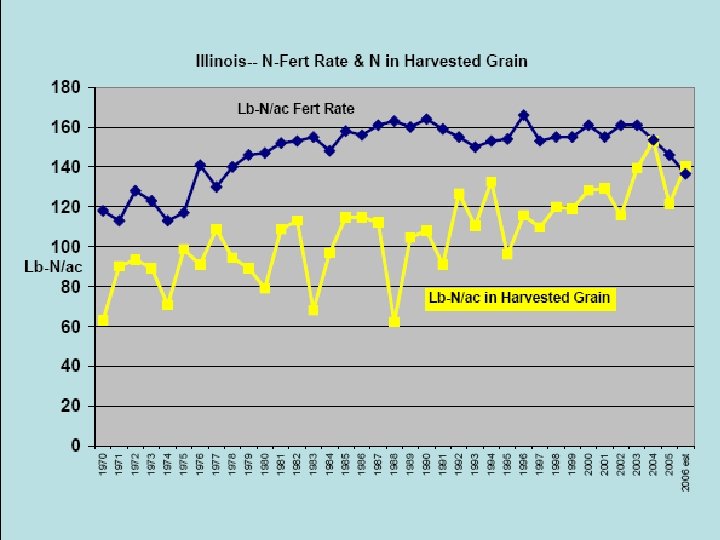
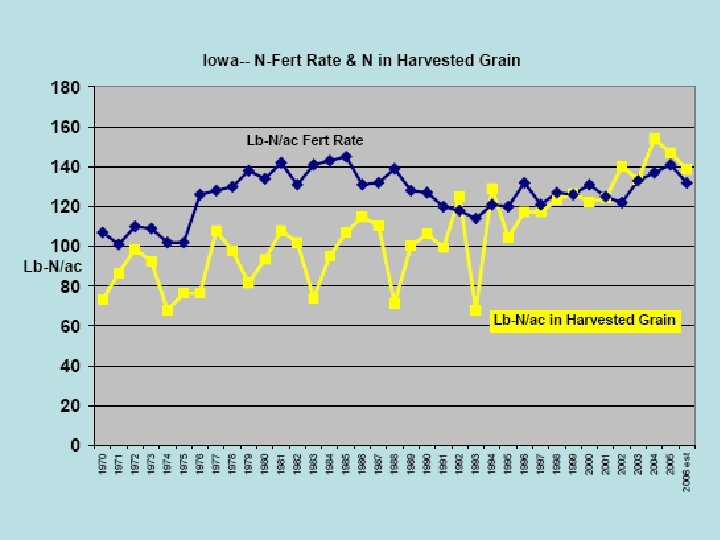
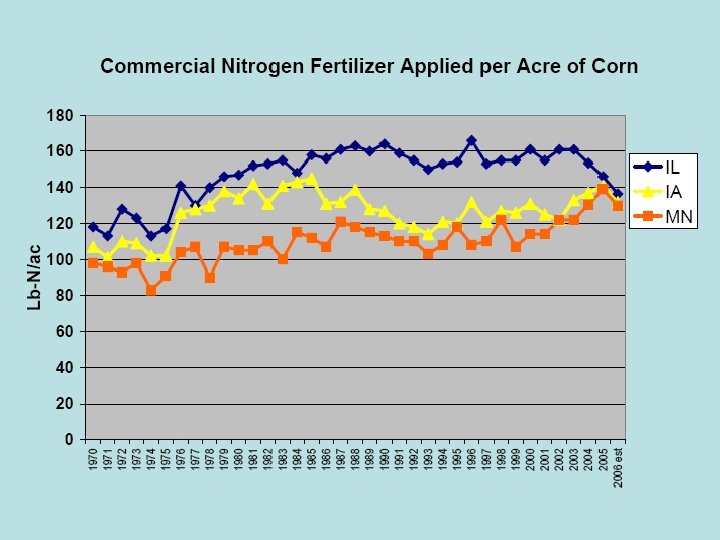
Relationship between annual N fertilization and N removal in corn grain for 12 states in the USA Corn Belt (1994 -2001 averages). State Fertilizer N Grain N Excess N Illinois 768. 6 569. 1 199. 5 (35) Iowa 671. 7 641. 8 29. 9 (5) Nebraska 527. 4 418. 6 108. 8 (26) Indiana 377. 2 285. 0 92. 2 (32) Minnesota 346. 5 337. 0 9. 5 (3) Ohio 246. 0 161. 2 84. 8 (53) Kansas 198. 9 140. 8 58. 1 (41) Missouri 178. 2 112. 2 66. 0 (59) South Dakota 146. 1 134. 7 11. 4 (8) Michigan 120. 9 90. 1 30. 8 (34) Kentucky 92. 1 51. 4 40. 7 (79)
Fertilizer labels • Minimum guaranteed amounts of available N, P 2 O 5 and K 2 O in fertilizer 5 – 10 – 30 N – P 2 O 5 – K 2 O Calculated on a % of total weight basis
Illinois law regulates fertilizer analysis, labeling and documentation of sales. http: //www. agr. state. il. us/Laws/Regs/fertilizer. pdf
Somewhat flexible interpretation of availability An element is considered "available" if the form in which it is added to the product has been shown to give plant responses or if the element can be dissolved from the product in water or in some other solvent which is recognized to indicate availability to plants.
When claims for such nutrients are made on the label, container, or application for registration, the minimum percentages which will be accepted for registration are as follows: ELEMENT % Calcium (Ca) 1. 00 Magnesium (Mg) 0. 50 Sulfur (S) 1. 00 Boron (B) 0. 02 Chlorine (Cl) 0. 10 Cobalt (Co) 0. 0005 Copper (Cu) 0. 05 Iron (Fe) 0. 10 Manganese (Mn) 0. 05 Molybdenum (Mo) 0. 0005 Sodium (Na) 0. 10 Zinc (Zn) 0. 05 Elements which are guaranteed shall appear in the order listed, immediately following the guaranteed analysis for the primary nutrients, nitrogen, phosphorus and potassium. 1. 00 -3. 00 -4. 00 -Ca 17. 00 --Mg 0. 40 -S 3. 00 --B 0. 01 -Cu 0. 05 -Fe
Warning or caution statements are required on the label for any product which contains 0. 03% or more of boron in a water-soluble form or 0. 001% or more of molybdenum. When 0. 001% or more of molybdenum is added to an agricultural fertilizer, the purchaser is to receive a caution statement as follows: "CAUTION: This fertilizer is to be used only on soils which respond to molybdenum. Crops high in molybdenum are toxic to ruminants. "
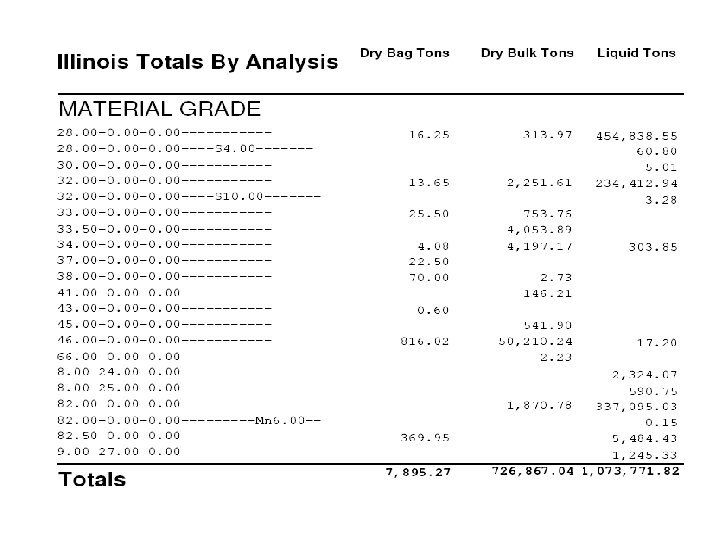
Fertilizer products are regularly tested in IL http: //www. agr. state. il. us/programs/fert 2/reports/Spring 2007 Lab. Totals. pdf
Excerpt from a recent speech on fertilizer quality control
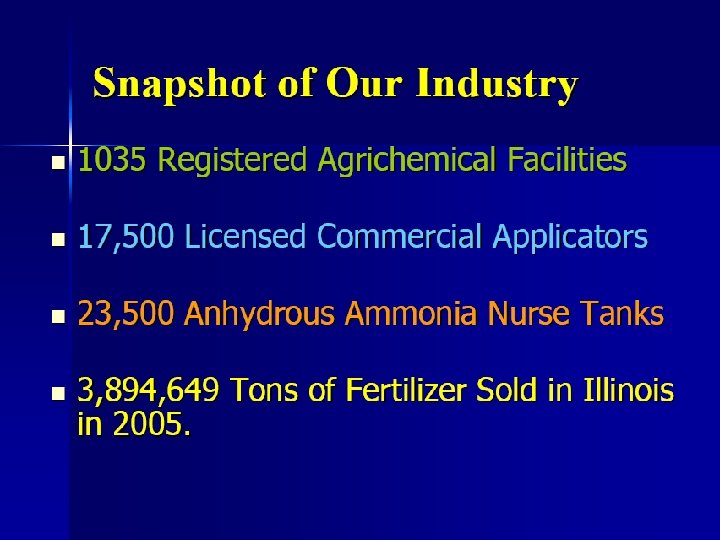
Fertilizer sales in IL are well documented
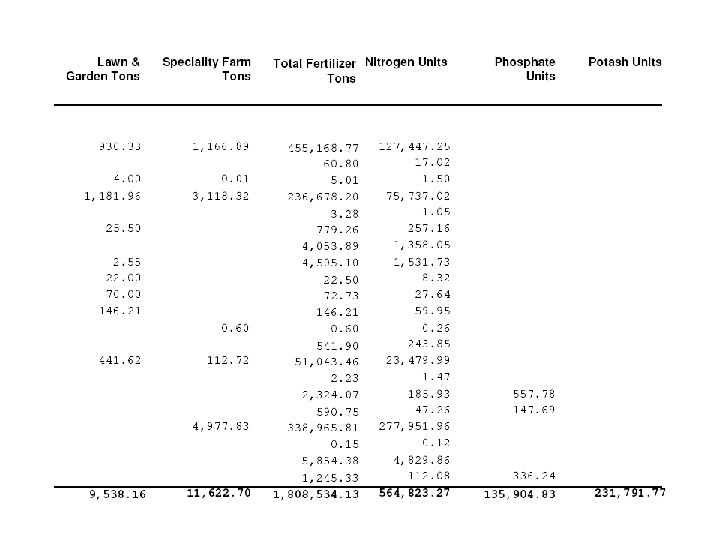
Fertilizer sales in IL (fall 2006/spring 07) July – December 2006 42% 56% Majority in the fall January – June 2007 58% 44% Majority in the spring 178, 125 1, 679, 670 2, 039, 496 168, 215 16, 564 3, 897, 293 1, 043, 307 342, 187 569, 491 Seasonal totals N P 2 O 5 K 2 O
K 2 O and P 2 O 5 fertilizer sales in IL K 2 O Material 0 -0 -60 MOP 0 -0 -62 99. 1 % of material grade 94% of total P 2 O 5 Material 0 -46 -0 MAP 11 -52 -0 10 -34 -0* DAP 18 -46 -0 98. 6 % of material grade 93. 6% of total fall 06 spring 07 207, 410 143, 041 92, 880 86, 821 569, 491 tons fall 06 spring 07 2605 980 32, 880 18, 989 15. 2% 2355 5, 328 144, 779 107, 710 73. 8% 342, 187 tons * (10 -30 -0, 10 -32 -0, 10 -34 -0, 11 -33 -0, 11 -37 -0)
N fertilizer materials (tons) Material MAP 11 -52 -0 DAP 18 -46 -0 10 -34 -0* 28 -0 -0 UAN 32 -0 -0 Urea 46 -0 -0 82 -0 -0 AA 82. 5 -0 -0 98. 8 % of material grade 94. 6% of total N fall 06 6, 955 56, 653 766 19, 173 12, 616 10, 136 293, 375 17, 906 spring 07 4, 017 10. 5% 42, 147 1, 567 127, 447 22. 5% 75, 737 23, 480 3. 2% 277, 952 55 % 4830 1, 043, 307 * (10 -30 -0, 10 -32 -0, 10 -34 -0, 11 -33 -0, 11 -37 -0)
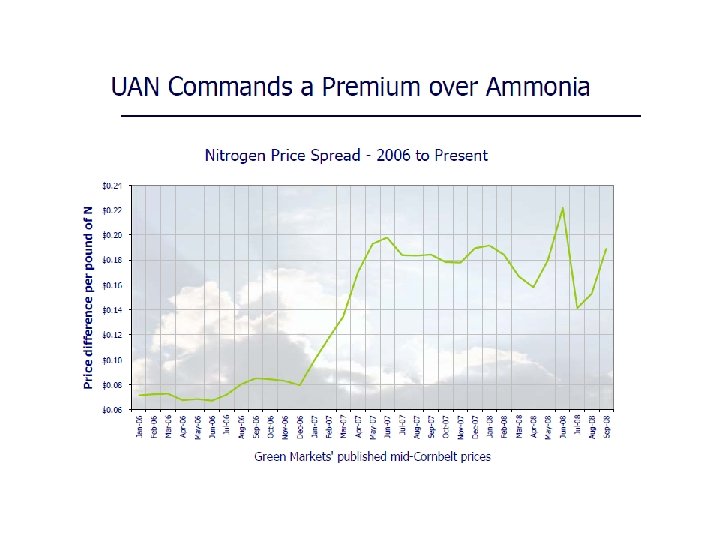
Shift toward greater use of urea and UAN
Terra presentation
Terra presentation
Joel, This looks to me like a lousy idea being promoted by individuals with vested interests in the ammonia industry. Ammonia is highly toxic, difficult to handle and has a very negative energy balance. As Bob said, using the H directly would be more efficient, but using the wind power electricity directly to charge electric vehicles or hybrids would be more efficient still. Of course, using natural gas directly to power vehicles would be much more efficient that first using it to make NH 3. I didn't see anywhere on the website or links that the net energy balance of using NH 3 was calculated…
A basic contention is that farmers need new fertilizers that provide a better match between crop growth curves and nutrient availability. New controlled-release nitrogen fertilizers are being developed while Additionally, farmers in the future will need new products to meet other fertilizers are already waiting to take market share once the stricter Environmental Protection Agency regulations controlling environmental and economic situation dictates growers switch from water quality, limiting nitrogen run-off and leaching and air conventional fertilizer products. emissions of nitrous oxide and ammonia. Companies continue to search for alternatives to the big four nitrogen There is recognition that farmers will not have the option of fertilizers---anhydrous ammonia, solid urea, ammonium nitrate and ammonium nitrate much longer because of all the restrictions and liquid UAN. security measures placed on its manufacture, transport, storage and sale. Anhydrous ammonia could go by the wayside quickly, too, with For the first time, company research is focusing on three fronts the right replacement product. Hidden costs and safety concerns are simultaneously--environmental impact, yield response and overall always in the back of retailers and farmers' minds about NH 3, but at economics. "A lot of the work done in the past has only been done the moment, knifing in NH 3 is a low-cost option for minimum-tillage looking at one or two of those components, but in today's world they situations. Because urea and UAN are not stable for surface need to look at all three, " says Jim Porterfield, special projects application, no-tillers and most growers are open to looking at research director with the economic analysis team of the American replacement products that don't readily volatilize. Farm Bureau Federation.
Most corn acres in IL receive N, P and K
Most soybean acres in IL do not receive fertilizer
Why? ? F 05/S 06 Millions of tons applied in US Nitrogen 12. 04 Phosphate 4. 48 Potash 4. 72 F 06/S 07 13. 19 4. 57 5. 13 + 9. 6 + 2. 1 + 8. 7
Where fall tillage is practiced, P and K are normally broadcast before tillage; where tillage is in the spring, fertilizer application is often in late winter or early spring. In many areas, particularly where corn is sown in cool soil or where inherent fertility is low, some of the P and K is applied at sowing as a band application below and to the side of the seed.
Irrigated corn In center pivot systems, IL farmers often apply 60 % of the total N pre-plant and the remainder in successive applications of ~ 20 lbs/acre through the center pivot. The last N application normally occurs around anthesis or a few weeks after.
Fertilizer Types • Straight Fertilizer – contains only one of the three major nutrients (e. g. , 46 -0 -0) • Mixed Fertilizer – contains more than one of the three major nutrients (e. g. , 18 -46 -0) • Complete Fertilizer – contains all three of the major nutrients (e. g. , 6 -24 -24)
Physical forms of fertilizer Solid powder, granular, prill (Normally treated to maximize flowability and minimize dust) bulk vs. bagged (>> 90 % bulk) Fluid/liquid ~ 40% of nutrients > 50% of all single nutrient carriers in US
Prills are formed by allowing drops of the prill substance to congeal in mid-air by being dripped from the top of a prilling tower. Ammonium nitrate, urea and many complete fertilizers are sold as prills
Solid materials can be blended but serious problems can occur such as segregation, chemical reactions and clumping from moisture in the air
Micronutrients can be blended with macronutrient fertilizers Segregation is likely to occur if granules are not all the same size
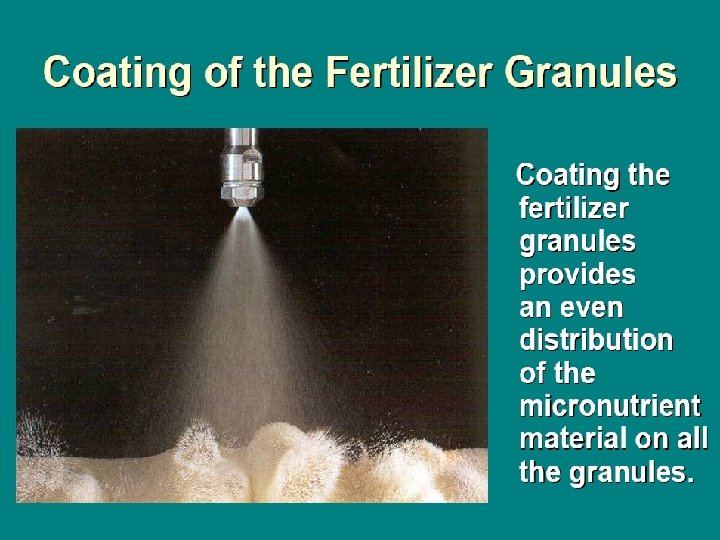
Micronutrient fertilizers have come a long way !
Methods/locations of application Broadcast on surface Broadcast w/incorporation Band at planting Deep injection Point injection Dribble on banding Foliar
Why use starter fertilizer ? • Precision placement – Higher nutrient use efficiency – Avoid skips and overlapping • Limits fixation of P and K by the soil • Soils slow to warm in the spring • Environmental benefits www. soils. wisc. edu/extension/teachingmaterials/Wolkowski/Row. Placed. Fertilizer 2004. ppt
Historically Starter “Was a Good Thing” • Lower soil test levels • Smaller planters • Limited corn acreage per farm • Lower availability of custom application • Response often linked to P www. soils. wisc. edu/extension/teachingmaterials/Wolkowski/Row. Placed. Fertilizer 2004. ppt
Early season growth response is not a guarantee of economic benefit • Starter fertilizers stimulate early plant growth and development • Early season growth response is not always a predictor of yield response • Yield response potential lower on high testing soils • Grain moisture reductions sometimes observed with starter when there is no yield response No-till corn planted with (left side) and without (right side) starter fertilizer – total application = 40 lbs N, 42 lbs P 2 O 5 and 33 lbs K 2 O per acre http: //www. ontariocorn. org/magazine/Issues/2006/03%20 March/F 1 -0306. html www. soils. wisc. edu/extension/teachingmaterials/Wolkowski/Row. Placed. Fertilizer 2004. ppt
Starter fertilizer use has changed • Loss of time-use efficiency at planting • Practicality of mounting and carrying attachments and fertilizer on very large planters • Cost of attachments • Lower potential for response on high testing soils John Deere Website www. soils. wisc. edu/extension/teachingmaterials/Wolkowski/Row. Placed. Fertilizer 2004. ppt
Economics of starter fertilizer attachments in IL Total Attachments on Field Planter 8 -row Planter Capacity List Price $ ac/hr No attachments 26, 400 9. 3 2 x 2 -banded fertilizer attachments 34, 700 8. 0 Starter attachments increased planter price 31 % and slowed planting 14 % Hibbard et al. , 1996 Avg. cost of 8 -row planter with starter since purchase Years after purchase Seedplaced 2 x 2 ------ $/ac ----- 2 2. 05 4. 10 4 1. 35 2. 70 6 1. 10 2. 20 8 1. 00 2. 00 10 0. 90 1. 80 Cost of starter attachments decreases with time and use (500 acres per year) www. soils. wisc. edu/extension/teachingmaterials/Wolkowski/Row. Placed. Fertilizer 2004. ppt
Many factors affect the probability of response to starter fertilizer • • Soil test P and K p. H Organic matter Manure use Soil texture Hybrid maturity Planting date Previous crop • • Soil type Latitude Fertilizer grade Soil yield potential • Weather • Placement • Tillage www. soils. wisc. edu/extension/teachingmaterials/Wolkowski/Row. Placed. Fertilizer 2004. ppt
Conservation tillage systems are more responsive to starter fertilizer • Positional availability – Lack of mixing by tillage – Immobilization • Wheel track vs. non-wheel track effects on root distribution • Cooler soil conditions • Reduced K uptake from zones of poor aeration www. soils. wisc. edu/extension/teachingmaterials/Wolkowski/Row. Placed. Fertilizer 2004. ppt
Yield response to starter fertilizer in selected no-till corn experiments Treatment Location Response Missouri Scharf (1999) N, P, K; 2 x 2 6 of 6 expts. 13 bu/a incr. Iowa Buha et al. (1999) N, P, K; 2 x 2 7 of 9 expts. 4 -18 bu/a incr. Wisconsin Bundy - Widen (1999) N, P, K; 2 x 2 8 of 12 expts. 15 bu/a incr. Illinois Ritchie et al. (1996) N, P, K; 2 x 2 8 of 9 expts. 14 bu/a incr. www. soils. wisc. edu/extension/teachingmaterials/Wolkowski/Row. Placed. Fertilizer 2004. ppt
Regional trend for more conservation tillage • Eight Midwestern states: – 106 million acres of cropland – 37 percent of all U. S. cropland • 46% of no-till acres in U. S. in the Midwest • 2002 Midwest data – 17 million acres of no-till soybeans – 7 million acres of no-till corn – Forty-five million acres (42. 5 %) used conservation tillage CTIC Website (2002 data) www. soils. wisc. edu/extension/teachingmaterials/Wolkowski/Row. Placed. Fertilizer 2004. ppt
What about seed-placement ? § Some suggest higher availability for seed-placed materials § Difficult to include K § Avoid high salt carriers and use on salt-sensitive crops § No urea, UAN, ATS § Limit to 10 lb N + K 2 O/a § Use with caution on sandy or dry soils www. soils. wisc. edu/extension/teachingmaterials/Wolkowski/Row. Placed. Fertilizer 2004. ppt
Relationship Between Soil Test K Level and Yield Response to Starter Fertilizer at Arlington, 1995 www. soils. wisc. edu/extension/teachingmaterials/Wolkowski/Row. Placed. Fertilizer 2004. ppt
Relationship between temperature and maximum soil test K level where yield response occurred to starter fertilizer www. soils. wisc. edu/extension/teachingmaterials/Wolkowski/Row. Placed. Fertilizer 2004. ppt
www. soils. wisc. edu/extension/teachingmaterials/Wolkowski/Row. Placed. Fertilizer 2004. ppt Poorly Developed Root Systems Cannot Explore the Entire Soil Volume (Which Side Received Starter? )
Compaction affects nutrient uptake ! Potassium Affected Most • Compaction reduces porosity and limits root growth • Lowers soil O 2 and slower replenishment from the atmosphere • O 2 needed for root respiration and active uptake of K • Compacted soils are often responsive to K fertilization www. soils. wisc. edu/extension/teachingmaterials/Wolkowski/Row. Placed. Fertilizer 2004. ppt
Row K Effects on Corn Yield with Increasing Soil Compaction Initial K Soil test = 102 ppm www. soils. wisc. edu/extension/teachingmaterials/Wolkowski/Row. Placed. Fertilizer 2004. ppt
Summary of starter fertilizer concepts Research indicates that it is worth the time and expense in many situations • N or N-P starters may not maximize response – Complete (NPK) starters give a more consistent response • Research shows K in starter is important – Reduced tillage – Low K soils – Compacted soils www. soils. wisc. edu/extension/teachingmaterials/Wolkowski/Row. Placed. Fertilizer 2004. ppt
Summary continued • Frequency and size of response to starter is influenced by GDD accumulation – • Response to starter occurred at higher soil test K levels in cooler growing seasons Recommendations - Use a complete starter - Use fluids containing K - If using seed placement, avoid materials and rates that are likely to harm seeds/seedlings www. soils. wisc. edu/extension/teachingmaterials/Wolkowski/Row. Placed. Fertilizer 2004. ppt
Are you familiar with the Illinois Fertilizer and Chemical Association ?
http: //www. ilfb. org/uploads/adhoc/Payne_Workshop_b 1. pdf
Allocate fertilizer to most responsive areas. More responsive areas are not very sensitive to price fluctuations. Examples of areas that are very likely to be responsive: • areas with low P and K soil test levels • areas that are coarser textured and/or have low organic matter contents • areas where corn will not follow a legume crop/cover crop
Because the yield response is normally large at low soil test levels, the short-term economically optimum rate (EOR) does not change much as prices vary.
Smaller yield responses when soil test levels are medium result in greater variation in EOR in response to fluctuating prices. When the nutrient price is higher relative to the crop price, only lower rates are justified. However, when nutrient price is lower relative to the crop price, higher rates are needed.
EOR ~ 0 when soil test levels are high
When fertilizer is scare or expensive, allocate fertilizer to most responsive areas! More responsive areas are not very sensitive to price fluctuations. Examples of areas that are very likely to be responsive: • areas with low P and K soil test levels • areas that are coarser textured and/or have low organic matter contents • areas where corn will not follow a legume crop/cover crop
Apply some fertilizer to less responsive areas as well! Most of the crop response occurs with the first few units of added nutrient. Reductions are economically justified when nutrient prices are more expensive relative to crop prices. Examples of areas that are less likely to be responsive: • areas with medium P and K soil test levels • finer-textured soils and/or areas with higher OM content • where corn is following a legume crop or cover crop
When more than one nutrient is limiting, additions of the nutrients can interact to produce greater crop response than any particular nutrient applied alone. Various combinations of 2 nutrients can produce the same yield (one curve) or different yields (moving from one curve to another).
University recommendations are generally based upon experiments that change the level of only one nutrient, while keeping all other nutrient levels high Because there are several combinations of both nutrients that can produce the same yield, there is some flexibility in how we combine the nutrients to attain a given yield, based upon nutrient price Try to apply at least some of all nutrients that are in short supply in the soil to take advantage of positive interactive effects
If only a low rate of a needed nutrient can be afforded, consider banding it and placing it strategically. Roots should be able to intercept it early in their development, but the nutrient should be placed far enough from the seed to minimize any possibilities of damage. If a higher nutrient rate can be afforded, consider banding part of it strategically and broadcasting and incorporating the rest to fertilize a greater soil volume