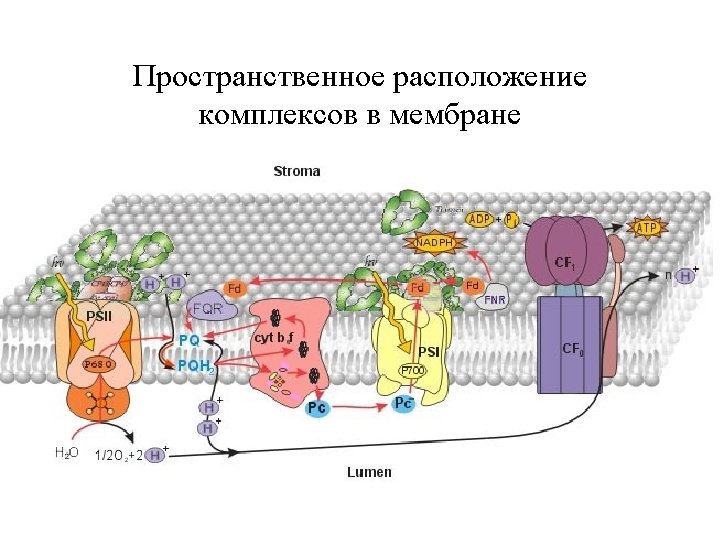
Photosynthetic pathways in chloroplasts NADPH hn PS II


- Slides: 40
Photosynthetic pathways in chloroplasts NADPH hn PS II fluorescence QA Chl 2 H+ PQ P 680 PQ Chl PQH 2 H 2 O 2 H+ 1/2 O 2 Dp. H bf NADP+ bh Fd Fe. SI bl Fe. SR f + Pc -OOC Q-cycle lumen Thylakoid membrane _ F Cl- Fm F 0 stroma ATP-synthase 0 1 10 t, c Chl P 700 R-COO- 3 H+ H+ K+ hn PS I Calvin cycle R-C -OOC + OO - _ ADP + Pi ATP
z 1 14 z 2 Chl* Phe QA Q B 2 - Chl 15 Phe QA Q B 2 + 2 H s 2 g 1 g 2 28 Chl* Phe QA 29 35 z 4 17 Chl* Phe QA QB Chl Phe Q A Q B 2 - + 2 H s Chl Phe QA 30 Chl Phe Q A PQ Chl + Phe QA QB Hl + 31 g 5 Chl Phe Q A PQ 3 Chl + Phe Q A QB z 7 Chl* Phe Q A Q B 2 - g 6 32 l 4 + 2 H s 27 PQH 2 g 7 Chl* Phe Q A 33 Chl + Phe Q A 40 x 6 5 Chl* Phe Q A QB 41 PQ 39 x 5 Chl Phe Q A QB Chl + Phe Q A Q B 2 - PQ 38 H+ 20 + 2 H s 26 PQH 2 PQ 37 x 4 19 + 2 Hs 25 PQH 2 2 + z 6 Chl Phe Q A Q B 2 - 24 PQH g 4 x 3 2 18 z 5 + 2 H s 23 PQH 2 + Hl + + 36 x 2 1 Chl Phe QA Q B 2 - PQ 34 x 1 + g 3 PQ Chl Phe QA QB 16 + 2 Hs 22 PQH 2 21 PQH Chl Phe QA z 3 x 7 6 Chl + Phe Q A QB Scheme of the states of Photosystem 2 7 y 1 Chl Phe QA Q B - y 2 8 Chl* Phe QA Q B - y 3 9 + Chl Phe QA Q B - y 4 10 + Chl Phe Q A Q B Hl + 11 y 5 Chl 12 Phe Q A Q B y 6 Chl* Phe Q A Q B - y 7 13 Chl + Phe Q A Q B - Cl-chlirophyll Phe-pheophytitn QA, Qb – quinone acceptors
The photosystem II model block considers electron transfer processes at the donor and acceptor sides of PSII taking into account the recombination processes including non -radiative recombination in PS II (arrows)
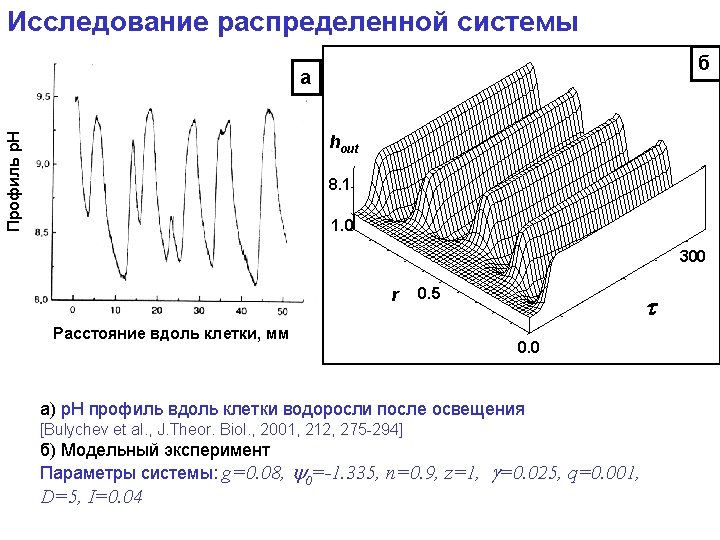
Fluorescence induction curve Photosynthetic efficiency P F Fv D Fo O Fm S Fo 0 0. 05 0. 7 Time (s) 5
The scheme of time scales of protein molecular dynamics Primary events in photosynthesis and vision 10 -13 – 10 -12 s Local dynamics of atoms and small groups 10 -12 – 10 -11 s -of side chains and polypeptide chain segments 10 -11 – 10 -7 s Motions of domains and subunits 10 -8 – 10 -5 s Release of bound ligand molecules 10 -6 – 10 -3 s Folding-unfolding kinetics 10 -4 – 102 s
CH CL QB QA CL Mb - CO P+ I P* Bchl Bpheo QA P* P* Bpheo QA QB P 700 A 0 A 1 FX FB FA 10 -6 s DA 106 10 -12 s init. H 2 O D 2 O 103 180 K ktunn > kact Ri DA final R* Rf at T<700 K
1 Conf. 2 Tunneling 3 Conf.
Q -A Frozen in the dark e-induced Frozen under illumination conform Q -A. P+ QB P+ QA QB
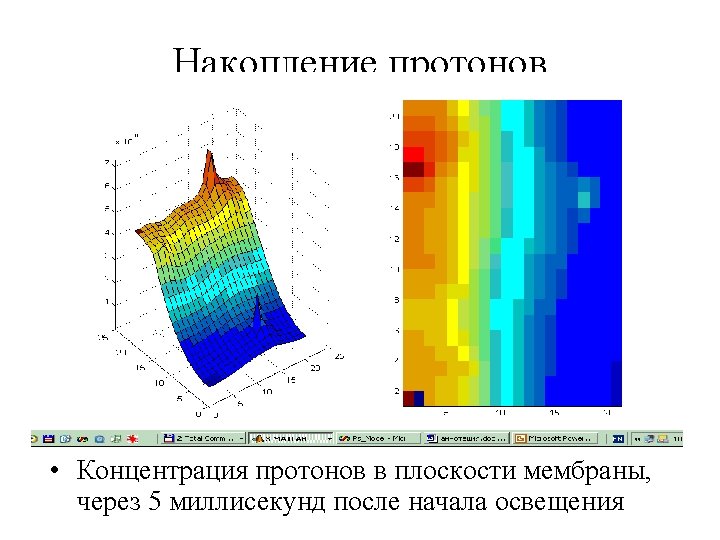
Scene of the direct model
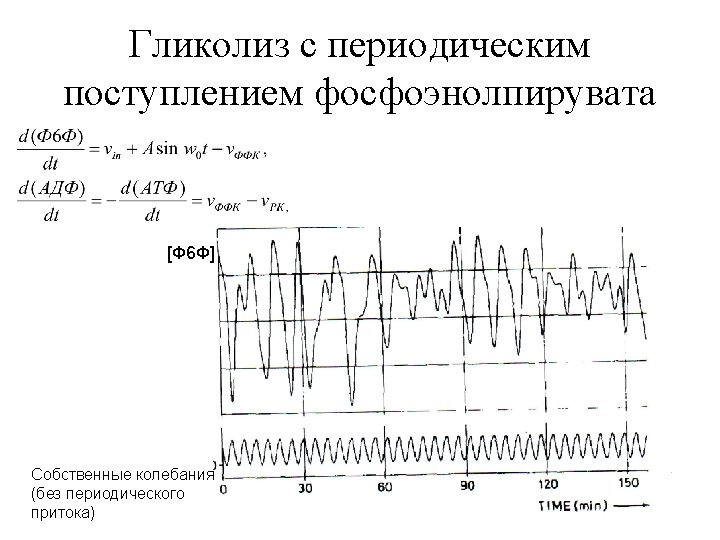
Brownian motion of the mobile carrier • Langeven Equation: dx ξ = f ( t ) dt • f(t) – casual force, distributed by Gauss • average value - zero • dispersion 2 k. Tξ • k – Bolzmann constant, T – temperature, ξ – friction coefficient of the media
Model trajectory of PQ in membrane filled by PS 1 and cytochrome complexes
model Ecvipotential surfaces calculated according to Poisson-Bolzmann equations Reduced cyt f Oxidesed Рс r 3 r 4 r 2 r 1 Ion strength - 100 m. M, p. H=7, εр-ра=80; εбелка =2; red -6. 5 м. В, blue + 6. 5 м. В; green – atoms of molecules. Dotted lines connect residueson Pc and Cytf that were used by simulation for calculation the distance between proteins
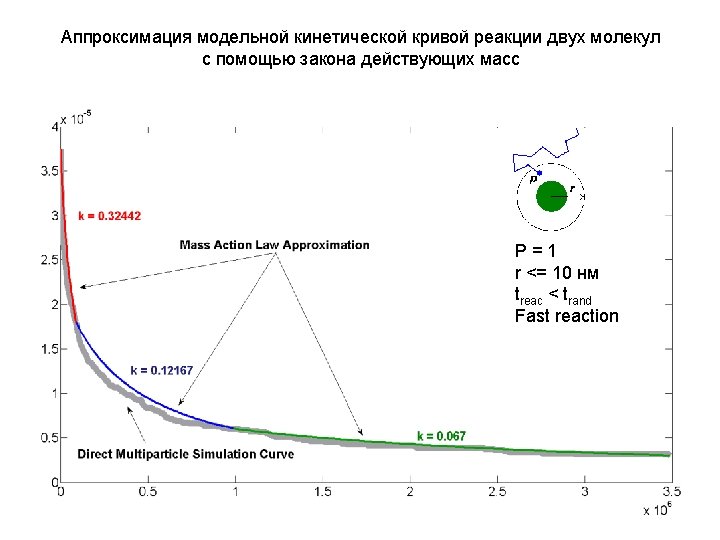
The model After the simulation is done, we need to estimate the rate of protein complex formation rate Reaction rate: k Reaction that we simulate: P 1+P 2 P 1 P 2 V = k[P ] We estimate k by fitting 1 2 The result of multiparticle direct simulation: P = 0. 01 r <= 1 нм treac > trand Slow reaction Concentration of P 1 P 2 k Simulated curve Fitted curve according to mass action law Time
• • • Galina Riznichenko Evgeny Grachev Natalia Beljaeva Pavel Gromov Ilia Kovalenko Dmitry Ustinin Anna Abaturova Tatjana Plusnina Nastja Lavrova Vladimir Paschenko Petr Noks