P Julia Mary Assistant Professor Department of Mathematics


 introduced the idea of graphical")


 have a cumulative")


- Slides: 17
P. Julia Mary Assistant Professor Department of Mathematics -Shift II
FUNDAMENTALS OF MATHEMATICAL STATISTICS
HISTORY OF STATISTICS �In 1786 William Playfair (1759 -1823) introduced the idea of graphical representation into statistics. He invented the line chart, bar chart and histogram and incorporated them into his works on economics, the Commercial and Political Atlas.
A FACT OR PIECE OF DATA OBTAINED FROM A STUDY OF A LARGE QUANTITY OF NUMERICAL DATA IS CALLED STATISTICS. BRANCH OF MATHEMATICS CONCERNED WITH COLLECTION, CLASSIFICATION, ANALYSIS, AND INTERPRETATION OF NUMERICAL FACTS, FOR DRAWING INFERENCES ON THE BASIS OF THEIR QUANTIFIABLE LIKELIHOOD (PROBABILITY). STATISTICS CAN INTERPRET AGGREGATES OF DATA TOO LARGE TO BE INTELLIGIBLE BY ORDINARY OBSERVATION BECAUSE SUCH DATA (UNLIKE INDIVIDUAL QUANTITIES) TEND TO BEHAVE IN REGULAR, PREDICTABLE MANNER
CONTENT: �PROBABILITY �RANDOM VARIABLES AND DISTRIBUTION FUNCTIONS �CORRELATION 2 �X DISTRIBUTION �t , f and z DISTRIBUTION �TEST OF HYPOTHESIS
PROBABILITY �Probability is the measure of the likelihood that an event will occur. Probability is quantified as a number between zero and one . where, loosely speaking, zero indicates impossibility and one indicates certainty. The higher the probability of an event, the more likely it is that the event will occur.
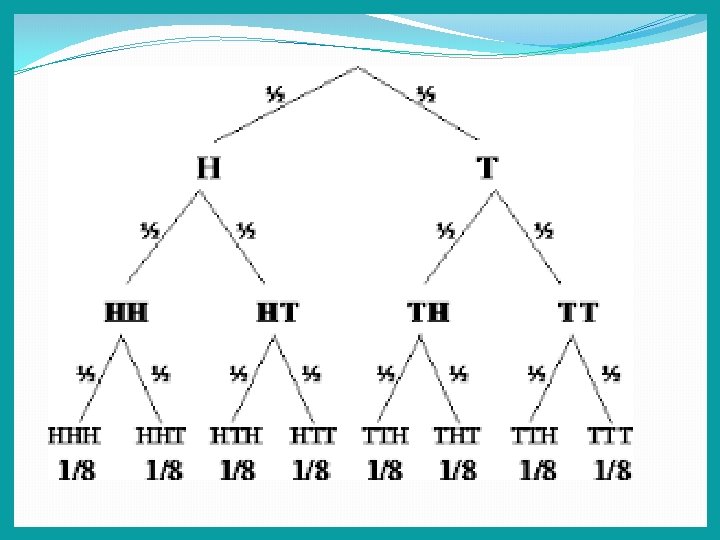
EXAMPLE: TOSSING A COIN
CARDS:
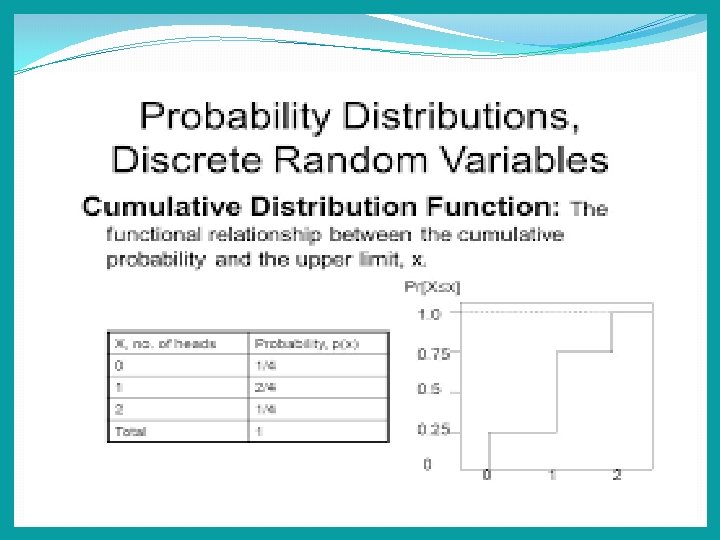
RANDOM VARIABLES AND DISTRIBUTION FUNCTIONS �All random variables (discrete and continuous) have a cumulative distribution function. It is a function giving the probability that the random variable X is less than or equal to x, for every value x. For a discrete random variable, the cumulative distribution function is found by summing up the probabilities.
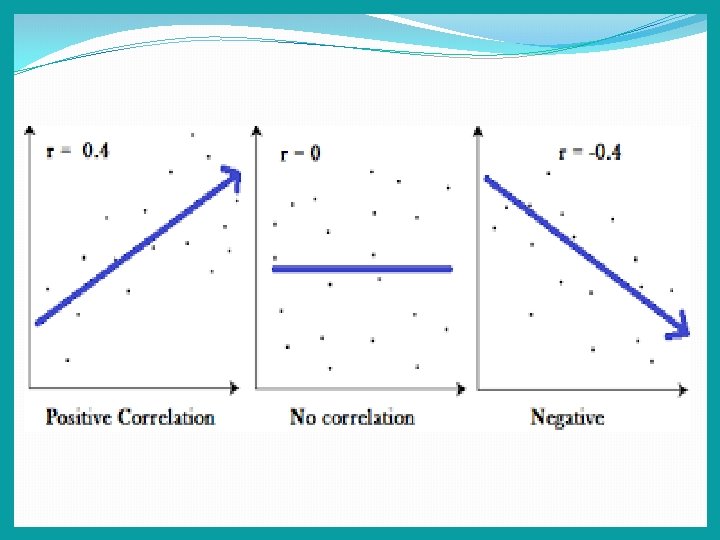
CORRELATION What is Correlation? Correlation is used to test relationships between quantitative variables or categorical variables In other words, it’s a measure of how things are related. The study of how variables are correlated is called correlation analysis. Some examples of data that have a high correlation: Your caloric intake and your weight. Your eye color and your relatives’ eye colors. The amount of time your study and your GPA. Some examples of data that have a low correlation (or none at all): the type of cereal you eat. A dog’s name and the type of dog biscuit they prefer. The cost of a car wash and how long it takes to buy a soda inside the station.
2 X DISTRIBUTION By the central limit theorem, because the chisquared distribution is the sum of k independent random variables with finite mean and variance, it converges to a normal distribution for large k. Specifically, if X ~ χ2(k) , then as k tends to infinity, the distribution of tends to a standard normal distribution.
t , f and z DISTRIBUTION
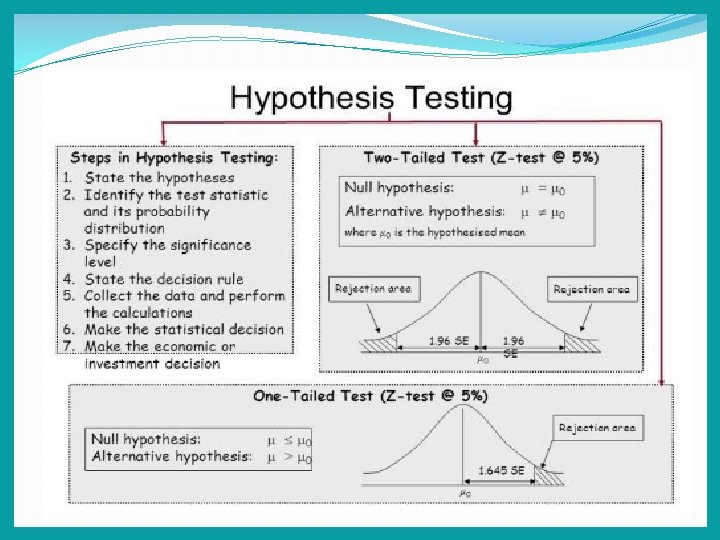
TEST OF HYPOTHESIS �Testing H 0 at significance level α means testing H 0 with a test whose size does not exceed α. The probability, assuming the null hypothesis is true, of observing a result at least as extreme as the test statistic. Statistical significance test. A predecessor to the statistical hypothesis test.